| Param | Original file | Final file |
|---|---|---|
| Filename | modeM0/AS1A07_027T16_9000003222_21731cztM0_level2.evt | modeM0/AS1A07_027T16_9000003222_21731cztM0_level2_quad_clean.evt |
| Size (bytes) | 167,760,000 | 12,438,720 |
| Size | 160.0 MB | 11.9 MB |
| Events in quadrant A | 1,484,633 | 54,010 |
| Events in quadrant B | 1,138,328 | 58,747 |
| Events in quadrant C | 1,137,810 | 56,539 |
| Events in quadrant D | 1,176,044 | 55,960 |
| Mode M9 | |||
|---|---|---|---|
| Quadrant | BADHDUFLAG | Total packets | Discarded packets |
| A | 0 | 1 | 0 |
| B | 0 | 1 | 0 |
| C | 0 | 1 | 0 |
| D | 0 | 1 | 0 |
| Mode SS | |||
|---|---|---|---|
| Quadrant | BADHDUFLAG | Total packets | Discarded packets |
| A | 0 | 44 | 0 |
| B | 0 | 44 | 0 |
| C | 0 | 44 | 0 |
| D | 0 | 44 | 0 |
| Mode M0 | |||
|---|---|---|---|
| Quadrant | BADHDUFLAG | Total packets | Discarded packets |
| A | 0 | 5791 | 1 |
| B | 0 | 4691 | 1 |
| C | 0 | 4671 | 1 |
| D | 0 | 4917 | 1 |
| Quadrant | Total seconds | Saturated seconds | Saturation percentage |
|---|---|---|---|
| A | 2072 | 359 | 17.326255% |
| B | 2072 | 221 | 10.666023% |
| C | 2072 | 212 | 10.231660% |
| D | 2072 | 198 | 9.555985% |
Noise dominated data is calculated using 1-second bins in cleaned event files. If a bin has >2000 counts, and if more than 50% of those come from <1% of pixels, then it is considered to be noise-dominated and hence unusable.
| Quadrant | # 1 sec bins | Bins with >0 counts | Bins with >2000 counts | High rate bins dominated by noise | Noise dominated (total time) | Noise dominated (detector-on time) | Marked lightcurve |
|---|---|---|---|---|---|---|---|
| A | 2237 | 2073 | 133 | 133 | 5.95% | 6.42% | 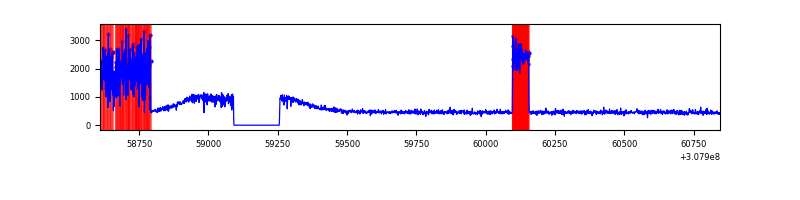 |
| B | 2237 | 2073 | 2 | 2 | 0.09% | 0.10% | 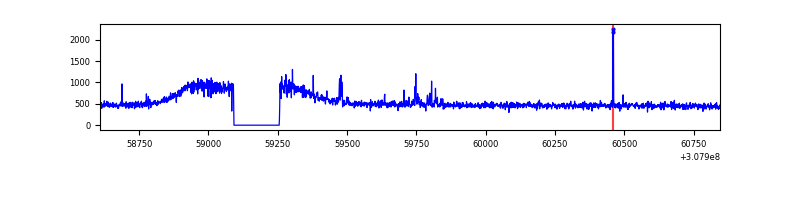 |
| C | 2237 | 2073 | 0 | 0 | 0.00% | 0.00% | 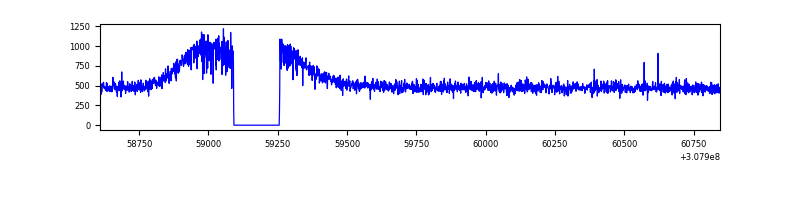 |
| D | 2237 | 2073 | 16 | 16 | 0.72% | 0.77% | 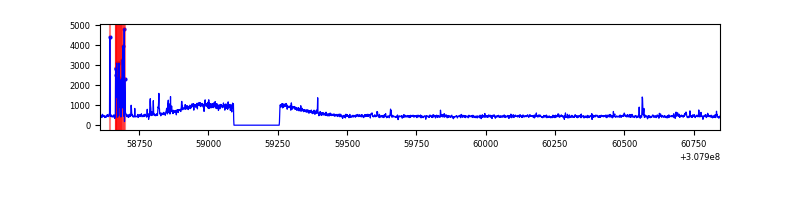 |
Top three noisy pixels from each quadrant. If the there are fewer than three noisy pixels in the level2.evt file, extra rows are filled as -1
| Pixel properties | Quadrant properties | ||||||
|---|---|---|---|---|---|---|---|
| Quadrant | DetID | PixID | Counts | Sigma | Mean | Median | Sigma |
| A | 15 | 236 | 399652 | 6701.66 | 280 | 272 | 59.6 |
| A | 5 | 16 | 4482 | 70.64 | 280 | 272 | 59.6 |
| A | 13 | 254 | 2816 | 42.69 | 280 | 272 | 59.6 |
| B | 3 | 64 | 20638 | 348.15 | 282 | 273 | 58.5 |
| B | 12 | 111 | 7460 | 122.87 | 282 | 273 | 58.5 |
| B | 0 | 189 | 6977 | 114.61 | 282 | 273 | 58.5 |
| C | 14 | 238 | 40747 | 576.92 | 281 | 281 | 70.1 |
| C | 13 | 61 | 2000 | 24.51 | 281 | 281 | 70.1 |
| C | 2 | 254 | 658 | 5.37 | 281 | 281 | 70.1 |
| D | 12 | 235 | 49739 | 683.56 | 287 | 277 | 72.4 |
| D | 2 | 136 | 39884 | 547.36 | 287 | 277 | 72.4 |
| D | 2 | 234 | 5974 | 78.73 | 287 | 277 | 72.4 |
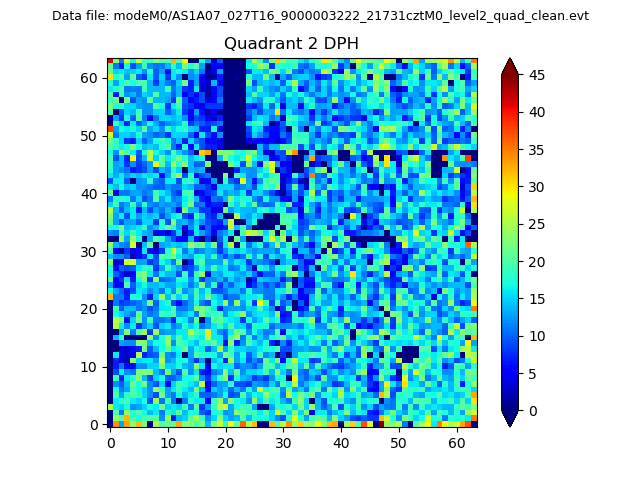
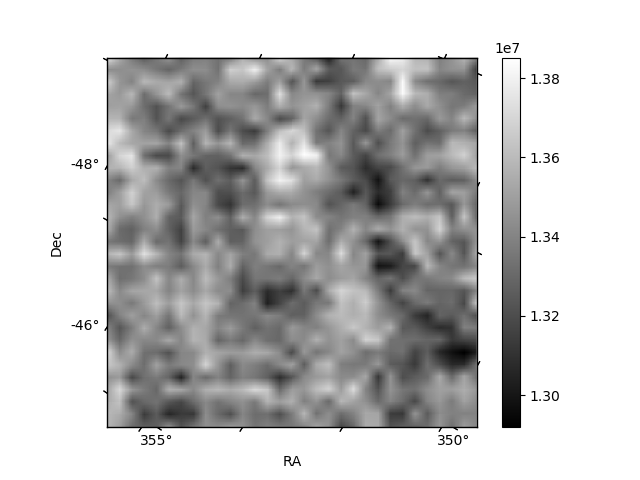
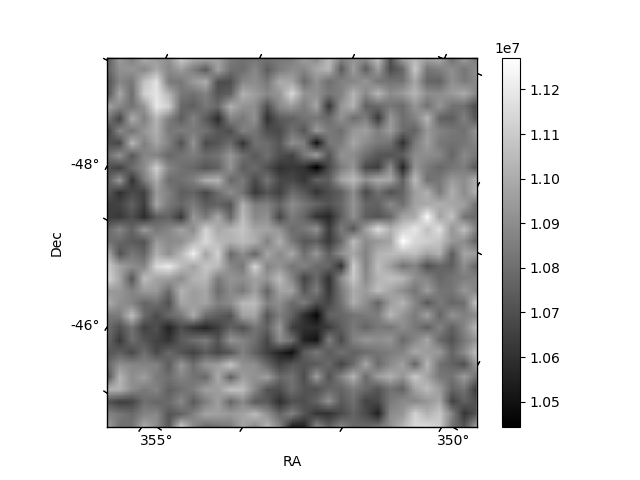
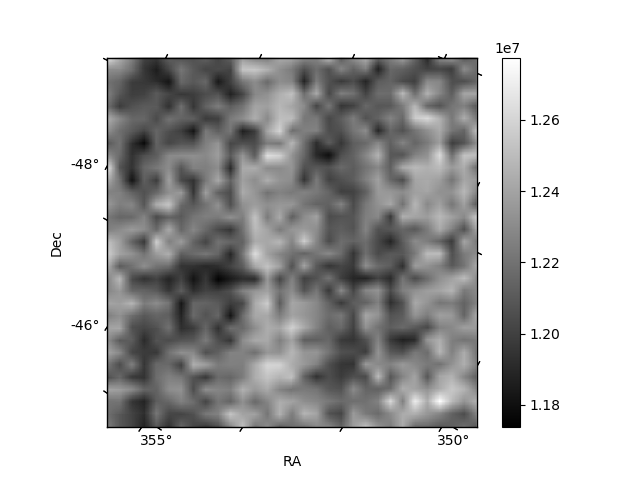
Histogram calculated using DETX and DETY for each event in the final _common_clean file
| Quadrant A | 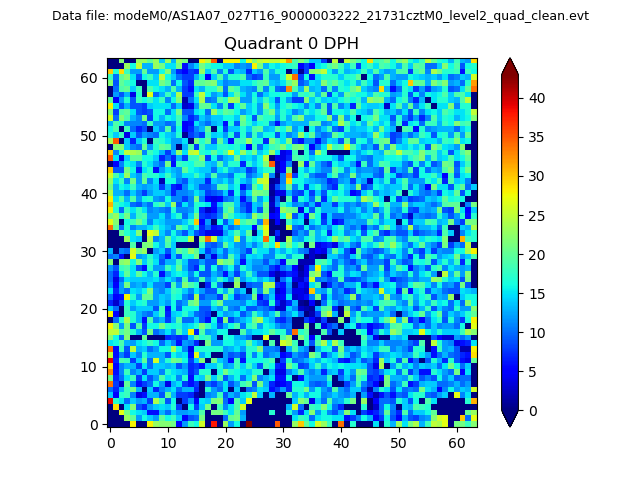 |
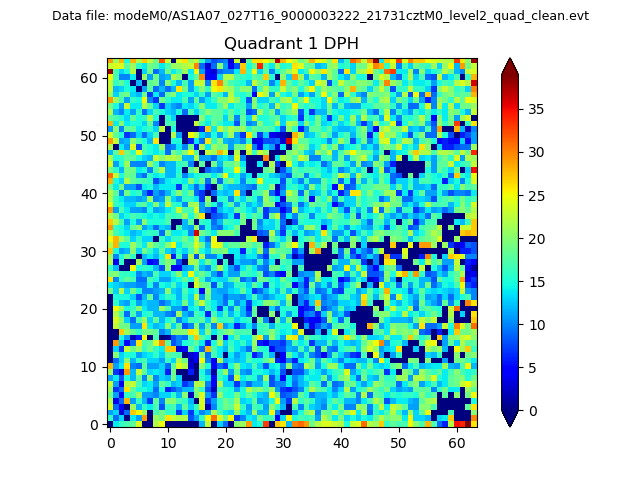 |
Quadrant B |
|---|---|---|---|
| Quadrant D | 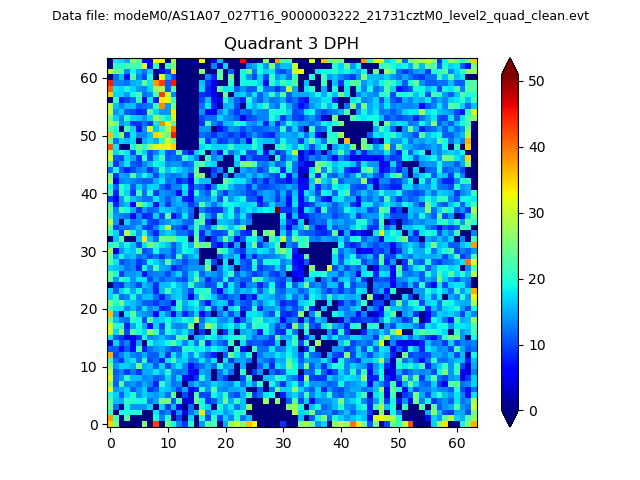 |
 |
Quadrant C |
| Plot type | Count rate plots | Images |
|---|---|---|
| Comparison with Poisson distribution Blue bars denote a histogram of data divided into 1 sec bins. Red curve is a Poisson curve with rate = median count rate of data. |
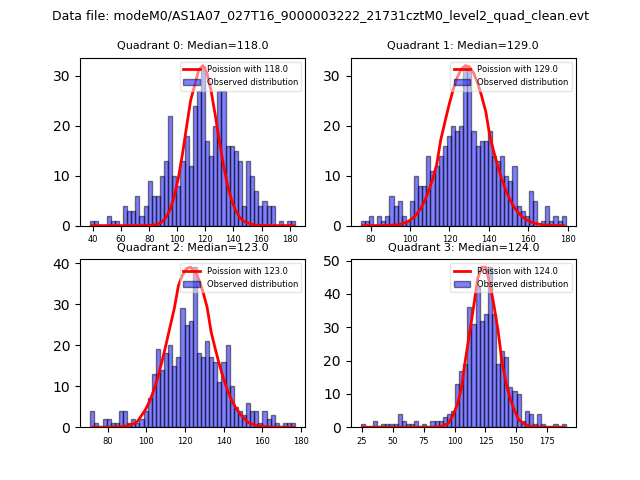 |
 |
| Quadrant-wise count rates Data is divided into 100 sec bins |
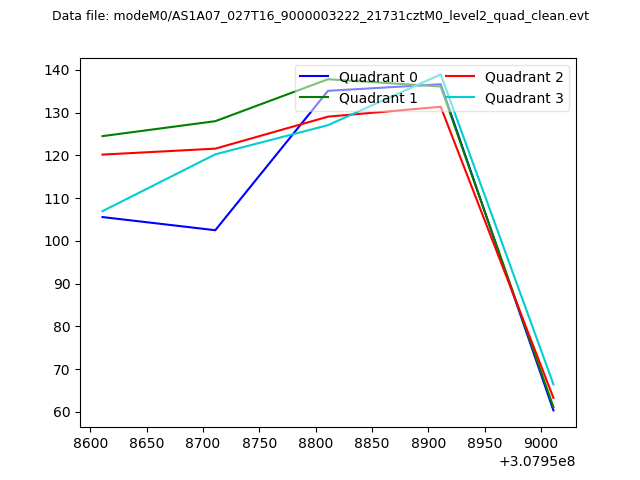 |
|
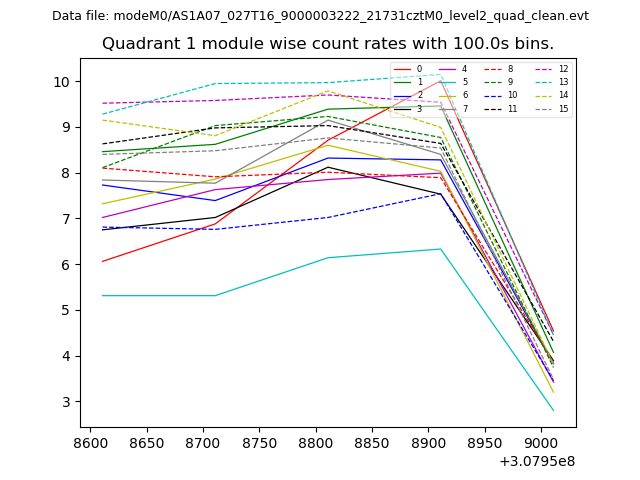
| Module-wise count rates for Quadrant A Data is divided into 100 sec bins |
 |
 |
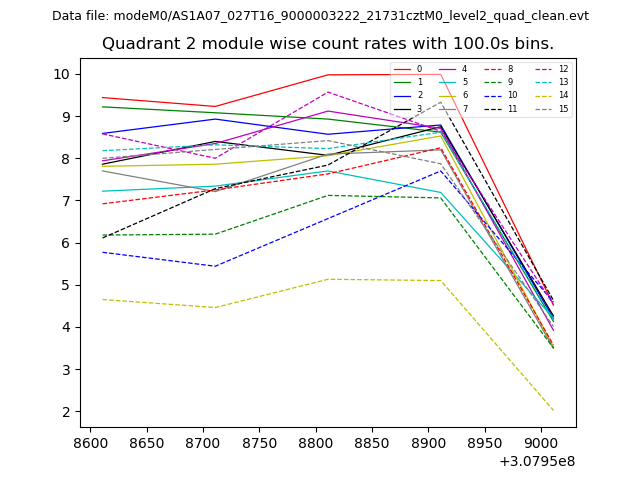
| Module-wise count rates for Quadrant B Data is divided into 100 sec bins |
 |
 |
| Module-wise count rates for Quadrant C Data is divided into 100 sec bins |
 |
 |
| Module-wise count rates for Quadrant D Data is divided into 100 sec bins |
 |
 |
| Parameter | Plot |
|---|---|
| CZT HV Monitor | 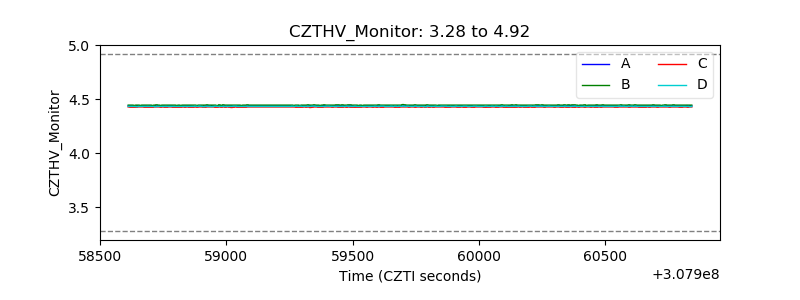 |
| D_VDD | 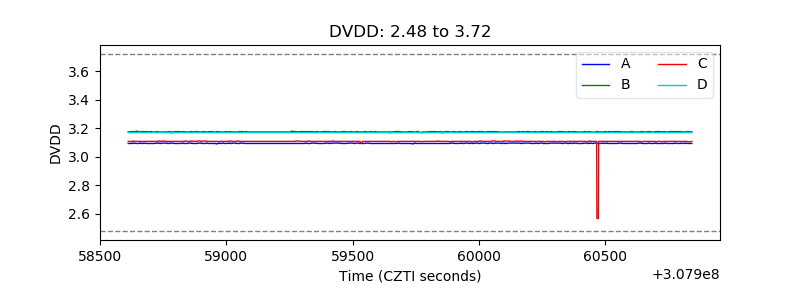 |
| Temperature 1 |  |
| Veto HV Monitor | 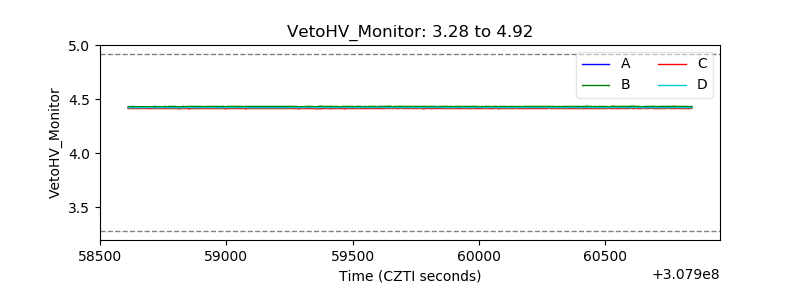 |
| Veto LLD | 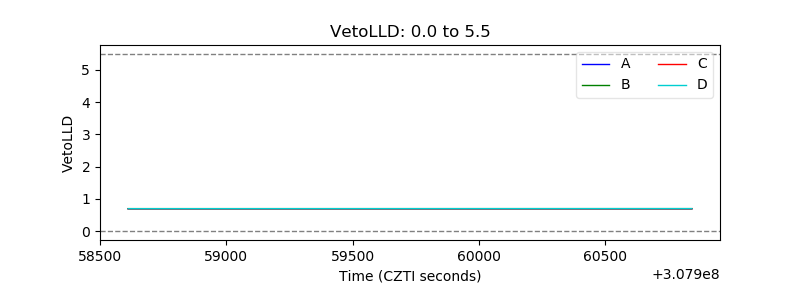 |
| Alpha Counter | 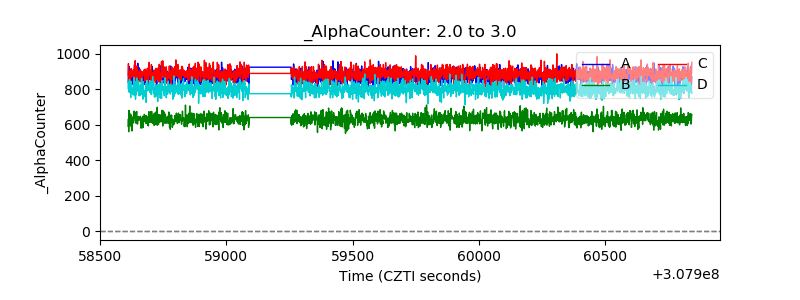 |
| _CPM_Rate | 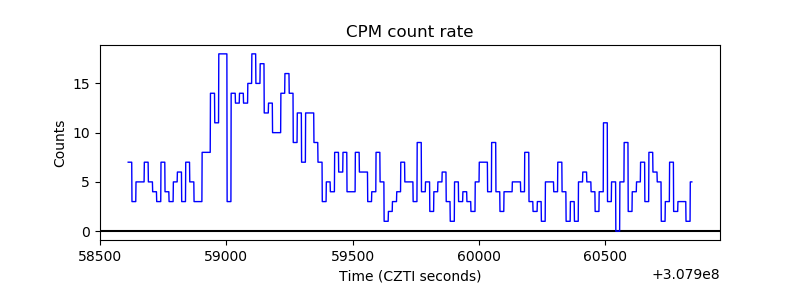 |
| CZT Counter | 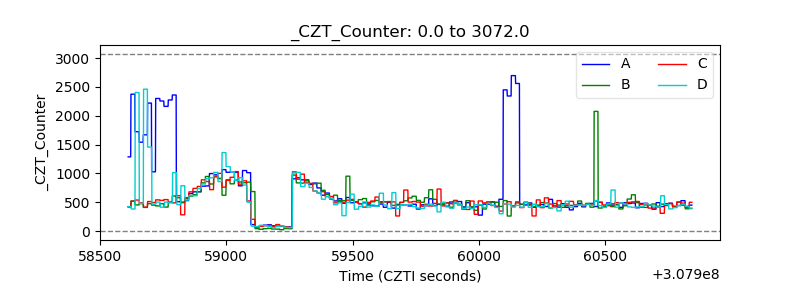 |
| +2.5 Volts monitor |  |
| +5 Volts monitor |  |
| _ROLL_ROT | 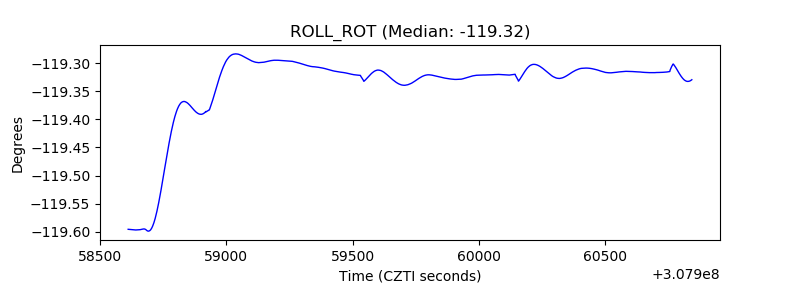 |
| _Roll_DEC |  |
| _Roll_RA | 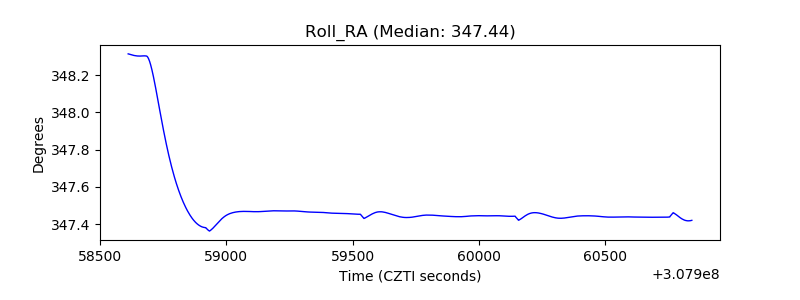 |
| Veto Counter |  |