| Param | Original file | Final file |
|---|---|---|
| Filename | modeM0/AS1A07_027T16_9000003222_21732cztM0_level2.evt | modeM0/AS1A07_027T16_9000003222_21732cztM0_level2_quad_clean.evt |
| Size (bytes) | 602,360,640 | 90,708,480 |
| Size | 574.5 MB | 86.5 MB |
| Events in quadrant A | 5,059,358 | 526,957 |
| Events in quadrant B | 4,295,247 | 564,416 |
| Events in quadrant C | 3,970,798 | 550,106 |
| Events in quadrant D | 4,364,649 | 539,317 |
| Mode M9 | |||
|---|---|---|---|
| Quadrant | BADHDUFLAG | Total packets | Discarded packets |
| A | 0 | 5 | 0 |
| B | 0 | 5 | 0 |
| C | 0 | 5 | 0 |
| D | 0 | 5 | 0 |
| Mode SS | |||
|---|---|---|---|
| Quadrant | BADHDUFLAG | Total packets | Discarded packets |
| A | 0 | 166 | 0 |
| B | 0 | 166 | 0 |
| C | 0 | 166 | 0 |
| D | 0 | 166 | 0 |
| Mode M0 | |||
|---|---|---|---|
| Quadrant | BADHDUFLAG | Total packets | Discarded packets |
| A | 0 | 20473 | 2 |
| B | 0 | 17999 | 2 |
| C | 0 | 17095 | 2 |
| D | 0 | 18513 | 2 |
| Quadrant | Total seconds | Saturated seconds | Saturation percentage |
|---|---|---|---|
| A | 8139 | 820 | 10.074948% |
| B | 8139 | 352 | 4.324856% |
| C | 8139 | 333 | 4.091412% |
| D | 8139 | 326 | 4.005406% |
Noise dominated data is calculated using 1-second bins in cleaned event files. If a bin has >2000 counts, and if more than 50% of those come from <1% of pixels, then it is considered to be noise-dominated and hence unusable.
| Quadrant | # 1 sec bins | Bins with >0 counts | Bins with >2000 counts | High rate bins dominated by noise | Noise dominated (total time) | Noise dominated (detector-on time) | Marked lightcurve |
|---|---|---|---|---|---|---|---|
| A | 8669 | 8141 | 472 | 472 | 5.44% | 5.80% | 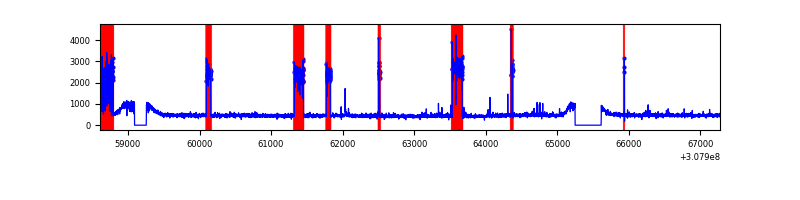 |
| B | 8669 | 8141 | 13 | 13 | 0.15% | 0.16% | 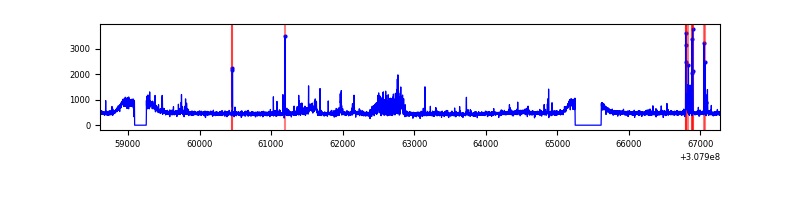 |
| C | 8669 | 8141 | 0 | 0 | 0.00% | 0.00% | 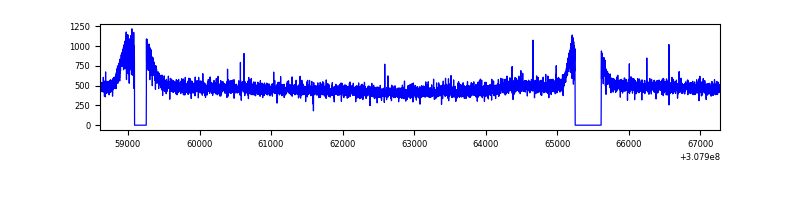 |
| D | 8669 | 8141 | 56 | 56 | 0.65% | 0.69% | 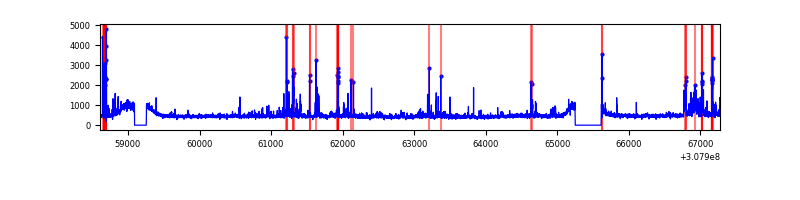 |
Top three noisy pixels from each quadrant. If the there are fewer than three noisy pixels in the level2.evt file, extra rows are filled as -1
| Pixel properties | Quadrant properties | ||||||
|---|---|---|---|---|---|---|---|
| Quadrant | DetID | PixID | Counts | Sigma | Mean | Median | Sigma |
| A | 15 | 236 | 1215349 | 6071.13 | 983 | 959 | 200.0 |
| A | 5 | 16 | 55431 | 272.32 | 983 | 959 | 200.0 |
| A | 13 | 254 | 11166 | 51.03 | 983 | 959 | 200.0 |
| B | 0 | 197 | 135085 | 680.81 | 1002 | 974 | 197.0 |
| B | 3 | 64 | 127426 | 641.93 | 1002 | 974 | 197.0 |
| B | 0 | 230 | 60992 | 304.68 | 1002 | 974 | 197.0 |
| C | 14 | 238 | 149042 | 637.34 | 980 | 985 | 232.3 |
| C | 13 | 61 | 6865 | 25.31 | 980 | 985 | 232.3 |
| C | 10 | 22 | 2973 | 8.56 | 980 | 985 | 232.3 |
| D | 12 | 235 | 240078 | 985.7 | 992 | 961 | 242.6 |
| D | 7 | 238 | 127595 | 522.02 | 992 | 961 | 242.6 |
| D | 14 | 35 | 116684 | 477.04 | 992 | 961 | 242.6 |
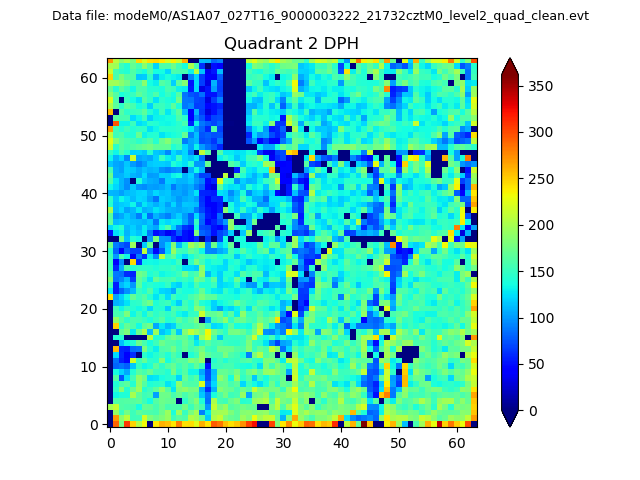
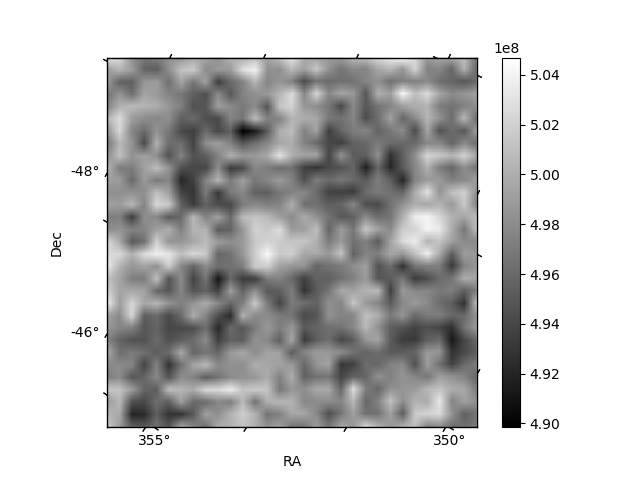
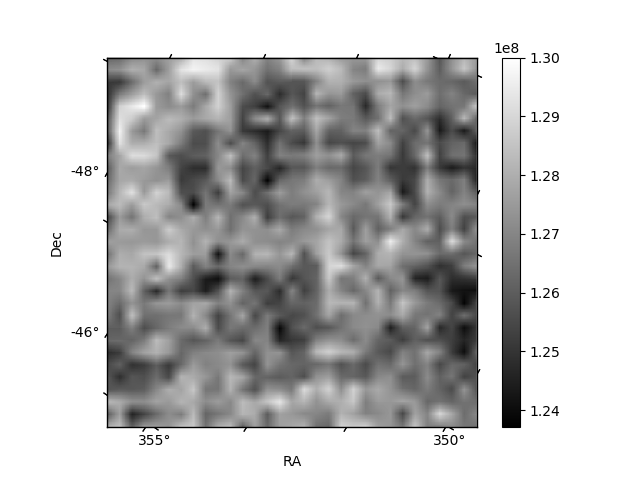
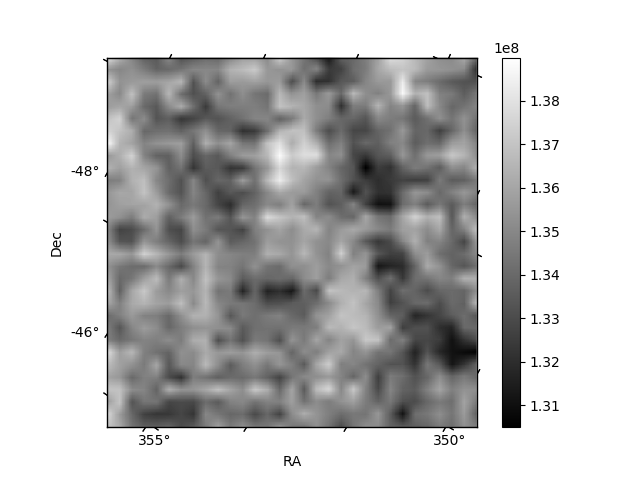
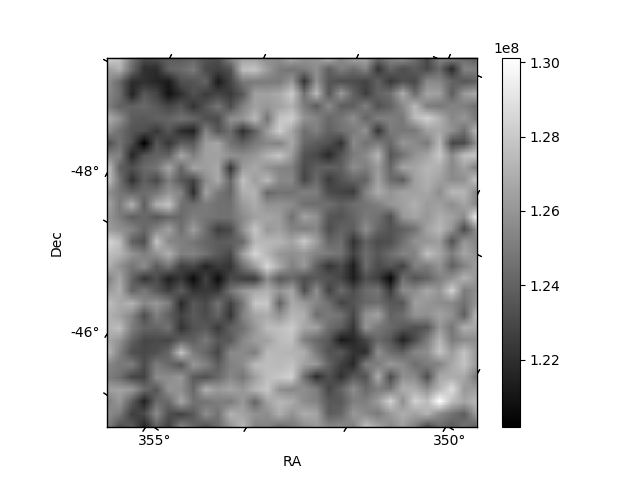
Histogram calculated using DETX and DETY for each event in the final _common_clean file
| Quadrant A | 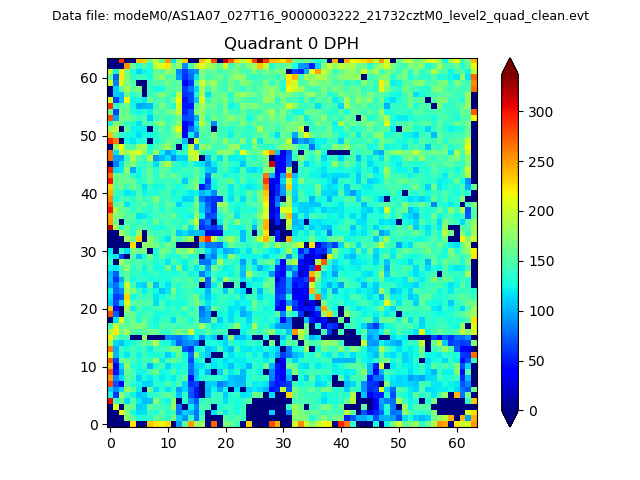 |
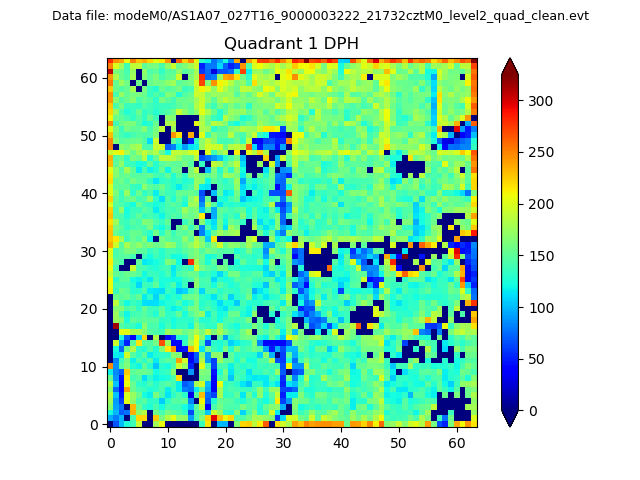 |
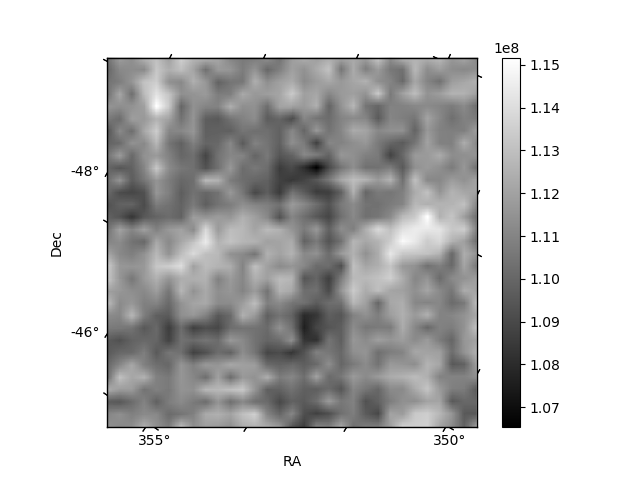
Quadrant B |
|---|---|---|---|
| Quadrant D | 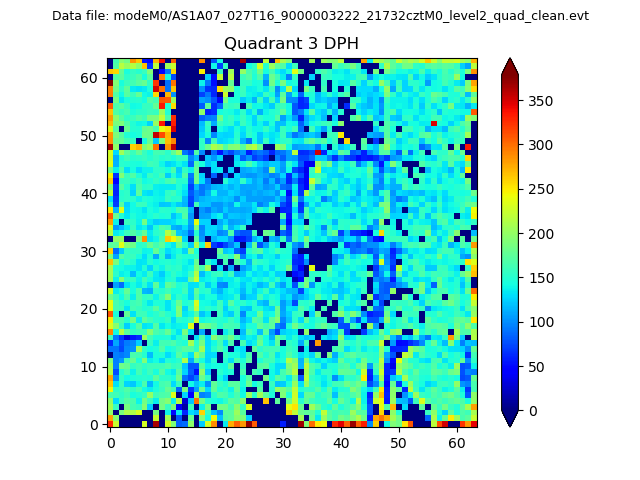 |
 |
Quadrant C |
| Plot type | Count rate plots | Images |
|---|---|---|
| Comparison with Poisson distribution Blue bars denote a histogram of data divided into 1 sec bins. Red curve is a Poisson curve with rate = median count rate of data. |
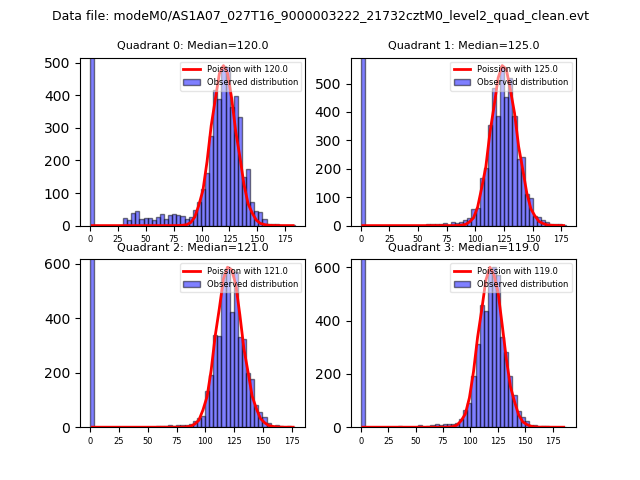 |
 |
| Quadrant-wise count rates Data is divided into 100 sec bins |
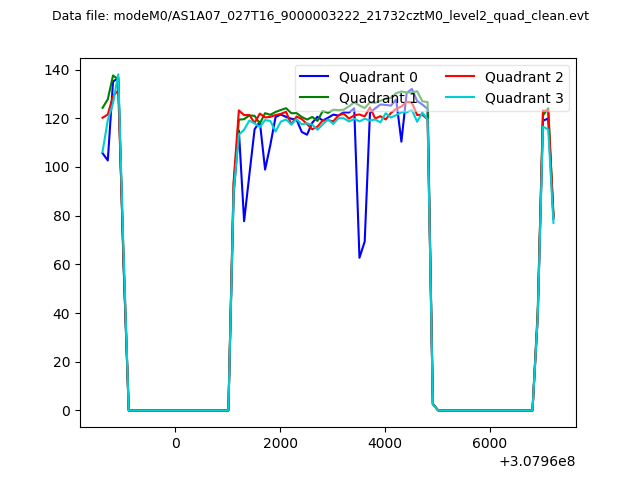 |
|
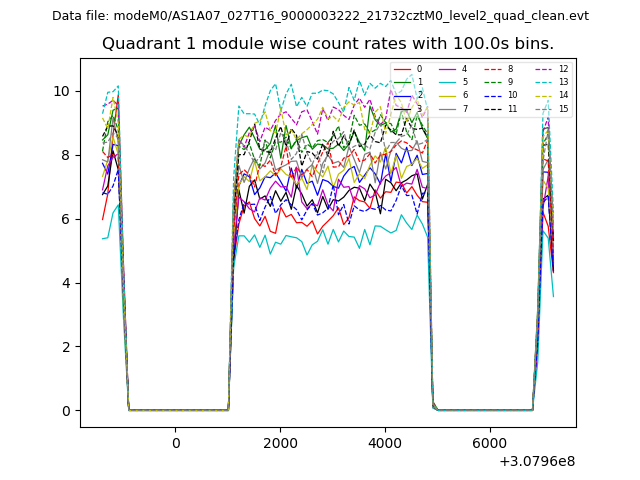
| Module-wise count rates for Quadrant A Data is divided into 100 sec bins |
 |
 |
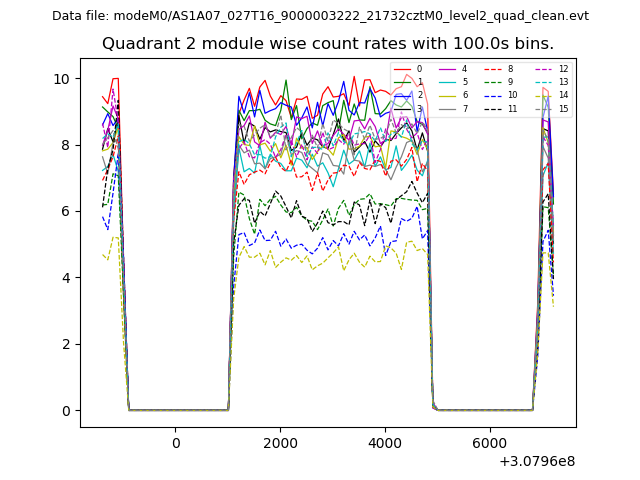
| Module-wise count rates for Quadrant B Data is divided into 100 sec bins |
 |
 |
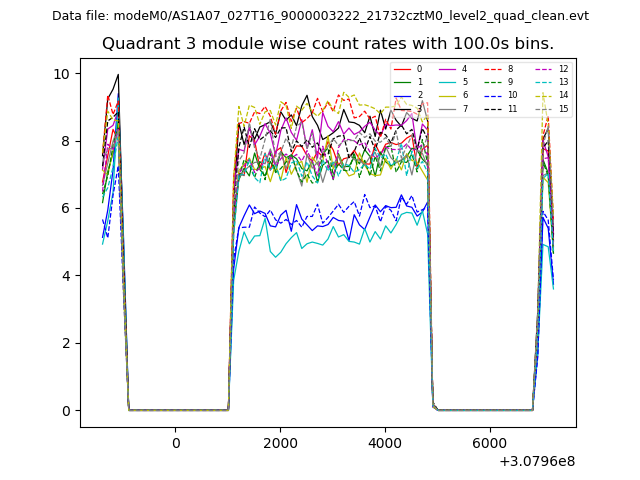
| Module-wise count rates for Quadrant C Data is divided into 100 sec bins |
 |
 |
| Module-wise count rates for Quadrant D Data is divided into 100 sec bins |
 |
 |
| Parameter | Plot |
|---|---|
| CZT HV Monitor | 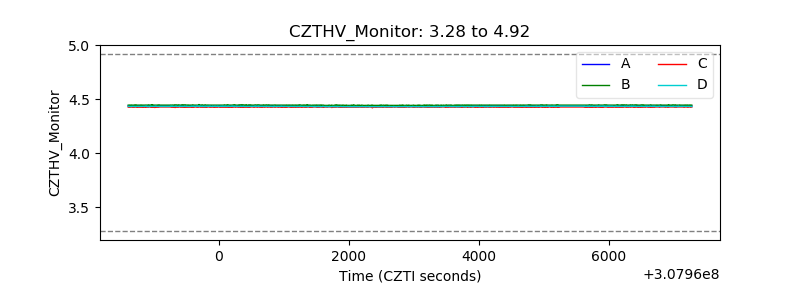 |
| D_VDD | 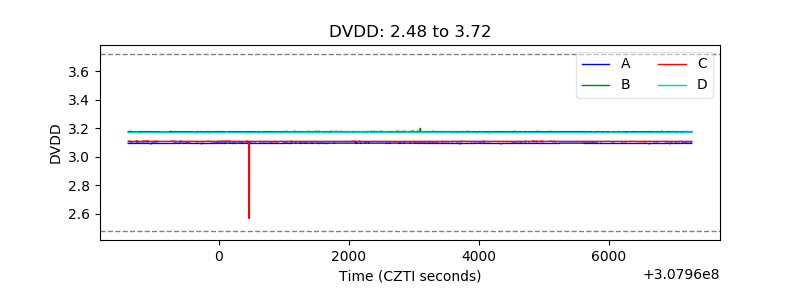 |
| Temperature 1 |  |
| Veto HV Monitor | 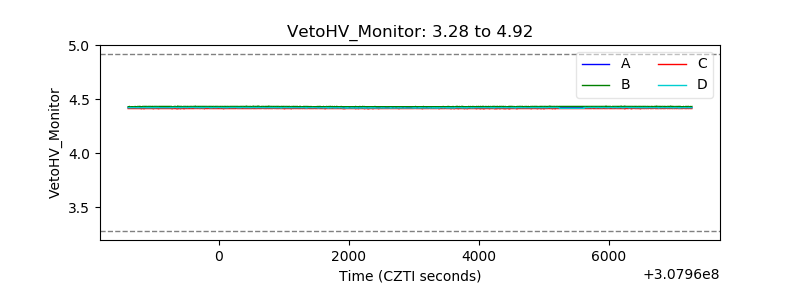 |
| Veto LLD | 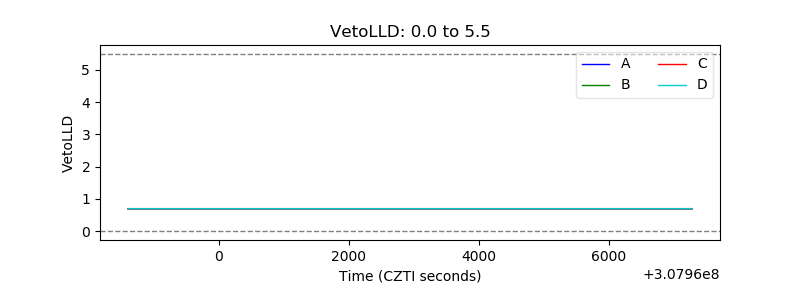 |
| Alpha Counter | 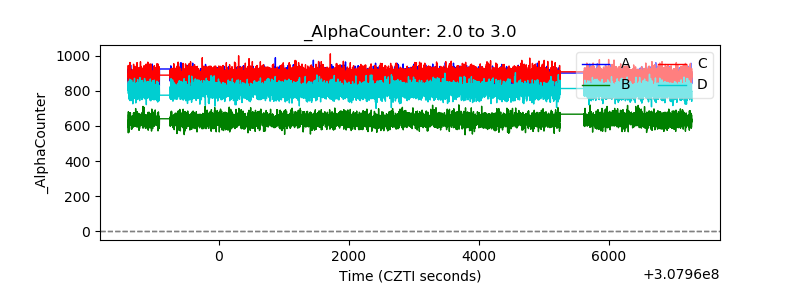 |
| _CPM_Rate | 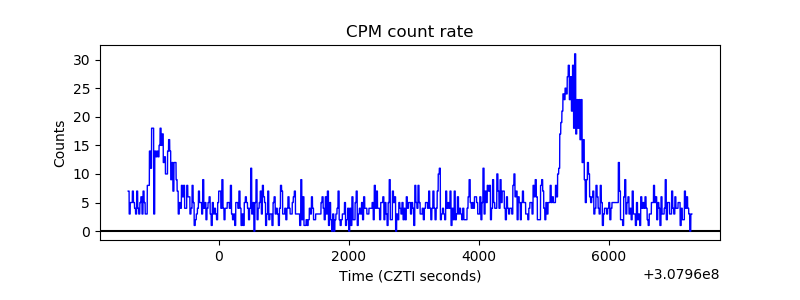 |
| CZT Counter | 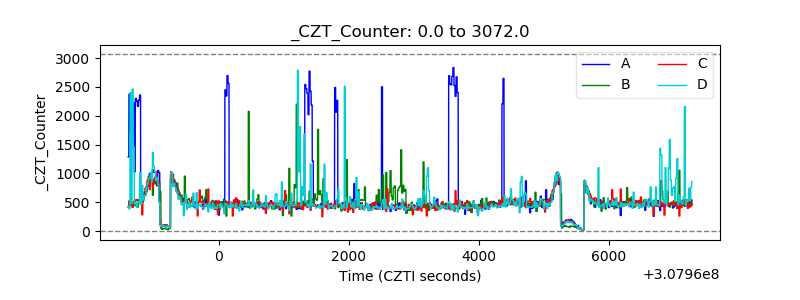 |
| +2.5 Volts monitor |  |
| +5 Volts monitor |  |
| _ROLL_ROT |  |
| _Roll_DEC | 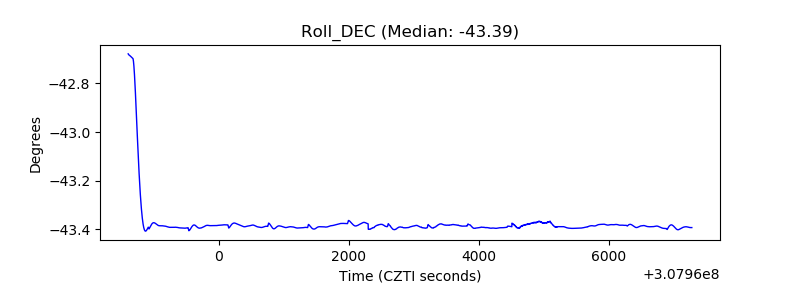 |
| _Roll_RA | 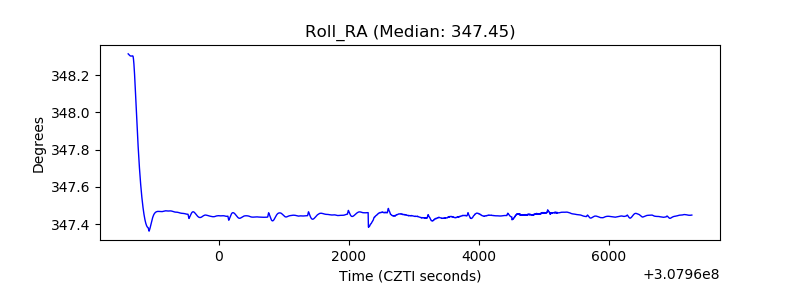 |
| Veto Counter | 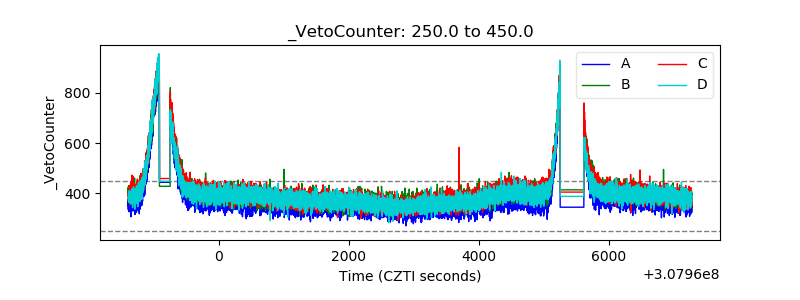 |