| Param | Original file | Final file |
|---|---|---|
| Filename | modeM0/AS1A07_027T16_9000003222_21734cztM0_level2.evt | modeM0/AS1A07_027T16_9000003222_21734cztM0_level2_quad_clean.evt |
| Size (bytes) | 375,998,400 | 62,524,800 |
| Size | 358.6 MB | 59.6 MB |
| Events in quadrant A | 2,321,784 | 393,107 |
| Events in quadrant B | 2,451,768 | 400,062 |
| Events in quadrant C | 2,297,720 | 389,441 |
| Events in quadrant D | 3,976,387 | 360,641 |
| Mode M9 | |||
|---|---|---|---|
| Quadrant | BADHDUFLAG | Total packets | Discarded packets |
| A | 0 | 4 | 0 |
| B | 0 | 4 | 0 |
| C | 0 | 4 | 0 |
| D | 0 | 4 | 0 |
| Mode SS | |||
|---|---|---|---|
| Quadrant | BADHDUFLAG | Total packets | Discarded packets |
| A | 0 | 100 | 0 |
| B | 0 | 100 | 0 |
| C | 0 | 100 | 0 |
| D | 0 | 100 | 0 |
| Mode M0 | |||
|---|---|---|---|
| Quadrant | BADHDUFLAG | Total packets | Discarded packets |
| A | 0 | 10354 | 1 |
| B | 0 | 10621 | 1 |
| C | 0 | 10269 | 1 |
| D | 0 | 15130 | 1 |
| Quadrant | Total seconds | Saturated seconds | Saturation percentage |
|---|---|---|---|
| A | 4990 | 111 | 2.224449% |
| B | 4990 | 129 | 2.585170% |
| C | 4990 | 115 | 2.304609% |
| D | 4991 | 422 | 8.455219% |
Noise dominated data is calculated using 1-second bins in cleaned event files. If a bin has >2000 counts, and if more than 50% of those come from <1% of pixels, then it is considered to be noise-dominated and hence unusable.
| Quadrant | # 1 sec bins | Bins with >0 counts | Bins with >2000 counts | High rate bins dominated by noise | Noise dominated (total time) | Noise dominated (detector-on time) | Marked lightcurve |
|---|---|---|---|---|---|---|---|
| A | 5355 | 4991 | 9 | 9 | 0.17% | 0.18% | 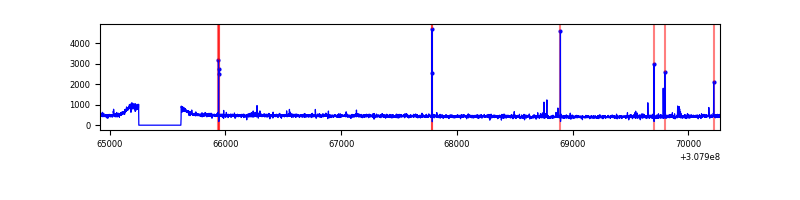 |
| B | 5355 | 4991 | 11 | 11 | 0.21% | 0.22% | 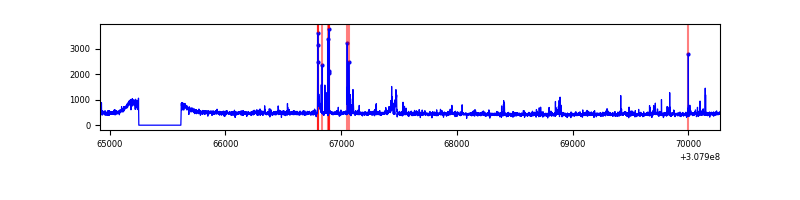 |
| C | 5355 | 4991 | 1 | 1 | 0.02% | 0.02% | 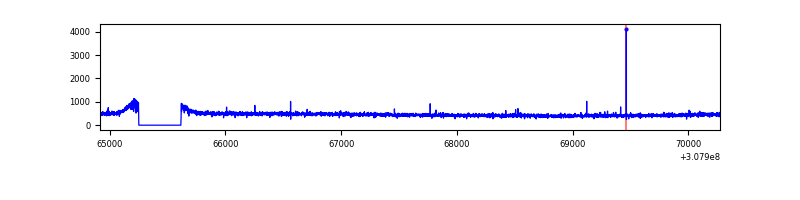 |
| D | 5356 | 4992 | 322 | 322 | 6.01% | 6.45% | 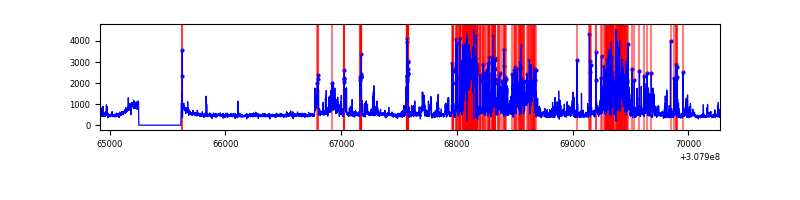 |
Top three noisy pixels from each quadrant. If the there are fewer than three noisy pixels in the level2.evt file, extra rows are filled as -1
| Pixel properties | Quadrant properties | ||||||
|---|---|---|---|---|---|---|---|
| Quadrant | DetID | PixID | Counts | Sigma | Mean | Median | Sigma |
| A | 5 | 16 | 33282 | 271.6 | 586 | 571 | 120.4 |
| A | 15 | 236 | 29243 | 238.07 | 586 | 571 | 120.4 |
| A | 13 | 254 | 7156 | 54.68 | 586 | 571 | 120.4 |
| B | 3 | 64 | 96888 | 843.69 | 584 | 568 | 114.2 |
| B | 0 | 230 | 32403 | 278.85 | 584 | 568 | 114.2 |
| B | 0 | 197 | 15509 | 130.87 | 584 | 568 | 114.2 |
| C | 14 | 238 | 87525 | 642.57 | 566 | 568 | 135.3 |
| C | 10 | 23 | 5701 | 37.93 | 566 | 568 | 135.3 |
| C | 13 | 61 | 3851 | 24.26 | 566 | 568 | 135.3 |
| D | 7 | 238 | 1470280 | 10715.19 | 557 | 539 | 137.2 |
| D | 12 | 235 | 182817 | 1328.9 | 557 | 539 | 137.2 |
| D | 14 | 35 | 105399 | 764.49 | 557 | 539 | 137.2 |
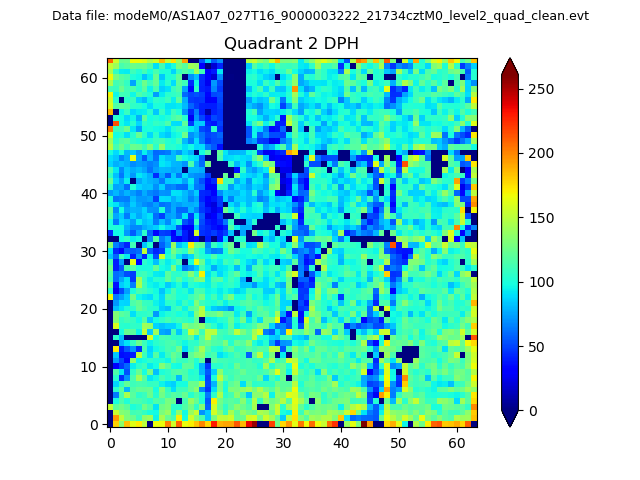
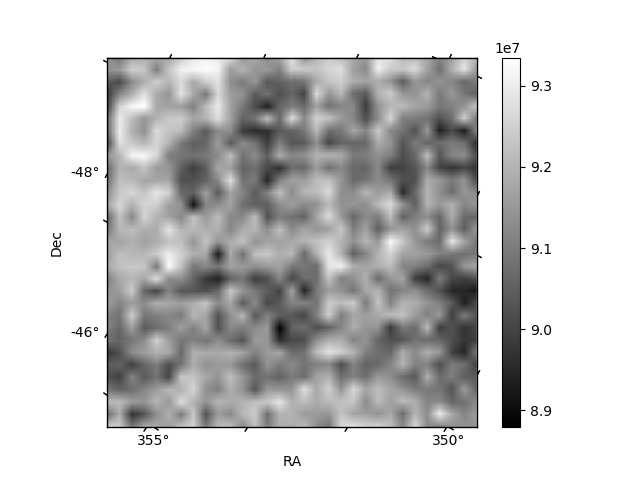
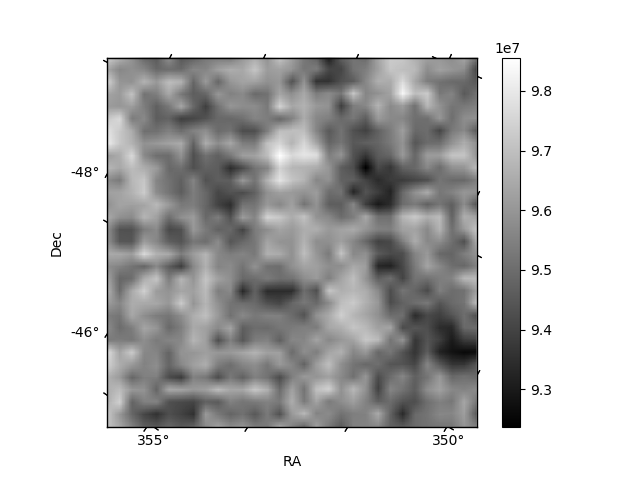
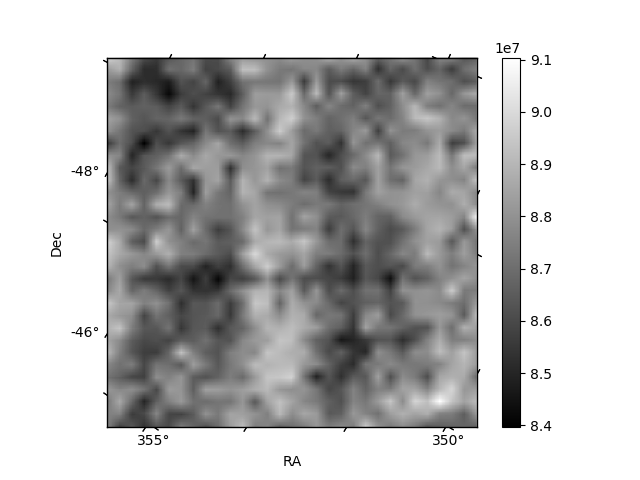
Histogram calculated using DETX and DETY for each event in the final _common_clean file
| Quadrant A |  |
 |
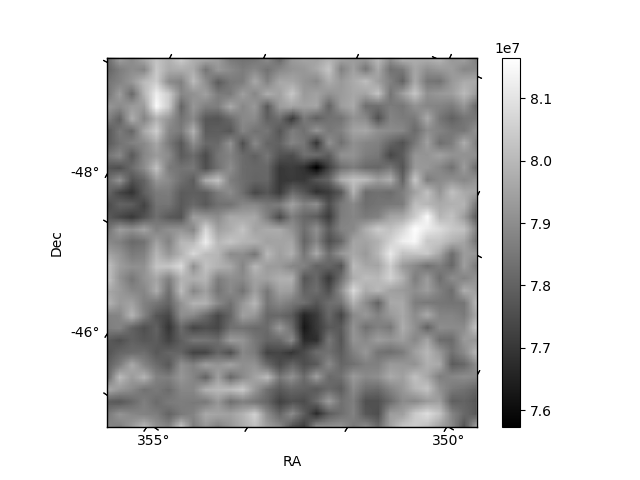
Quadrant B |
|---|---|---|---|
| Quadrant D | 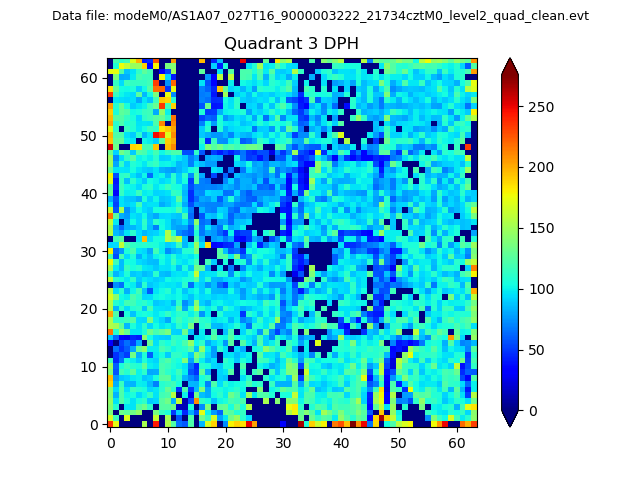 |
 |
Quadrant C |
| Plot type | Count rate plots | Images |
|---|---|---|
| Comparison with Poisson distribution Blue bars denote a histogram of data divided into 1 sec bins. Red curve is a Poisson curve with rate = median count rate of data. |
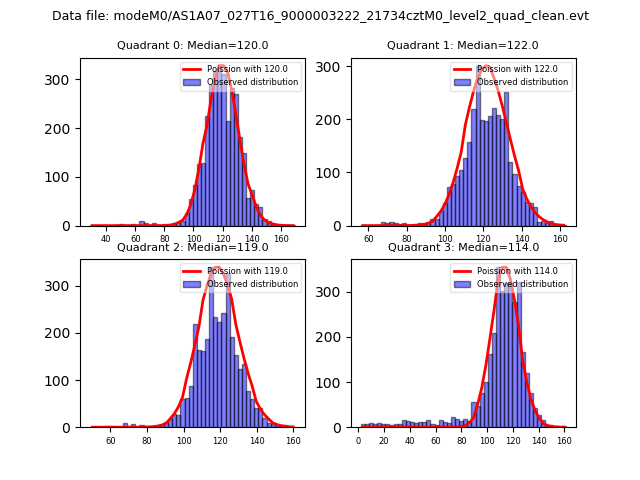 |
 |
| Quadrant-wise count rates Data is divided into 100 sec bins |
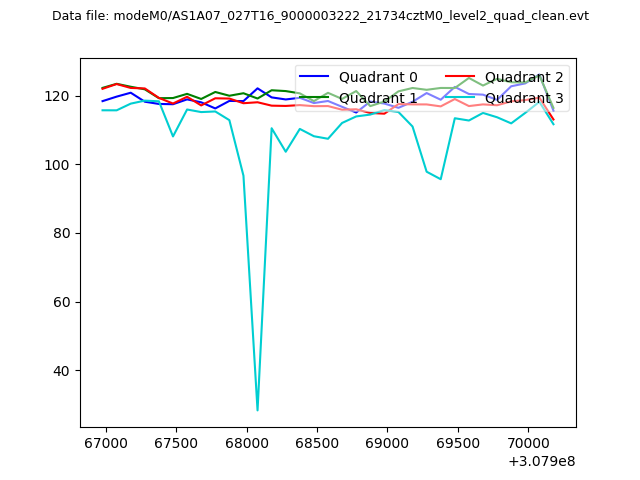 |
|
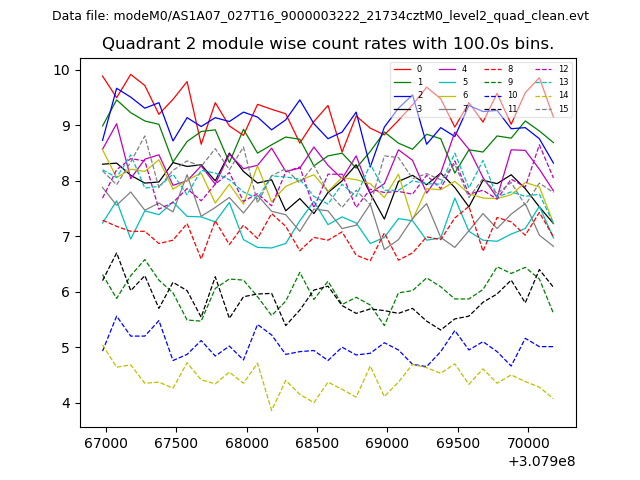
| Module-wise count rates for Quadrant A Data is divided into 100 sec bins |
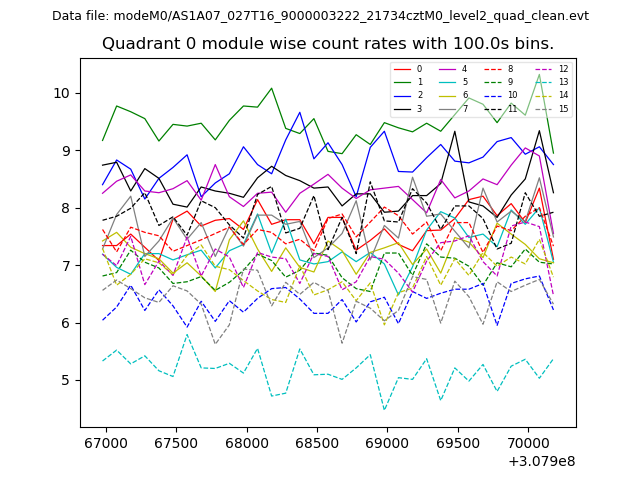 |
 |
| Module-wise count rates for Quadrant B Data is divided into 100 sec bins |
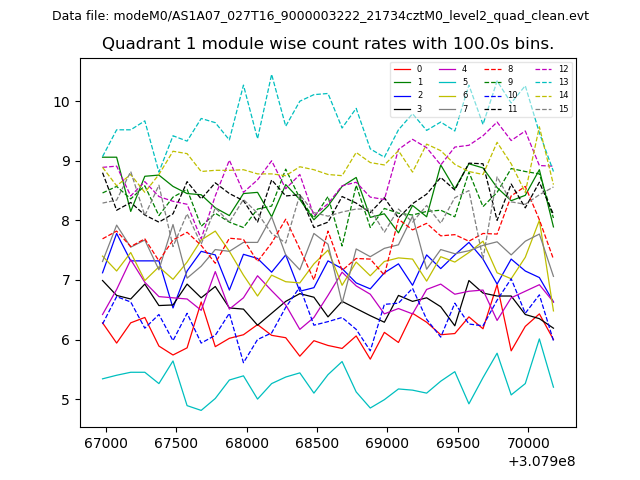 |
 |
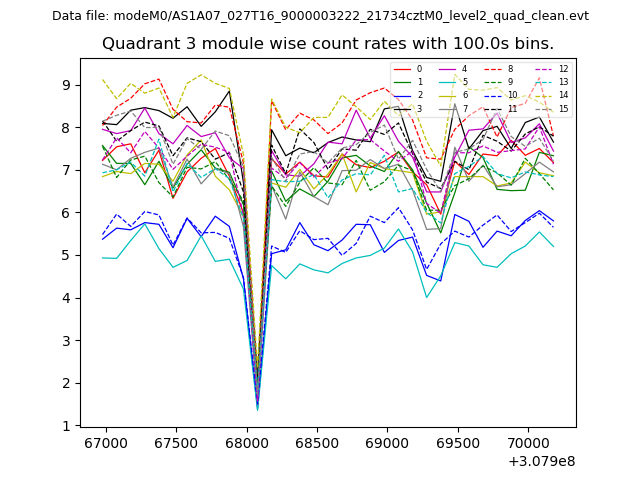
| Module-wise count rates for Quadrant C Data is divided into 100 sec bins |
 |
 |
| Module-wise count rates for Quadrant D Data is divided into 100 sec bins |
 |
 |
| Parameter | Plot |
|---|---|
| CZT HV Monitor | 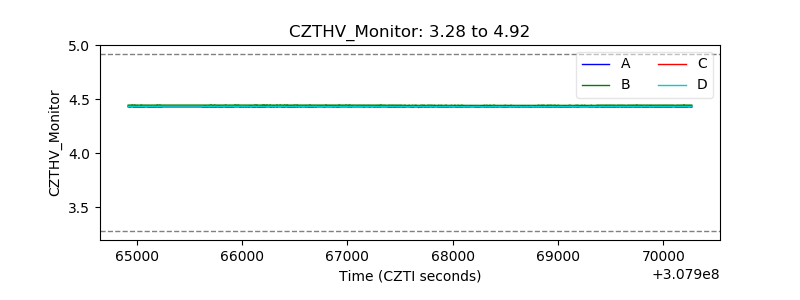 |
| D_VDD | 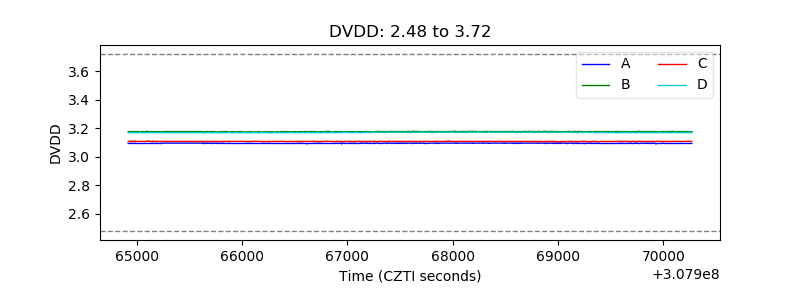 |
| Temperature 1 | 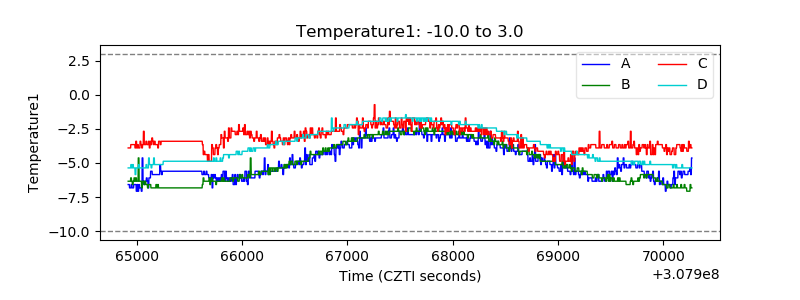 |
| Veto HV Monitor | 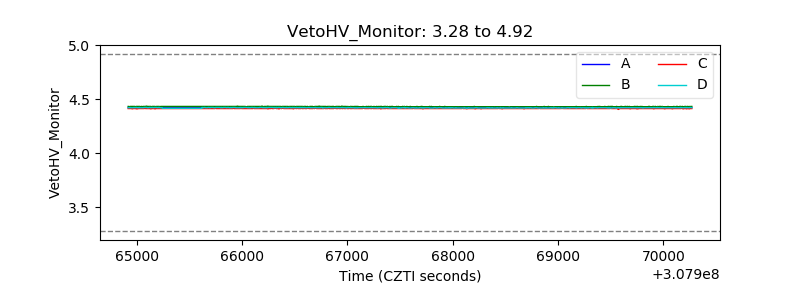 |
| Veto LLD | 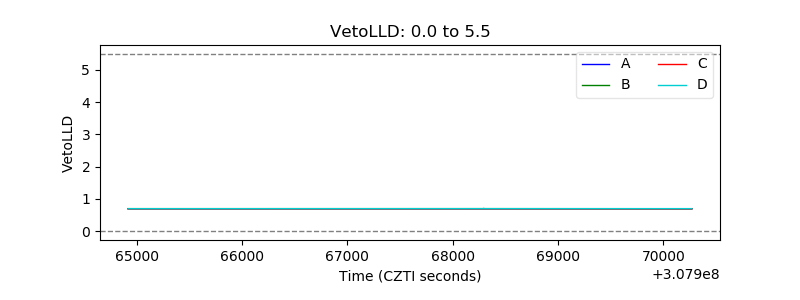 |
| Alpha Counter | 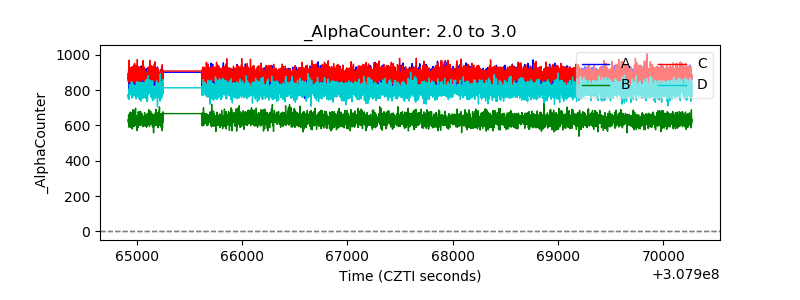 |
| _CPM_Rate | 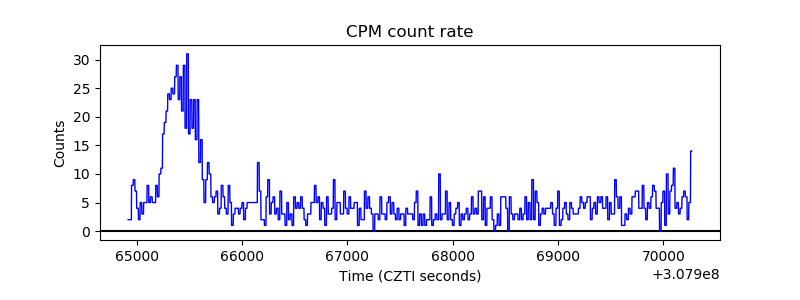 |
| CZT Counter | 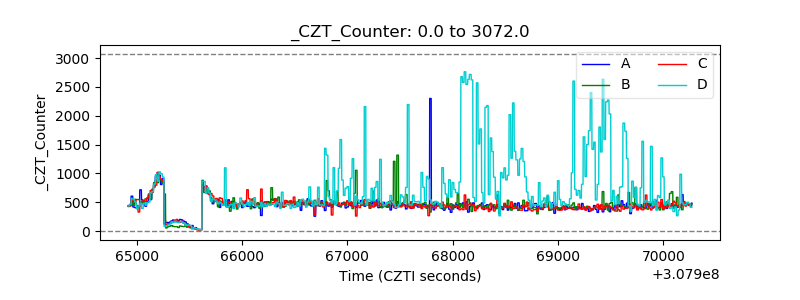 |
| +2.5 Volts monitor |  |
| +5 Volts monitor | 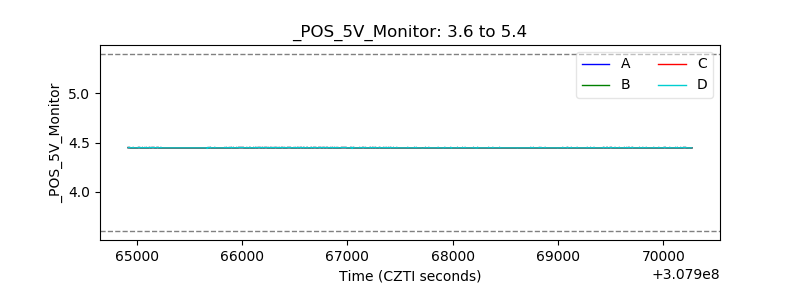 |
| _ROLL_ROT | 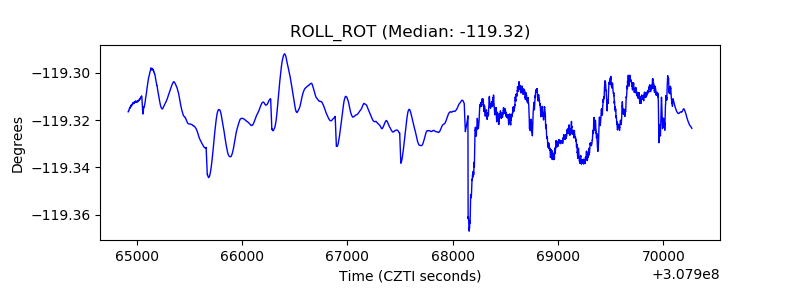 |
| _Roll_DEC | 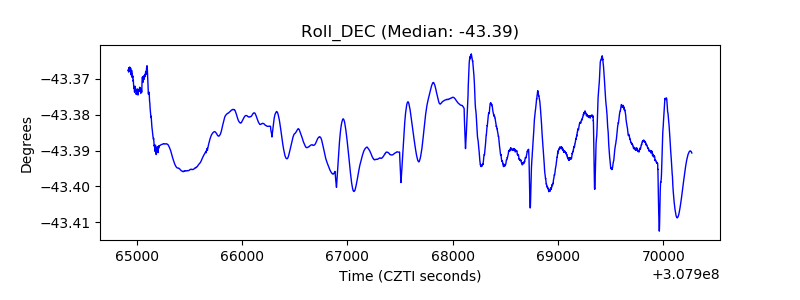 |
| _Roll_RA | 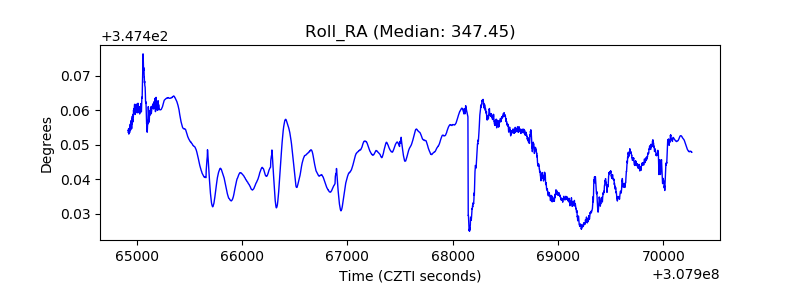 |
| Veto Counter | 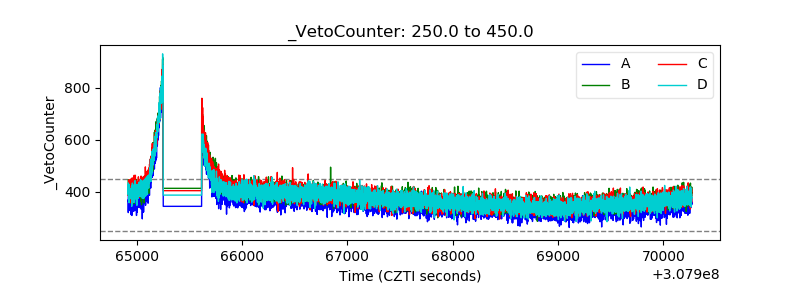 |