| Param | Original file | Final file |
|---|---|---|
| Filename | modeM0/AS1A07_006T01_9000003226cztM0_level2.fits | modeM0/AS1A07_006T01_9000003226cztM0_level2_quad_clean.evt |
| Size (bytes) | 547,585,920 | 471,879,360 |
| Size | 522.2 MB | 450.0 MB |
| Events in quadrant A | 3,432,694 | 2,925,451 |
| Events in quadrant B | 3,313,164 | 2,945,515 |
| Events in quadrant C | 3,394,624 | 2,855,223 |
| Events in quadrant D | 2,480,624 | 1,610,479 |
| Mode SS | |||
|---|---|---|---|
| Quadrant | BADHDUFLAG | Total packets | Discarded packets |
| A | 0 | 1172 | 0 |
| B | 0 | 1174 | 0 |
| C | 0 | 1174 | 0 |
| D | 0 | 1174 | 0 |
| Mode M0 | |||
|---|---|---|---|
| Quadrant | BADHDUFLAG | Total packets | Discarded packets |
| A | 0 | 121425 | 0 |
| B | 0 | 123973 | 0 |
| C | 0 | 118677 | 0 |
| D | 0 | 289161 | 0 |
| Mode M9 | |||
|---|---|---|---|
| Quadrant | BADHDUFLAG | Total packets | Discarded packets |
| A | 0 | 87 | 0 |
| B | 0 | 87 | 0 |
| C | 0 | 87 | 0 |
| D | 0 | 87 | 0 |
| Quadrant | Total seconds | Saturated seconds | Saturation percentage |
|---|---|---|---|
| A | 57615 | 705 | 1.223640% |
| B | 57621 | 986 | 1.711182% |
| C | 57612 | 979 | 1.699299% |
| D | 57610 | 22309 | 38.724180% |
Noise dominated data is calculated using 1-second bins in cleaned event files. If a bin has >2000 counts, and if more than 50% of those come from <1% of pixels, then it is considered to be noise-dominated and hence unusable.
| Quadrant | # 1 sec bins | Bins with >0 counts | Bins with >2000 counts | High rate bins dominated by noise | Noise dominated (total time) | Noise dominated (detector-on time) | Marked lightcurve |
|---|---|---|---|---|---|---|---|
| A | 66364 | 57620 | 0 | 0 | 0.00% | 0.00% | 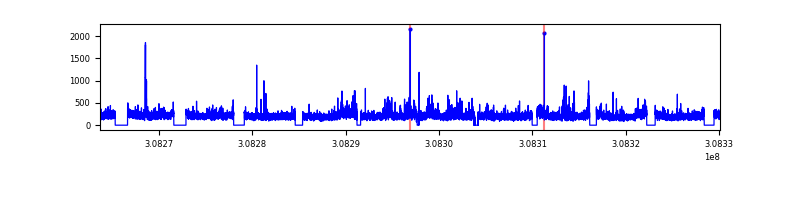 |
| B | 66364 | 57629 | 0 | 0 | 0.00% | 0.00% |  |
| C | 66364 | 57620 | 0 | 0 | 0.00% | 0.00% |  |
| D | 66364 | 57589 | 0 | 0 | 0.00% | 0.00% |  |
Top three noisy pixels from each quadrant. If the there are fewer than three noisy pixels in the level2.evt file, extra rows are filled as -1
| Pixel properties | Quadrant properties | ||||||
|---|---|---|---|---|---|---|---|
| Quadrant | DetID | PixID | Counts | Sigma | Mean | Median | Sigma |
| A | 0 | 29 | 3212 | 10.68 | 895 | 841 | 222.0 |
| A | 7 | 110 | 2735 | 8.53 | 895 | 841 | 222.0 |
| A | 0 | 30 | 2584 | 7.85 | 895 | 841 | 222.0 |
| B | 2 | 9 | 2706 | 10.62 | 877 | 834 | 176.2 |
| B | 2 | 8 | 2237 | 7.96 | 877 | 834 | 176.2 |
| B | 5 | 232 | 2222 | 7.88 | 877 | 834 | 176.2 |
| C | 1 | 81 | 2626 | 7.81 | 894 | 835 | 229.3 |
| C | 1 | 80 | 2563 | 7.54 | 894 | 835 | 229.3 |
| C | 3 | 234 | 2401 | 6.83 | 894 | 835 | 229.3 |
| D | 6 | 231 | 1767 | 5.91 | 708 | 645 | 189.8 |
| D | 15 | 46 | 1737 | 5.75 | 708 | 645 | 189.8 |
| D | 6 | 67 | 1734 | 5.73 | 708 | 645 | 189.8 |
Histogram calculated using DETX and DETY for each event in the final _common_clean file
| Quadrant A | 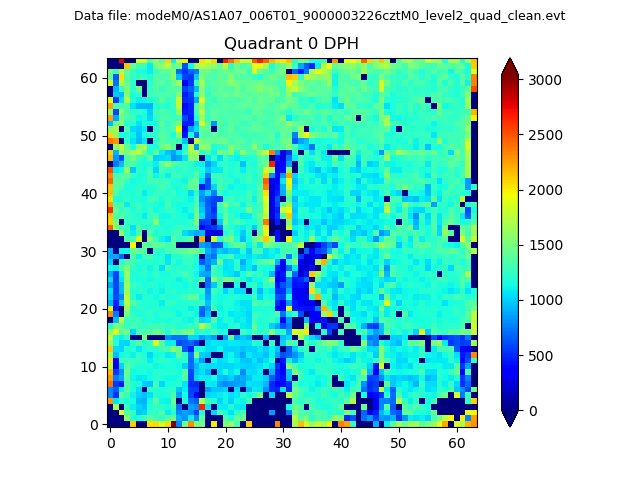 |
 |
Quadrant B |
|---|---|---|---|
| Quadrant D |  |
 |
Quadrant C |
| Plot type | Count rate plots | Images |
|---|---|---|
| Comparison with Poisson distribution Blue bars denote a histogram of data divided into 1 sec bins. Red curve is a Poisson curve with rate = median count rate of data. |
 |
 |
| Quadrant-wise count rates Data is divided into 100 sec bins |
 |
|
| Module-wise count rates for Quadrant A Data is divided into 100 sec bins |
 |
 |
| Module-wise count rates for Quadrant B Data is divided into 100 sec bins |
 |
 |
| Module-wise count rates for Quadrant C Data is divided into 100 sec bins |
 |
 |
| Module-wise count rates for Quadrant D Data is divided into 100 sec bins |
 |
 |
| Parameter | Plot |
|---|---|
| CZT HV Monitor |  |
| D_VDD | 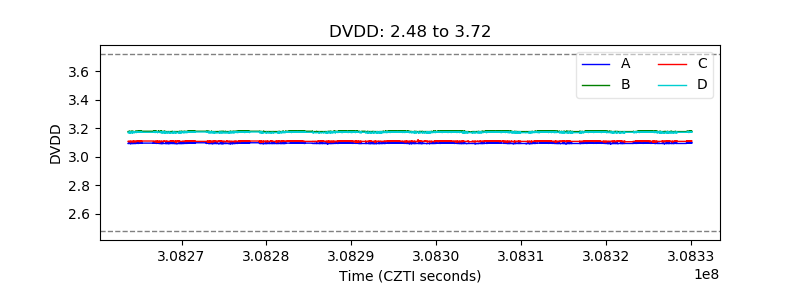 |
| Temperature 1 |  |
| Veto HV Monitor |  |
| Veto LLD |  |
| Alpha Counter |  |
| _CPM_Rate | 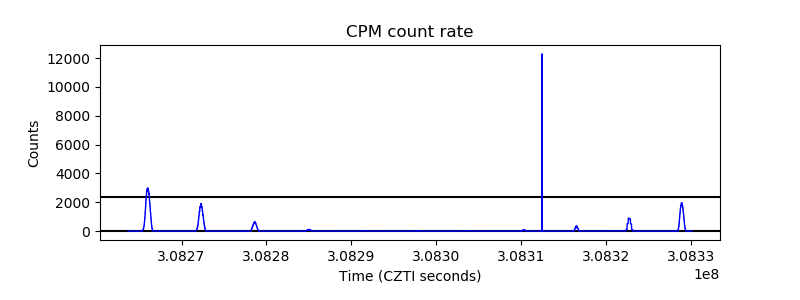 |
| CZT Counter |  |
| +2.5 Volts monitor |  |
| +5 Volts monitor |  |
| _ROLL_ROT |  |
| _Roll_DEC |  |
| _Roll_RA |  |
| Veto Counter |  |