| Param | Original file | Final file |
|---|---|---|
| Filename | modeM0/AS1A07_006T01_9000003226_21784cztM0_level2.evt | modeM0/AS1A07_006T01_9000003226_21784cztM0_level2_quad_clean.evt |
| Size (bytes) | 335,759,040 | 52,531,200 |
| Size | 320.2 MB | 50.1 MB |
| Events in quadrant A | 1,580,684 | 365,801 |
| Events in quadrant B | 1,655,059 | 379,965 |
| Events in quadrant C | 1,579,041 | 362,439 |
| Events in quadrant D | 5,156,341 | 276,022 |
| Mode SS | |||
|---|---|---|---|
| Quadrant | BADHDUFLAG | Total packets | Discarded packets |
| A | 0 | 60 | 0 |
| B | 0 | 60 | 0 |
| C | 0 | 60 | 0 |
| D | 0 | 60 | 0 |
| Mode M0 | |||
|---|---|---|---|
| Quadrant | BADHDUFLAG | Total packets | Discarded packets |
| A | 0 | 6318 | 1 |
| B | 0 | 6591 | 1 |
| C | 0 | 6258 | 2 |
| D | 0 | 17238 | 1 |
| Mode M9 | |||
|---|---|---|---|
| Quadrant | BADHDUFLAG | Total packets | Discarded packets |
| A | 0 | 13 | 0 |
| B | 0 | 13 | 0 |
| C | 0 | 13 | 0 |
| D | 0 | 13 | 0 |
| Quadrant | Total seconds | Saturated seconds | Saturation percentage |
|---|---|---|---|
| A | 2882 | 16 | 0.555170% |
| B | 2882 | 40 | 1.387925% |
| C | 2881 | 49 | 1.700798% |
| D | 2881 | 1653 | 57.375911% |
Noise dominated data is calculated using 1-second bins in cleaned event files. If a bin has >2000 counts, and if more than 50% of those come from <1% of pixels, then it is considered to be noise-dominated and hence unusable.
| Quadrant | # 1 sec bins | Bins with >0 counts | Bins with >2000 counts | High rate bins dominated by noise | Noise dominated (total time) | Noise dominated (detector-on time) | Marked lightcurve |
|---|---|---|---|---|---|---|---|
| A | 4212 | 2883 | 0 | 0 | 0.00% | 0.00% | 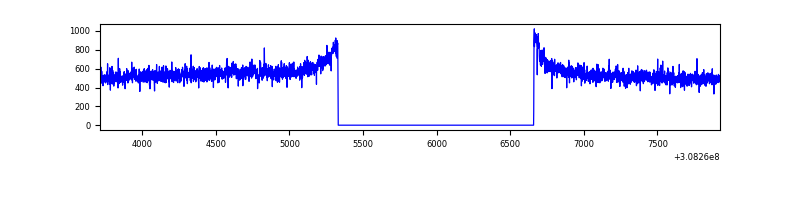 |
| B | 4212 | 2883 | 0 | 0 | 0.00% | 0.00% | 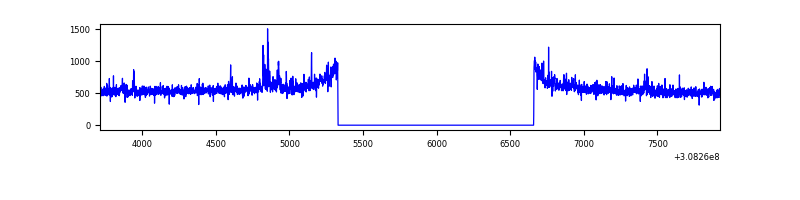 |
| C | 4211 | 2882 | 0 | 0 | 0.00% | 0.00% | 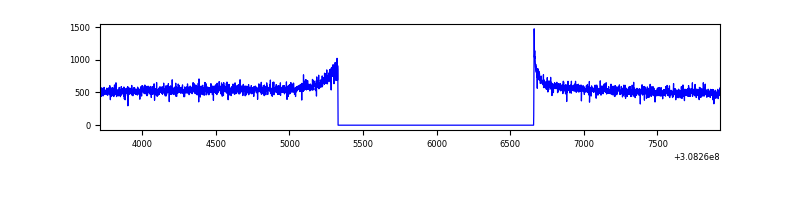 |
| D | 4211 | 2882 | 1492 | 1492 | 35.43% | 51.77% | 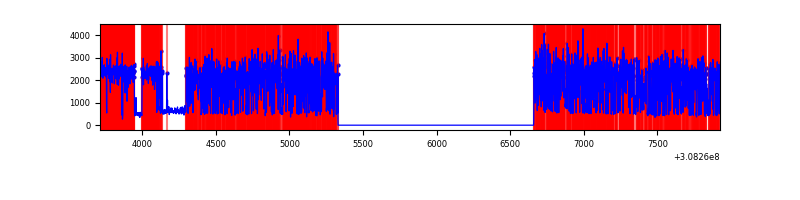 |
Top three noisy pixels from each quadrant. If the there are fewer than three noisy pixels in the level2.evt file, extra rows are filled as -1
| Pixel properties | Quadrant properties | ||||||
|---|---|---|---|---|---|---|---|
| Quadrant | DetID | PixID | Counts | Sigma | Mean | Median | Sigma |
| A | 15 | 236 | 11346 | 132.25 | 405 | 397 | 82.8 |
| A | 13 | 252 | 7864 | 90.19 | 405 | 397 | 82.8 |
| A | 13 | 254 | 5313 | 59.38 | 405 | 397 | 82.8 |
| B | 0 | 230 | 21959 | 277.88 | 407 | 397 | 77.6 |
| B | 0 | 197 | 11783 | 146.74 | 407 | 397 | 77.6 |
| B | 3 | 64 | 11270 | 140.13 | 407 | 397 | 77.6 |
| C | 14 | 238 | 61558 | 664.74 | 388 | 392 | 92.0 |
| C | 0 | 10 | 2999 | 28.33 | 388 | 392 | 92.0 |
| C | 13 | 61 | 2763 | 25.77 | 388 | 392 | 92.0 |
| D | 7 | 238 | 3679358 | 45538.32 | 329 | 320 | 80.8 |
| D | 1 | 52 | 52641 | 647.62 | 329 | 320 | 80.8 |
| D | 13 | 153 | 49986 | 614.75 | 329 | 320 | 80.8 |
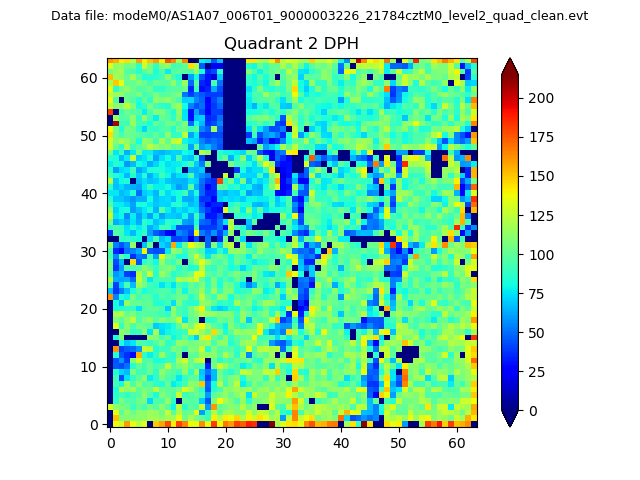
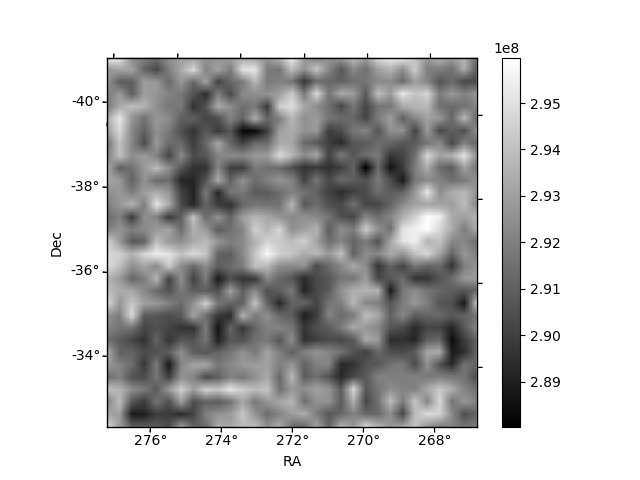
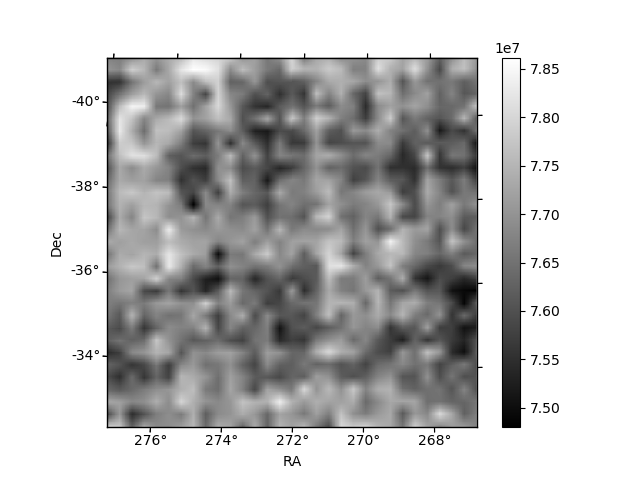
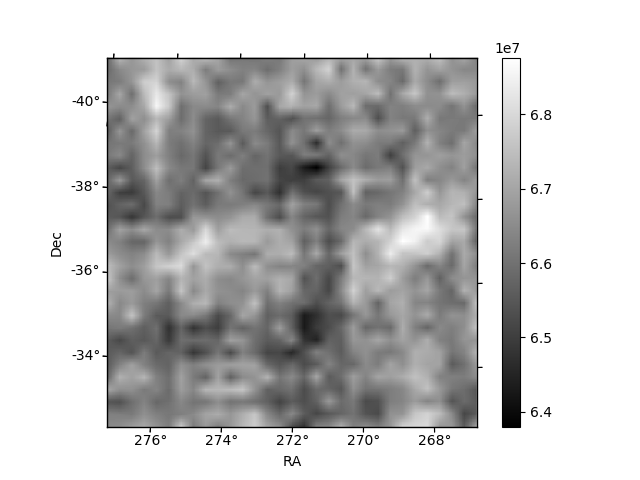
Histogram calculated using DETX and DETY for each event in the final _common_clean file
| Quadrant A | 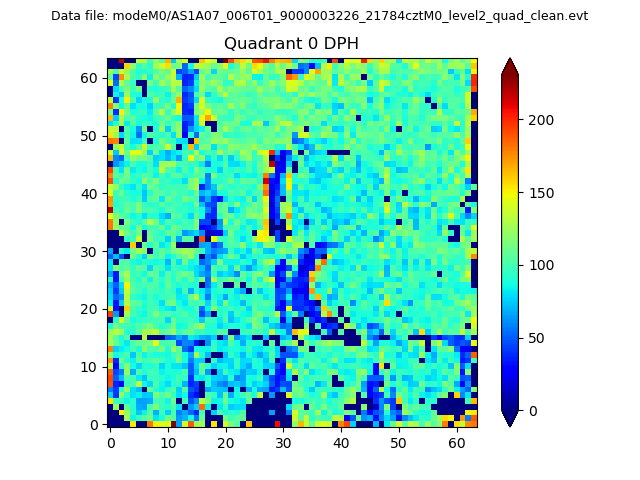 |
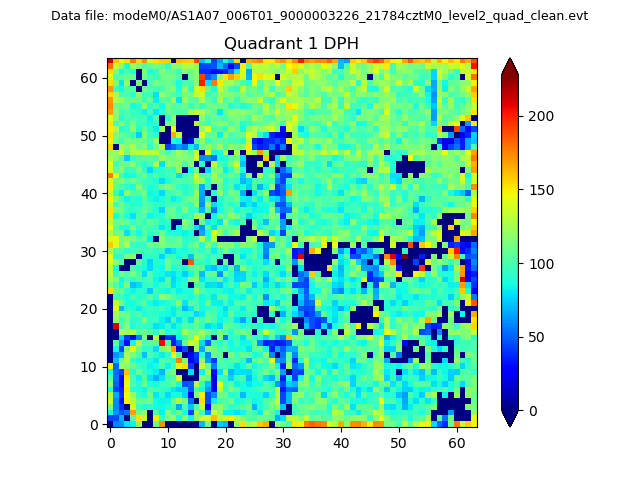 |
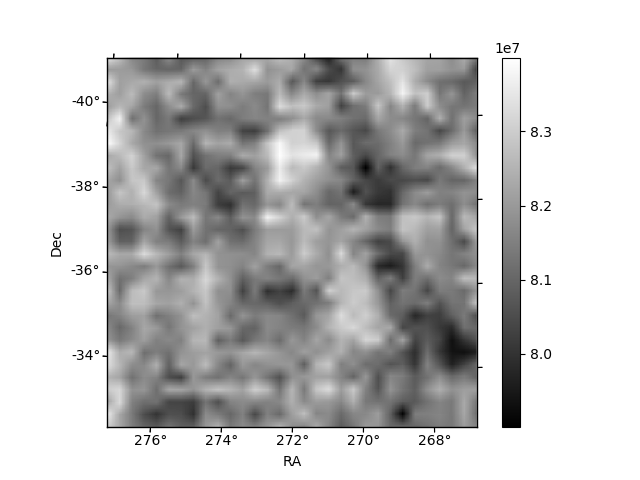
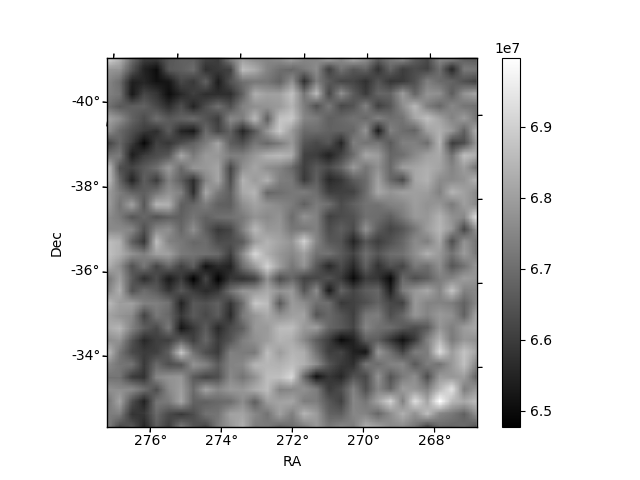
Quadrant B |
|---|---|---|---|
| Quadrant D | 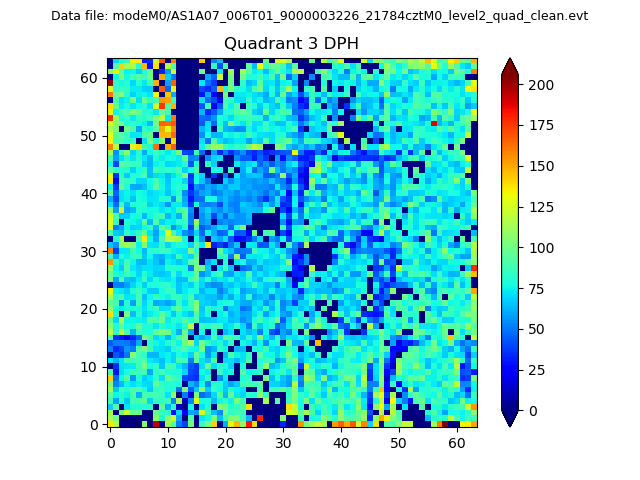 |
 |
Quadrant C |
| Plot type | Count rate plots | Images |
|---|---|---|
| Comparison with Poisson distribution Blue bars denote a histogram of data divided into 1 sec bins. Red curve is a Poisson curve with rate = median count rate of data. |
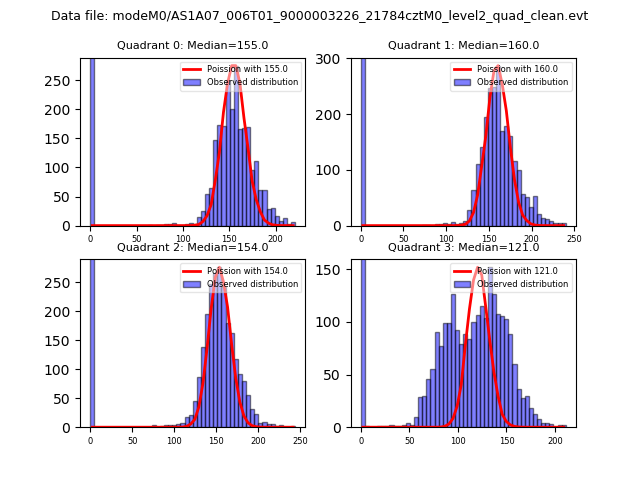 |
 |
| Quadrant-wise count rates Data is divided into 100 sec bins |
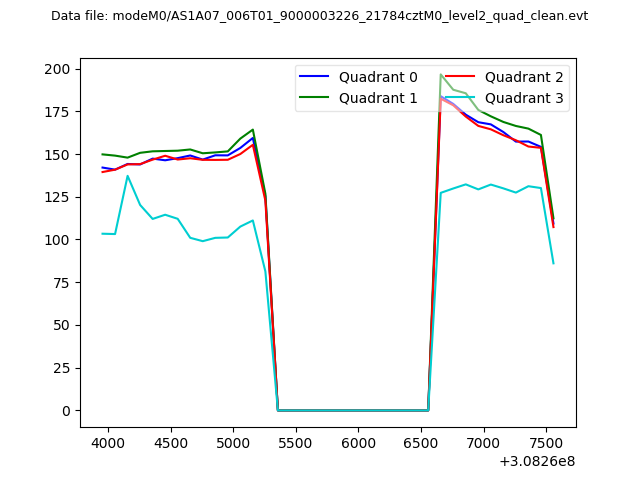 |
|
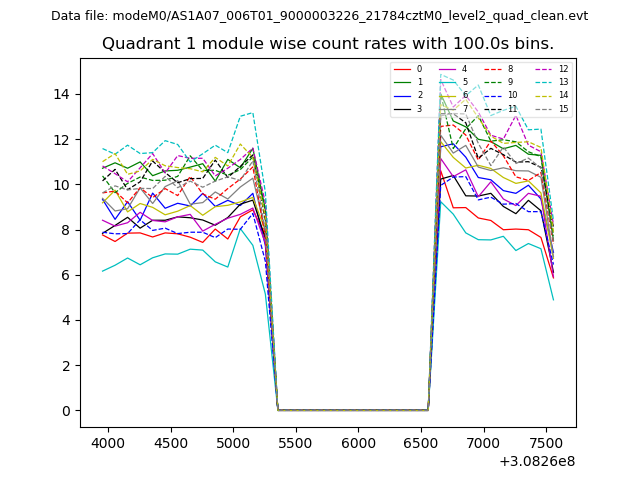
| Module-wise count rates for Quadrant A Data is divided into 100 sec bins |
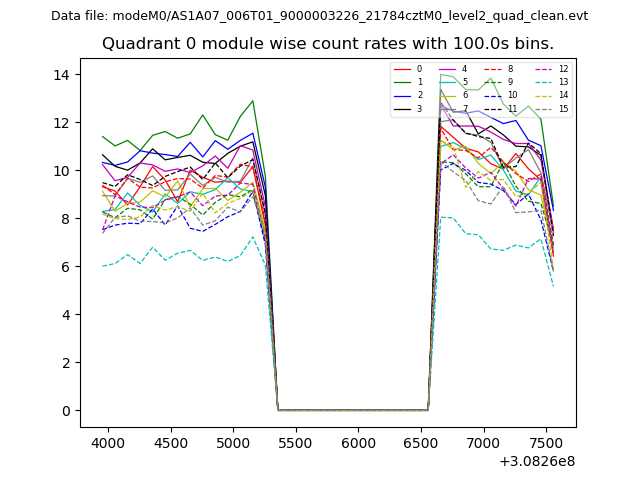 |
 |
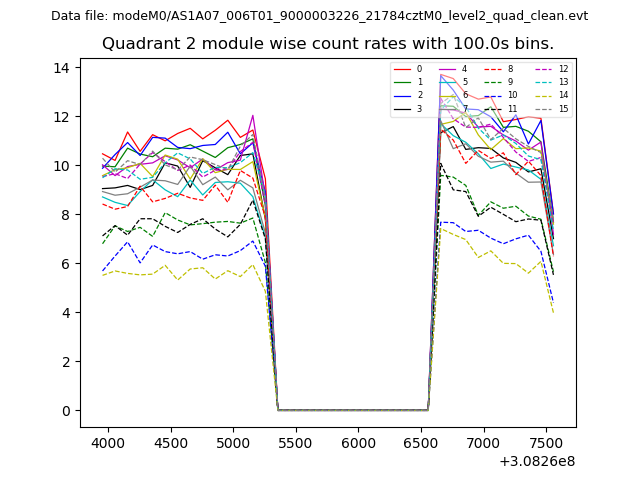
| Module-wise count rates for Quadrant B Data is divided into 100 sec bins |
 |
 |
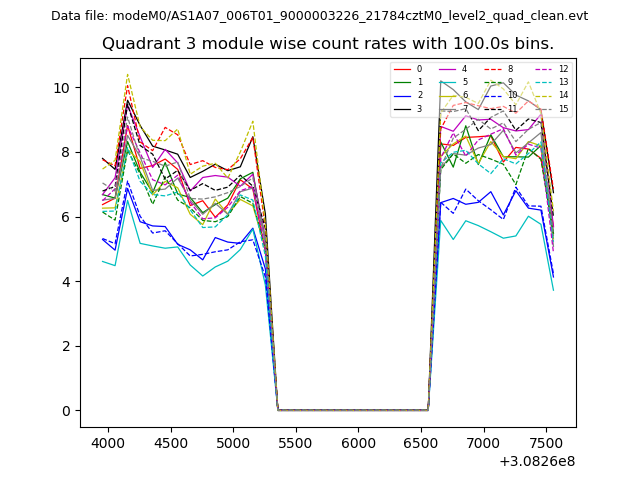
| Module-wise count rates for Quadrant C Data is divided into 100 sec bins |
 |
 |
| Module-wise count rates for Quadrant D Data is divided into 100 sec bins |
 |
 |
| Parameter | Plot |
|---|---|
| CZT HV Monitor | 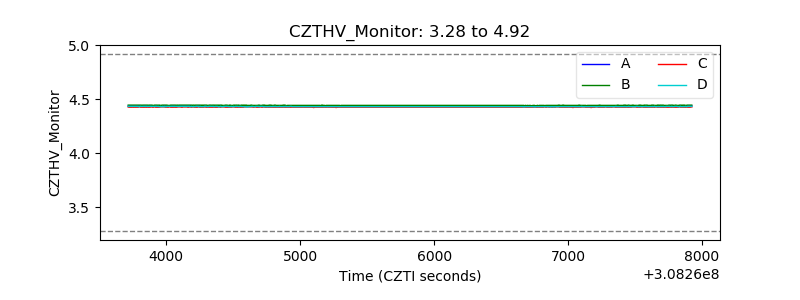 |
| D_VDD | 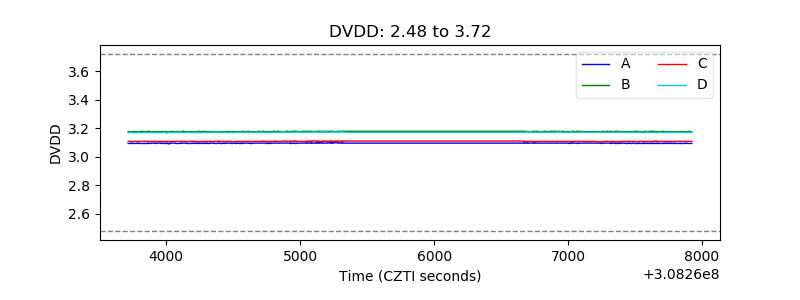 |
| Temperature 1 | 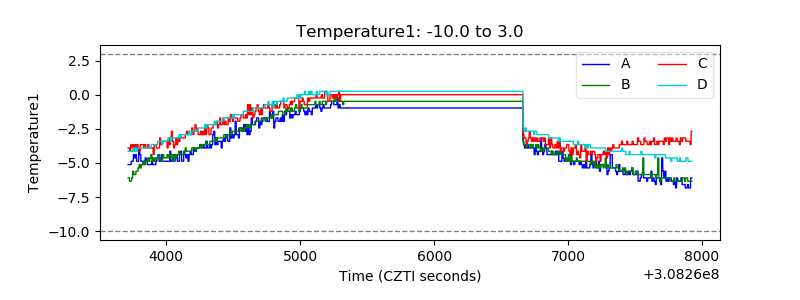 |
| Veto HV Monitor | 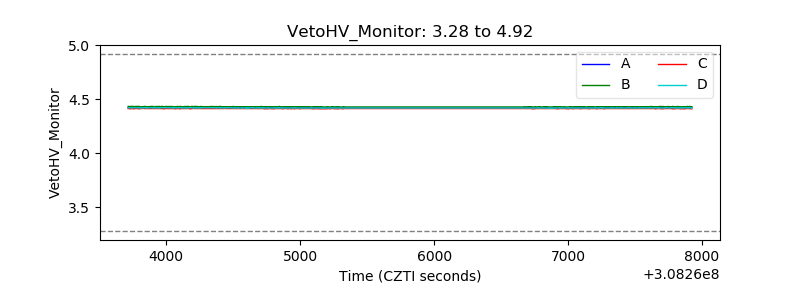 |
| Veto LLD | 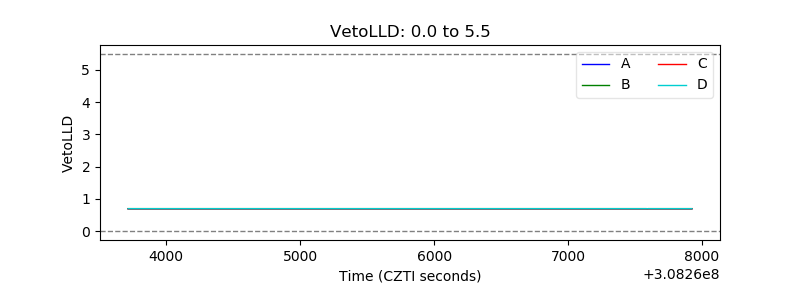 |
| Alpha Counter | 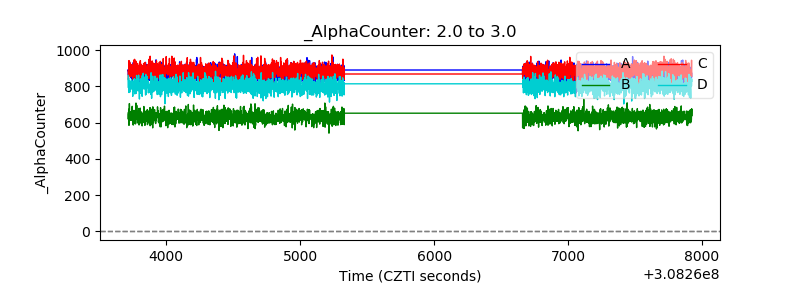 |
| _CPM_Rate | 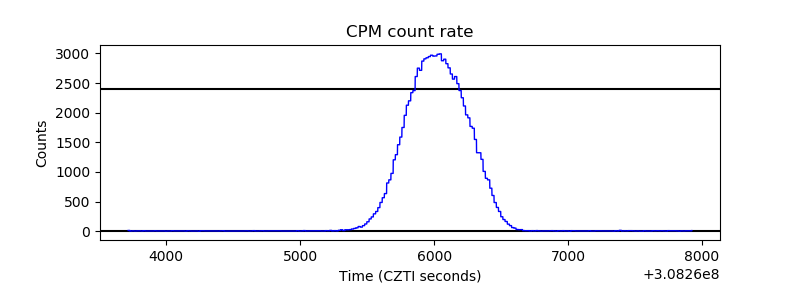 |
| CZT Counter | 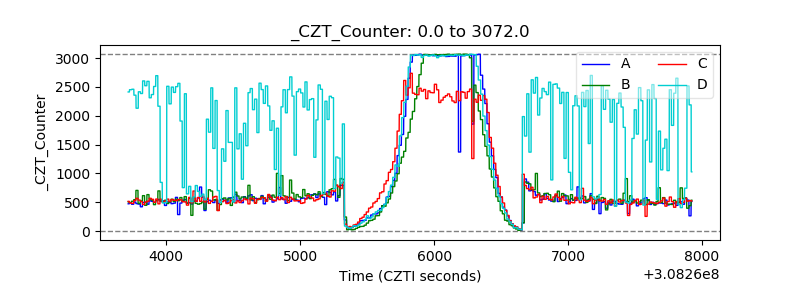 |
| +2.5 Volts monitor | 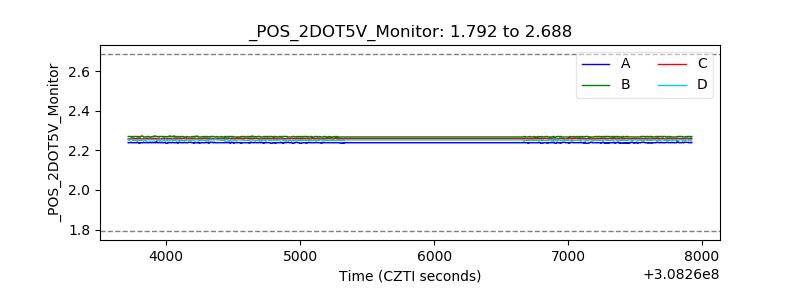 |
| +5 Volts monitor | 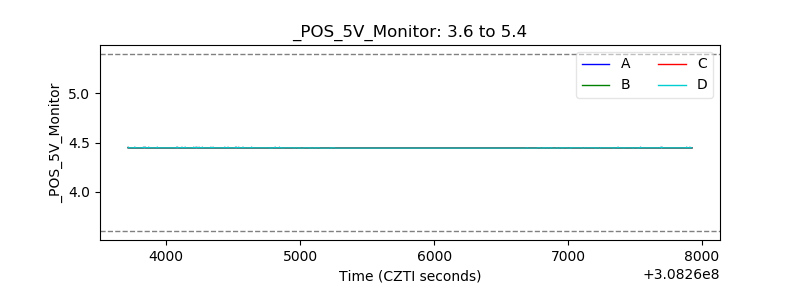 |
| _ROLL_ROT | 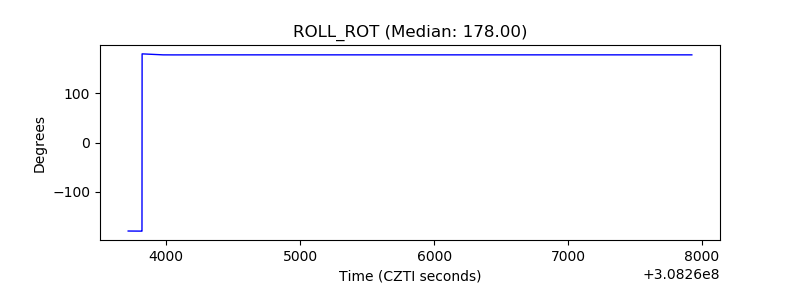 |
| _Roll_DEC | 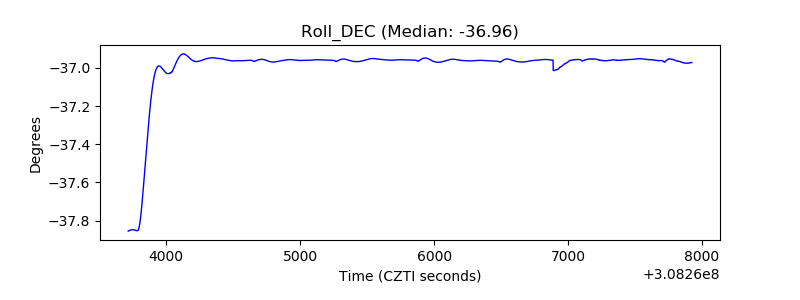 |
| _Roll_RA | 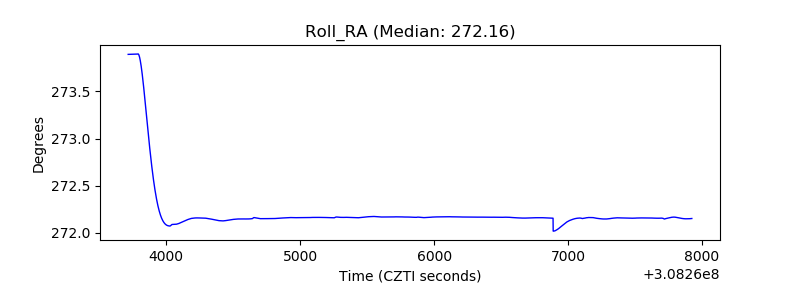 |
| Veto Counter | 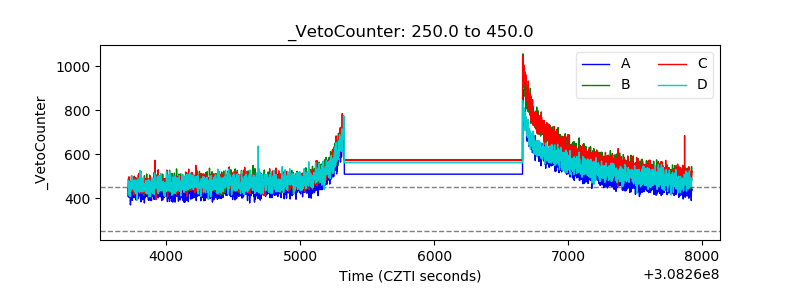 |