| Param | Original file | Final file |
|---|---|---|
| Filename | modeM0/AS1A07_006T01_9000003226_21785cztM0_level2.evt | modeM0/AS1A07_006T01_9000003226_21785cztM0_level2_quad_clean.evt |
| Size (bytes) | 682,608,960 | 78,563,520 |
| Size | 651.0 MB | 74.9 MB |
| Events in quadrant A | 3,223,131 | 509,609 |
| Events in quadrant B | 3,405,949 | 527,236 |
| Events in quadrant C | 3,196,148 | 505,709 |
| Events in quadrant D | 10,427,902 | 402,752 |
| Mode SS | |||
|---|---|---|---|
| Quadrant | BADHDUFLAG | Total packets | Discarded packets |
| A | 0 | 126 | 0 |
| B | 0 | 126 | 0 |
| C | 0 | 126 | 0 |
| D | 0 | 126 | 0 |
| Mode M0 | |||
|---|---|---|---|
| Quadrant | BADHDUFLAG | Total packets | Discarded packets |
| A | 0 | 13172 | 2 |
| B | 0 | 13722 | 2 |
| C | 0 | 12976 | 2 |
| D | 0 | 35124 | 2 |
| Mode M9 | |||
|---|---|---|---|
| Quadrant | BADHDUFLAG | Total packets | Discarded packets |
| A | 0 | 18 | 0 |
| B | 0 | 19 | 0 |
| C | 0 | 19 | 0 |
| D | 0 | 19 | 0 |
| Quadrant | Total seconds | Saturated seconds | Saturation percentage |
|---|---|---|---|
| A | 6202 | 20 | 0.322477% |
| B | 6202 | 55 | 0.886811% |
| C | 6202 | 56 | 0.902935% |
| D | 6202 | 2904 | 46.823605% |
Noise dominated data is calculated using 1-second bins in cleaned event files. If a bin has >2000 counts, and if more than 50% of those come from <1% of pixels, then it is considered to be noise-dominated and hence unusable.
| Quadrant | # 1 sec bins | Bins with >0 counts | Bins with >2000 counts | High rate bins dominated by noise | Noise dominated (total time) | Noise dominated (detector-on time) | Marked lightcurve |
|---|---|---|---|---|---|---|---|
| A | 7517 | 6203 | 2 | 2 | 0.03% | 0.03% | 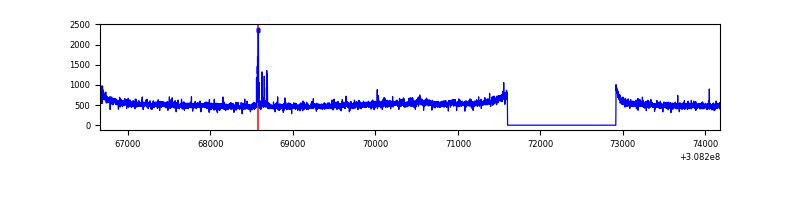 |
| B | 7517 | 6203 | 20 | 20 | 0.27% | 0.32% | 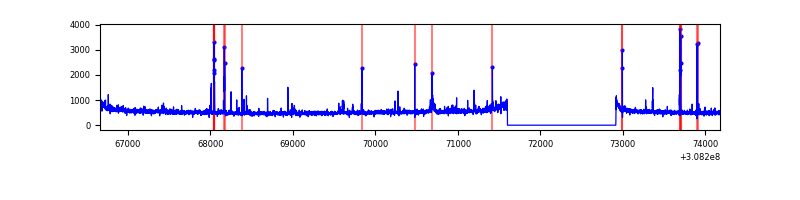 |
| C | 7517 | 6203 | 0 | 0 | 0.00% | 0.00% | 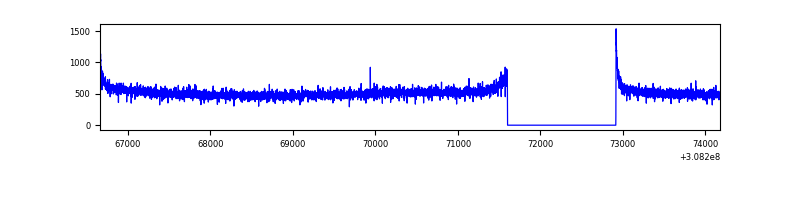 |
| D | 7517 | 6202 | 2863 | 2863 | 38.09% | 46.16% | 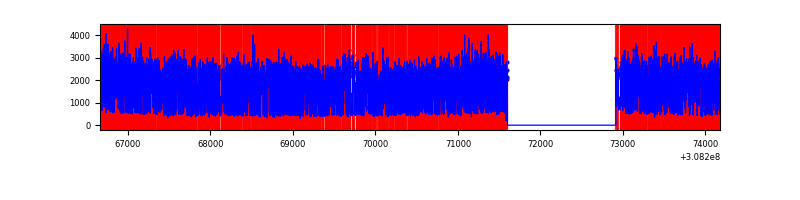 |
Top three noisy pixels from each quadrant. If the there are fewer than three noisy pixels in the level2.evt file, extra rows are filled as -1
| Pixel properties | Quadrant properties | ||||||
|---|---|---|---|---|---|---|---|
| Quadrant | DetID | PixID | Counts | Sigma | Mean | Median | Sigma |
| A | 5 | 16 | 36783 | 221.95 | 813 | 800 | 162.1 |
| A | 15 | 236 | 27324 | 163.6 | 813 | 800 | 162.1 |
| A | 13 | 252 | 24939 | 148.89 | 813 | 800 | 162.1 |
| B | 3 | 64 | 72774 | 473.63 | 820 | 801 | 152.0 |
| B | 0 | 197 | 31068 | 199.18 | 820 | 801 | 152.0 |
| B | 0 | 230 | 21120 | 133.71 | 820 | 801 | 152.0 |
| C | 14 | 238 | 125764 | 684.18 | 785 | 792 | 182.7 |
| C | 0 | 10 | 8296 | 41.08 | 785 | 792 | 182.7 |
| C | 13 | 61 | 5565 | 26.13 | 785 | 792 | 182.7 |
| D | 7 | 238 | 7363768 | 43113.63 | 704 | 686 | 170.8 |
| D | 1 | 52 | 165960 | 967.74 | 704 | 686 | 170.8 |
| D | 2 | 136 | 78057 | 453.04 | 704 | 686 | 170.8 |
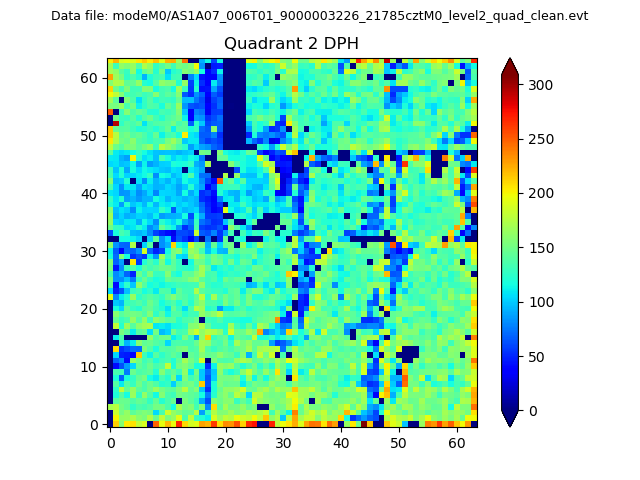
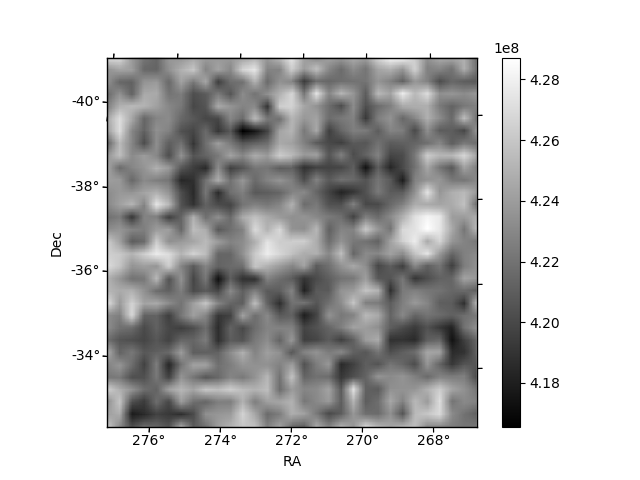
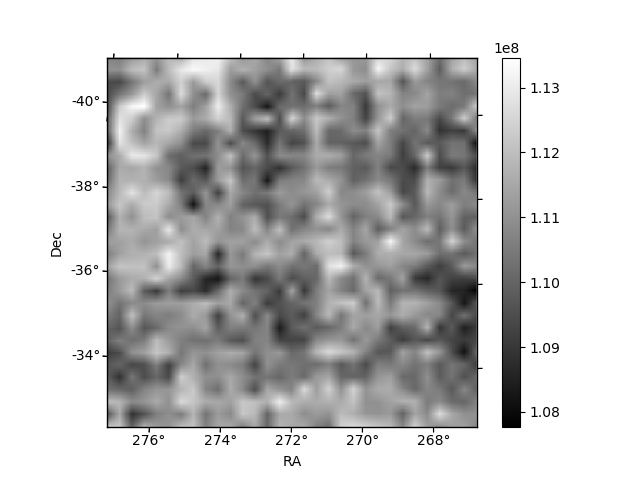
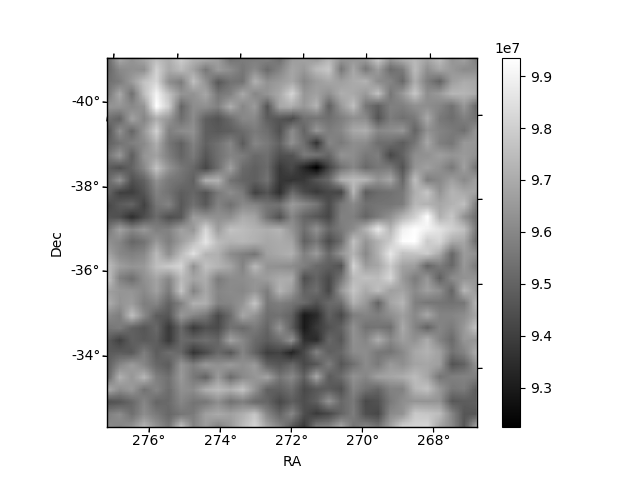
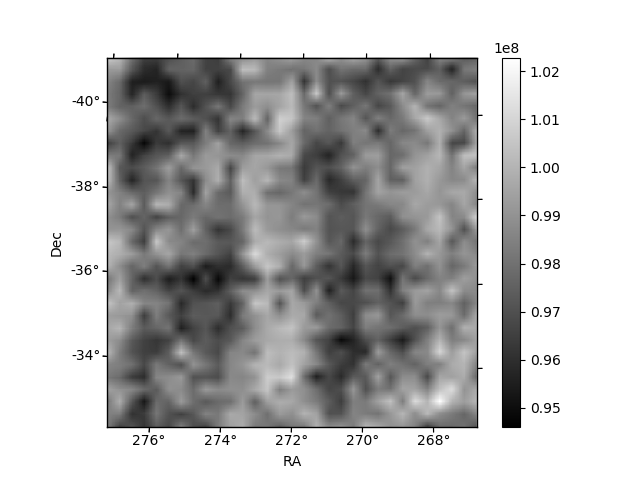
Histogram calculated using DETX and DETY for each event in the final _common_clean file
| Quadrant A | 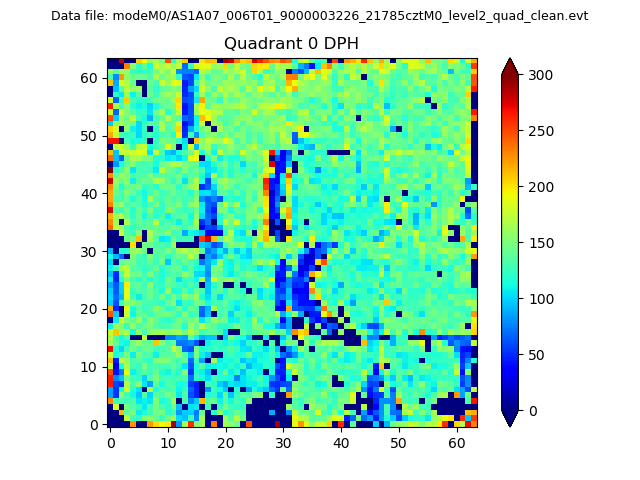 |
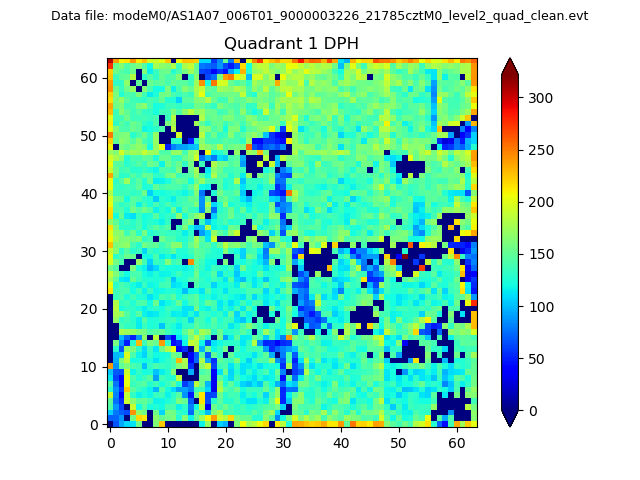 |
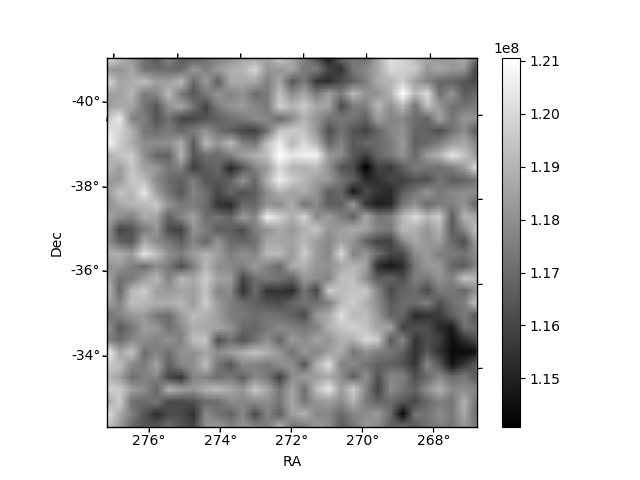
Quadrant B |
|---|---|---|---|
| Quadrant D | 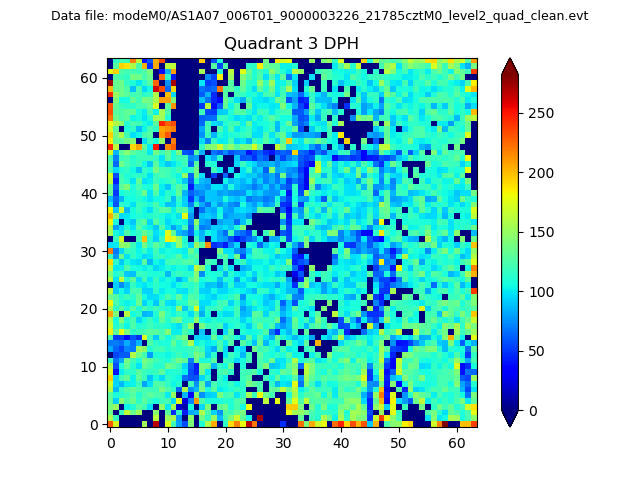 |
 |
Quadrant C |
| Plot type | Count rate plots | Images |
|---|---|---|
| Comparison with Poisson distribution Blue bars denote a histogram of data divided into 1 sec bins. Red curve is a Poisson curve with rate = median count rate of data. |
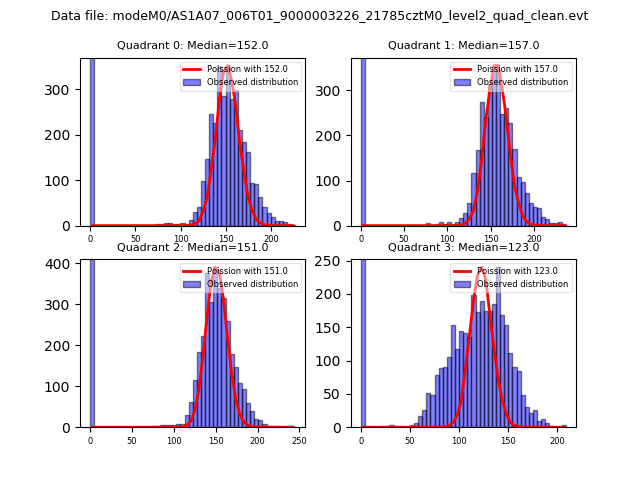 |
 |
| Quadrant-wise count rates Data is divided into 100 sec bins |
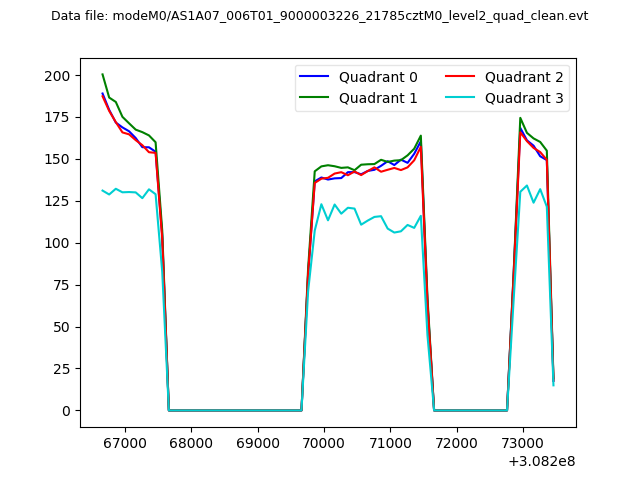 |
|
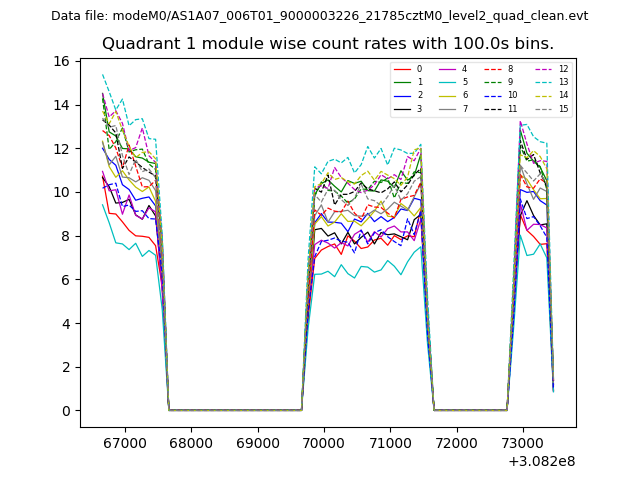
| Module-wise count rates for Quadrant A Data is divided into 100 sec bins |
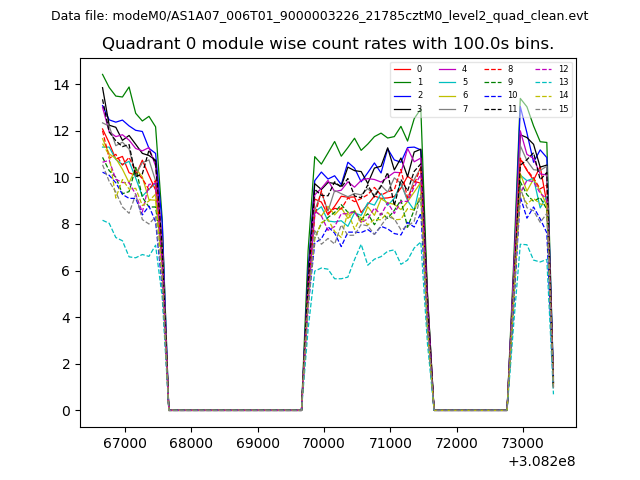 |
 |
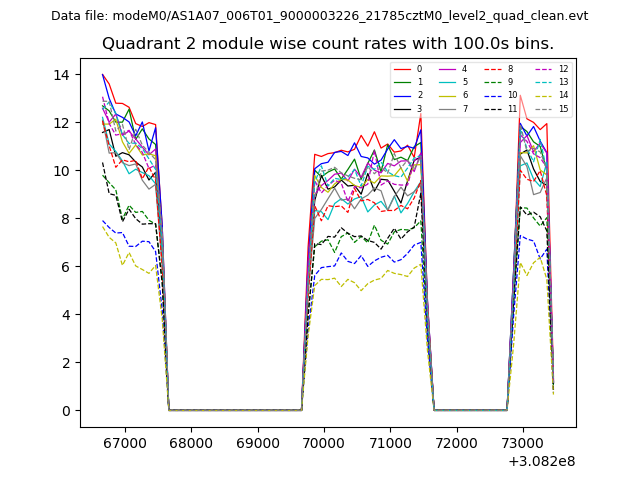
| Module-wise count rates for Quadrant B Data is divided into 100 sec bins |
 |
 |
| Module-wise count rates for Quadrant C Data is divided into 100 sec bins |
 |
 |
| Module-wise count rates for Quadrant D Data is divided into 100 sec bins |
 |
 |
| Parameter | Plot |
|---|---|
| CZT HV Monitor | 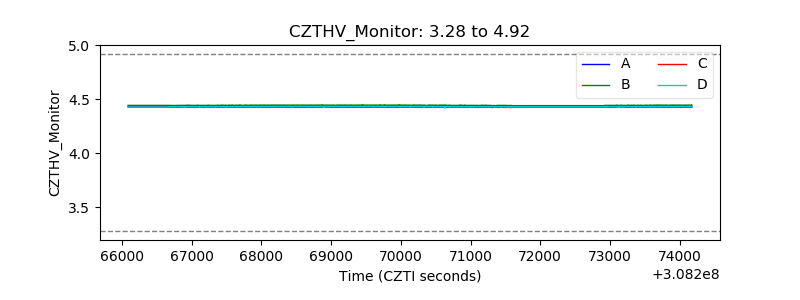 |
| D_VDD | 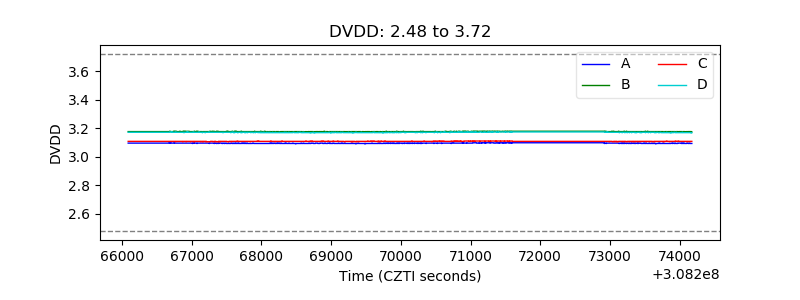 |
| Temperature 1 | 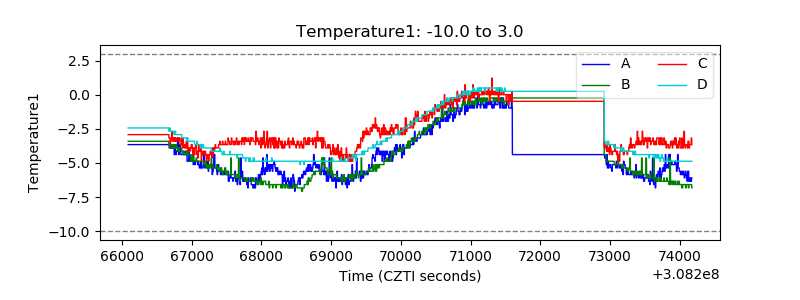 |
| Veto HV Monitor | 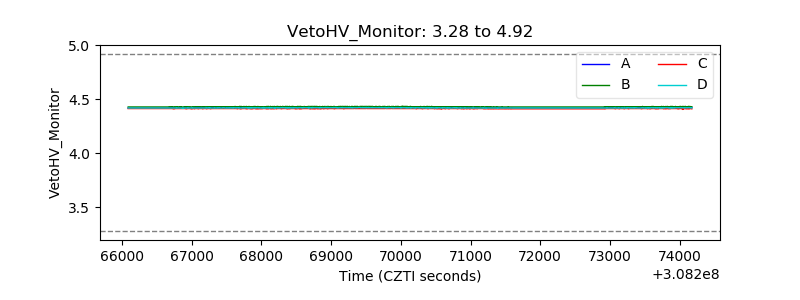 |
| Veto LLD | 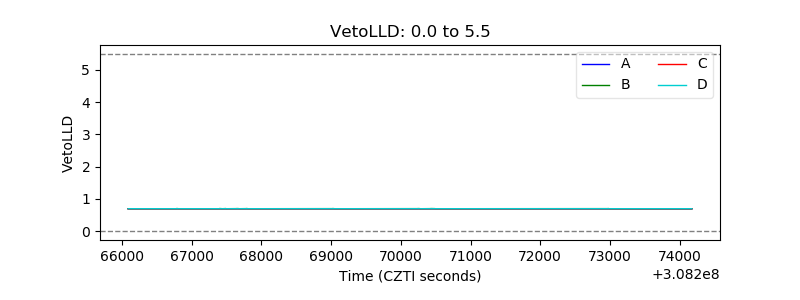 |
| Alpha Counter | 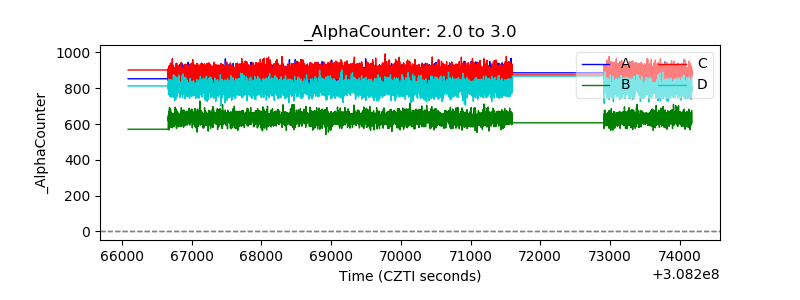 |
| _CPM_Rate | 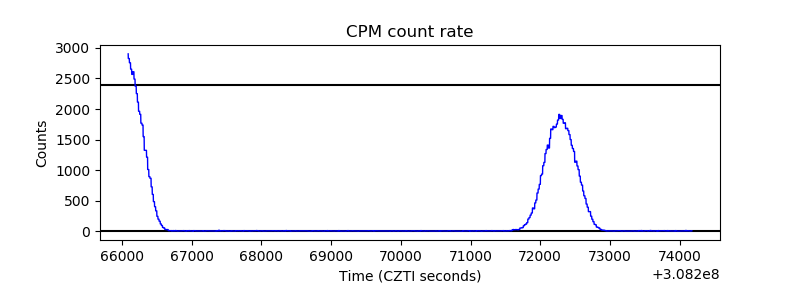 |
| CZT Counter | 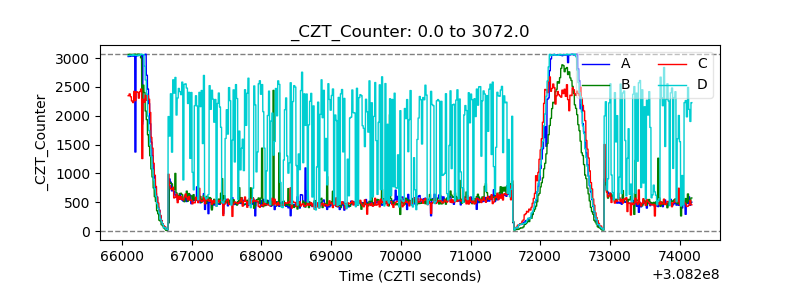 |
| +2.5 Volts monitor |  |
| +5 Volts monitor |  |
| _ROLL_ROT | 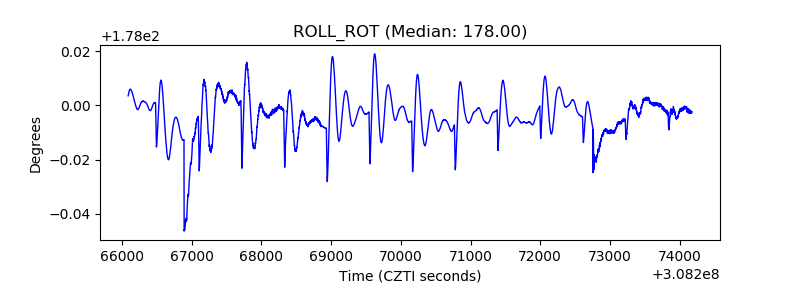 |
| _Roll_DEC | 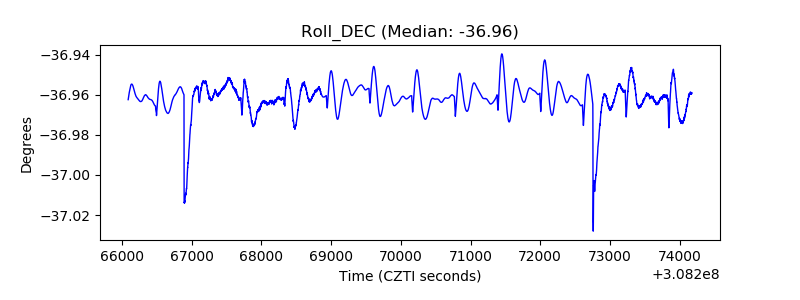 |
| _Roll_RA | 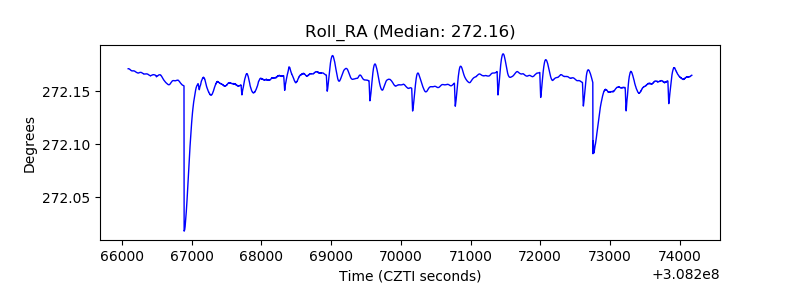 |
| Veto Counter | 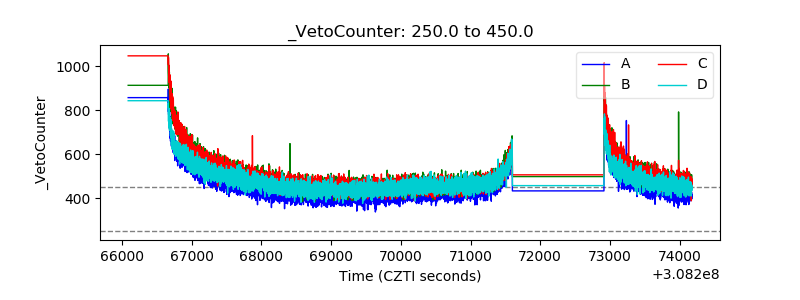 |