| Param | Original file | Final file |
|---|---|---|
| Filename | modeM0/AS1A07_006T01_9000003226_21786cztM0_level2.evt | modeM0/AS1A07_006T01_9000003226_21786cztM0_level2_quad_clean.evt |
| Size (bytes) | 581,664,960 | 73,376,640 |
| Size | 554.7 MB | 70.0 MB |
| Events in quadrant A | 3,329,517 | 445,629 |
| Events in quadrant B | 3,607,800 | 454,353 |
| Events in quadrant C | 3,351,896 | 441,653 |
| Events in quadrant D | 6,871,031 | 411,385 |
| Mode SS | |||
|---|---|---|---|
| Quadrant | BADHDUFLAG | Total packets | Discarded packets |
| A | 0 | 136 | 0 |
| B | 0 | 136 | 0 |
| C | 0 | 136 | 0 |
| D | 0 | 136 | 0 |
| Mode M0 | |||
|---|---|---|---|
| Quadrant | BADHDUFLAG | Total packets | Discarded packets |
| A | 0 | 13881 | 2 |
| B | 0 | 14637 | 2 |
| C | 0 | 13845 | 2 |
| D | 0 | 25001 | 2 |
| Mode M9 | |||
|---|---|---|---|
| Quadrant | BADHDUFLAG | Total packets | Discarded packets |
| A | 0 | 20 | 0 |
| B | 0 | 21 | 0 |
| C | 0 | 21 | 0 |
| D | 0 | 21 | 0 |
| Quadrant | Total seconds | Saturated seconds | Saturation percentage |
|---|---|---|---|
| A | 6724 | 25 | 0.371802% |
| B | 6724 | 75 | 1.115407% |
| C | 6724 | 55 | 0.817965% |
| D | 6724 | 957 | 14.232600% |
Noise dominated data is calculated using 1-second bins in cleaned event files. If a bin has >2000 counts, and if more than 50% of those come from <1% of pixels, then it is considered to be noise-dominated and hence unusable.
| Quadrant | # 1 sec bins | Bins with >0 counts | Bins with >2000 counts | High rate bins dominated by noise | Noise dominated (total time) | Noise dominated (detector-on time) | Marked lightcurve |
|---|---|---|---|---|---|---|---|
| A | 7864 | 6725 | 0 | 0 | 0.00% | 0.00% | 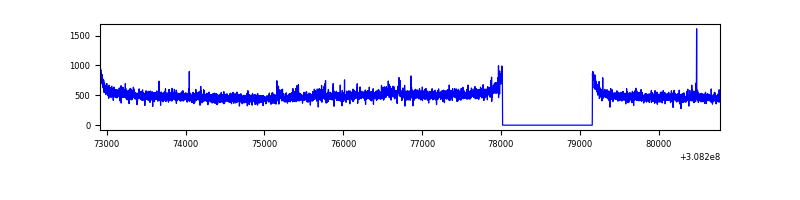 |
| B | 7864 | 6725 | 28 | 28 | 0.36% | 0.42% | 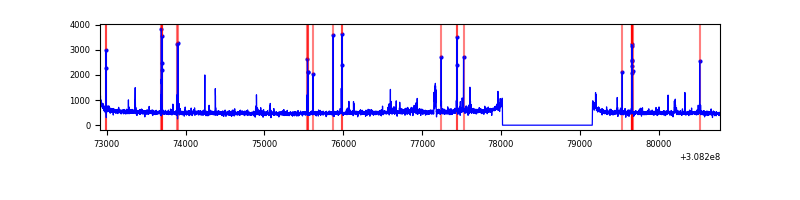 |
| C | 7864 | 6725 | 0 | 0 | 0.00% | 0.00% | 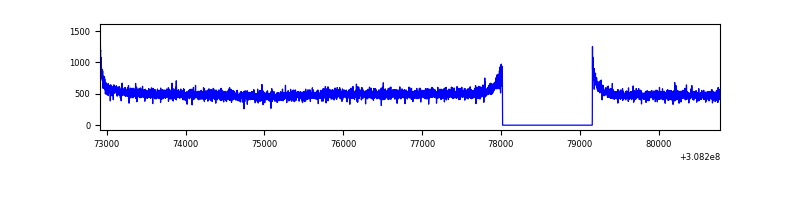 |
| D | 7864 | 6725 | 995 | 995 | 12.65% | 14.80% | 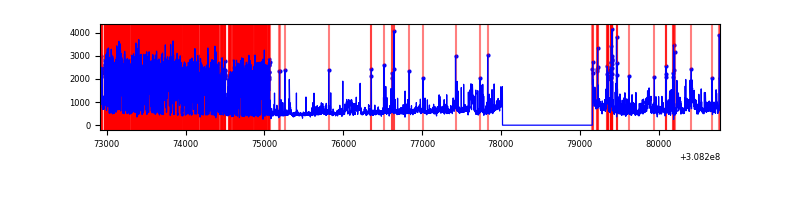 |
Top three noisy pixels from each quadrant. If the there are fewer than three noisy pixels in the level2.evt file, extra rows are filled as -1
| Pixel properties | Quadrant properties | ||||||
|---|---|---|---|---|---|---|---|
| Quadrant | DetID | PixID | Counts | Sigma | Mean | Median | Sigma |
| A | 13 | 252 | 33965 | 193.77 | 852 | 834 | 171.0 |
| A | 13 | 254 | 12789 | 69.92 | 852 | 834 | 171.0 |
| A | 5 | 16 | 8051 | 42.21 | 852 | 834 | 171.0 |
| B | 3 | 64 | 86549 | 529.89 | 858 | 838 | 161.8 |
| B | 0 | 190 | 35062 | 211.58 | 858 | 838 | 161.8 |
| B | 0 | 230 | 26813 | 160.59 | 858 | 838 | 161.8 |
| C | 14 | 238 | 131745 | 686.67 | 824 | 830 | 190.7 |
| C | 0 | 10 | 6642 | 30.48 | 824 | 830 | 190.7 |
| C | 13 | 61 | 5928 | 26.74 | 824 | 830 | 190.7 |
| D | 7 | 238 | 3010548 | 15564.9 | 802 | 780 | 193.4 |
| D | 1 | 52 | 570988 | 2948.81 | 802 | 780 | 193.4 |
| D | 13 | 153 | 111654 | 573.38 | 802 | 780 | 193.4 |
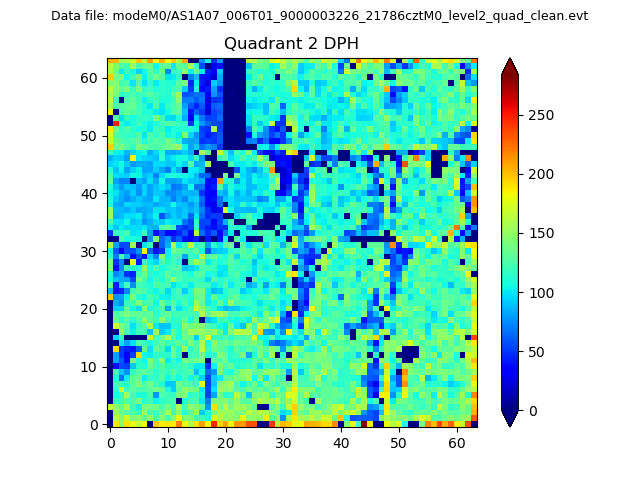
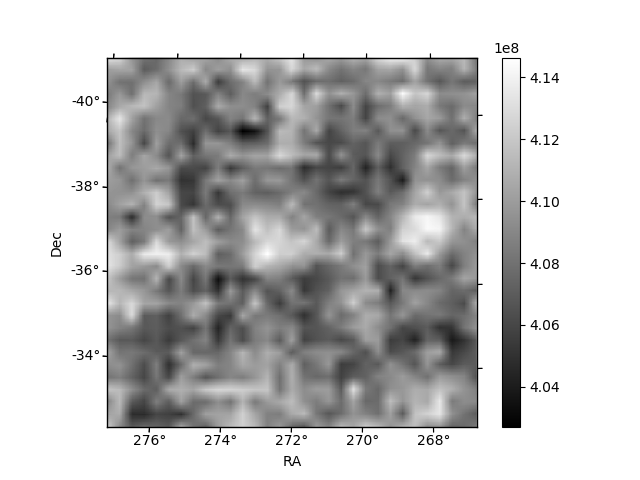
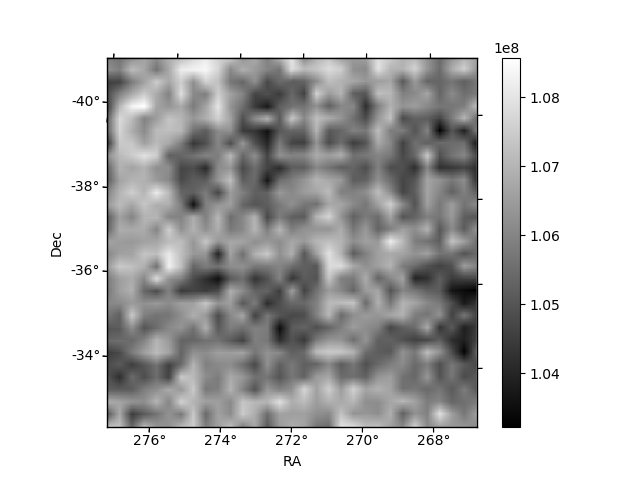
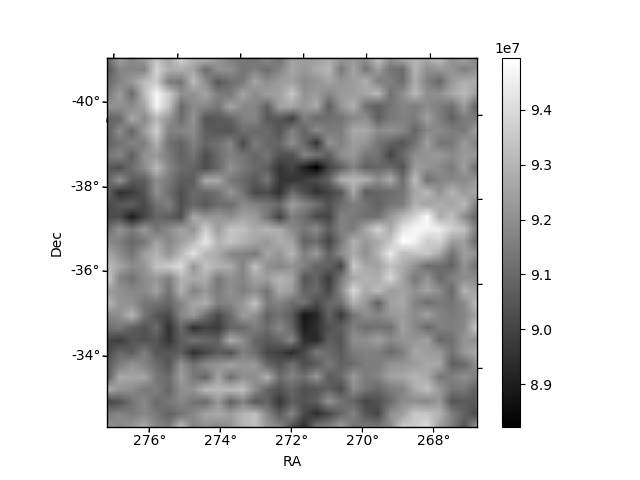
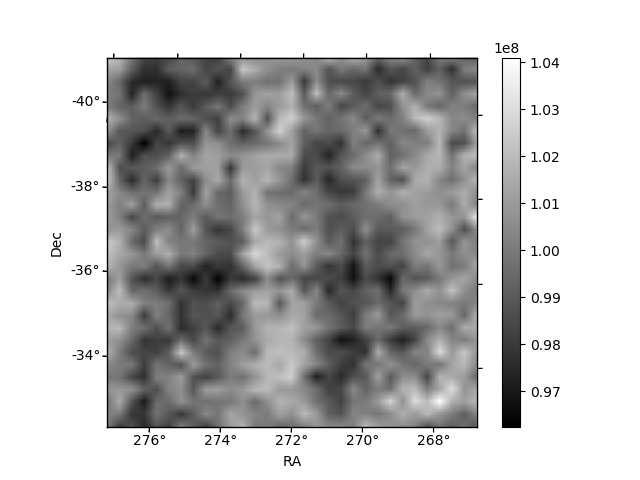
Histogram calculated using DETX and DETY for each event in the final _common_clean file
| Quadrant A | 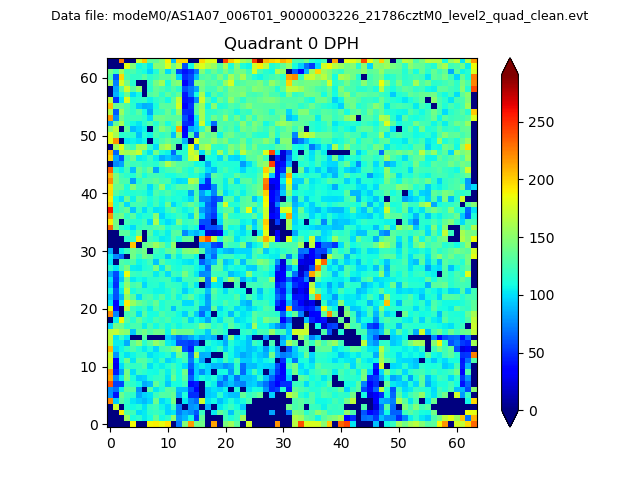 |
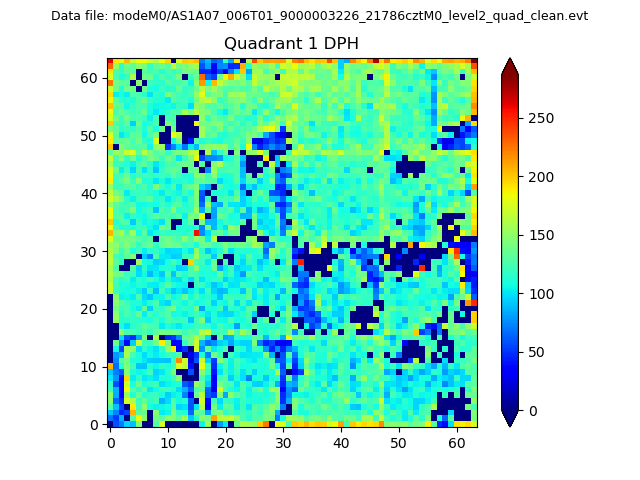 |
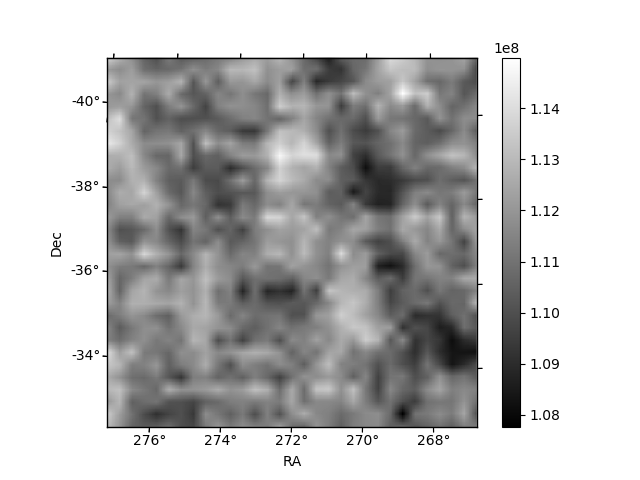
Quadrant B |
|---|---|---|---|
| Quadrant D | 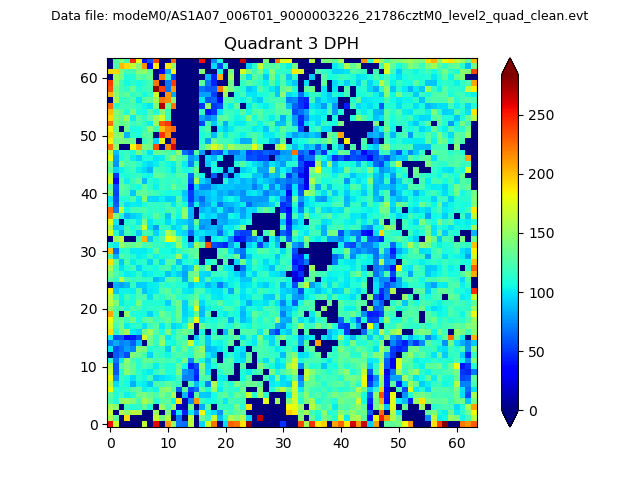 |
 |
Quadrant C |
| Plot type | Count rate plots | Images |
|---|---|---|
| Comparison with Poisson distribution Blue bars denote a histogram of data divided into 1 sec bins. Red curve is a Poisson curve with rate = median count rate of data. |
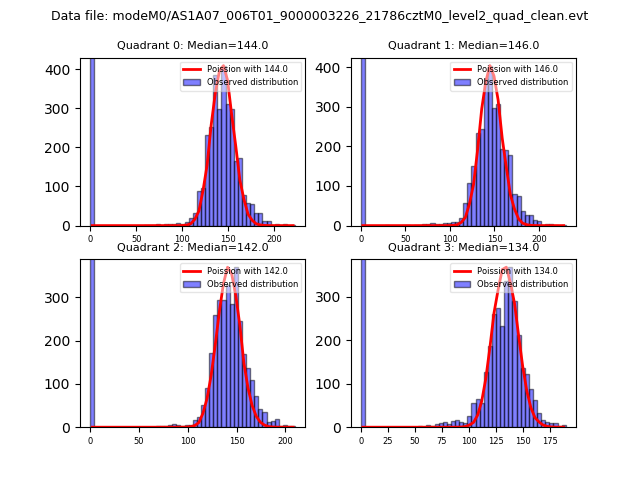 |
 |
| Quadrant-wise count rates Data is divided into 100 sec bins |
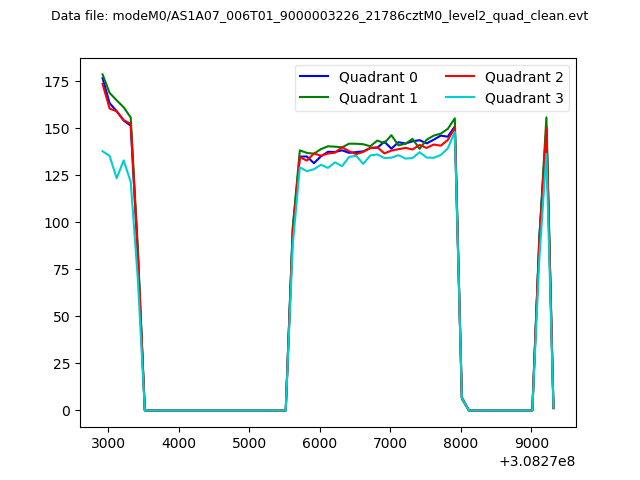 |
|
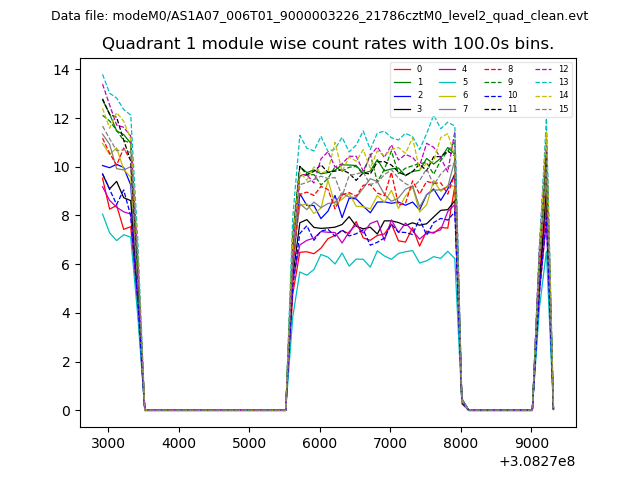
| Module-wise count rates for Quadrant A Data is divided into 100 sec bins |
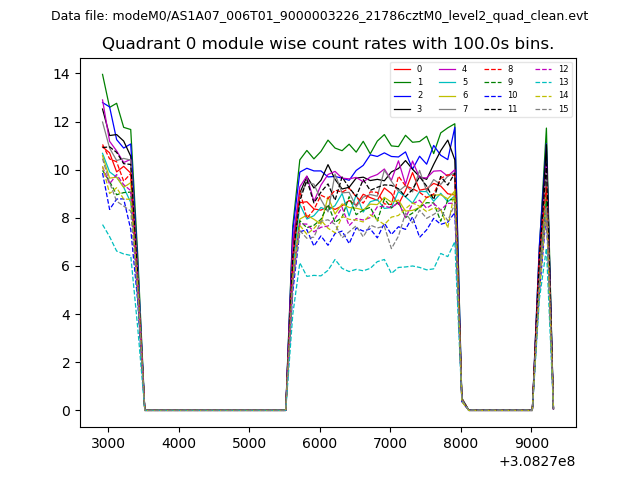 |
 |
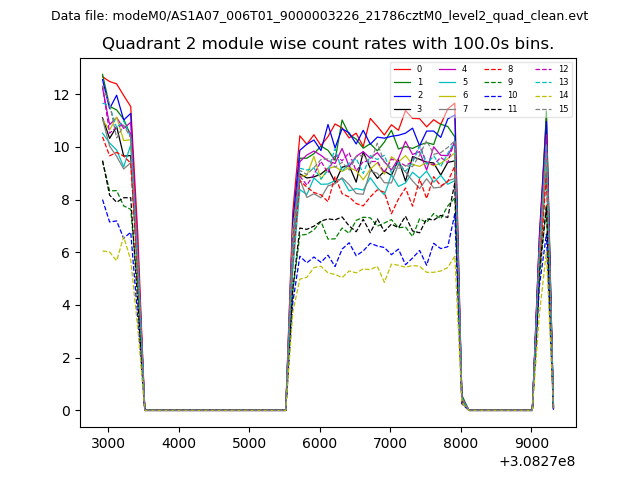
| Module-wise count rates for Quadrant B Data is divided into 100 sec bins |
 |
 |
| Module-wise count rates for Quadrant C Data is divided into 100 sec bins |
 |
 |
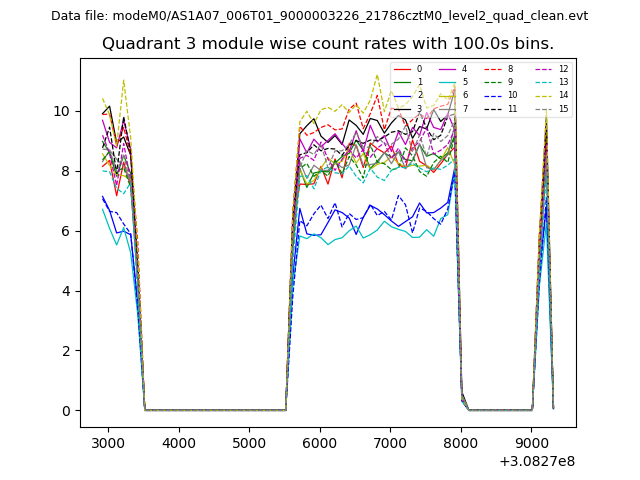
| Module-wise count rates for Quadrant D Data is divided into 100 sec bins |
 |
 |
| Parameter | Plot |
|---|---|
| CZT HV Monitor | 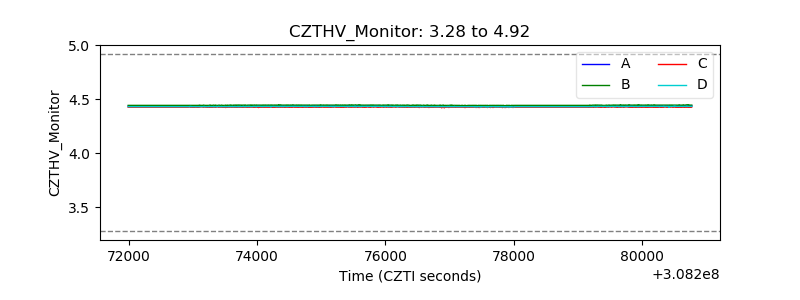 |
| D_VDD | 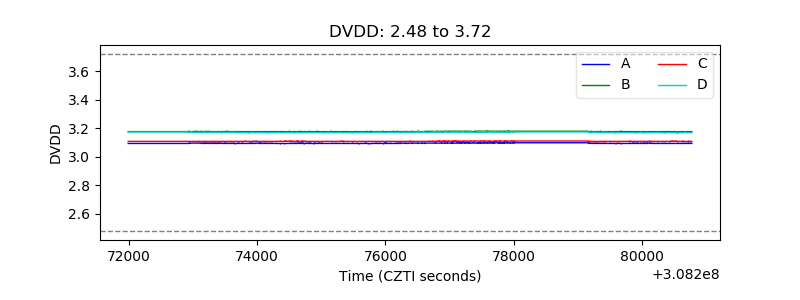 |
| Temperature 1 |  |
| Veto HV Monitor | 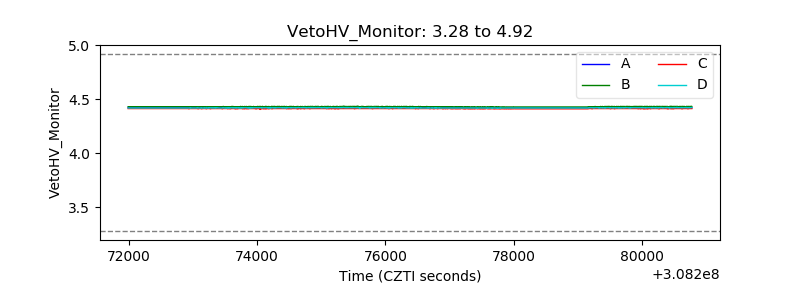 |
| Veto LLD | 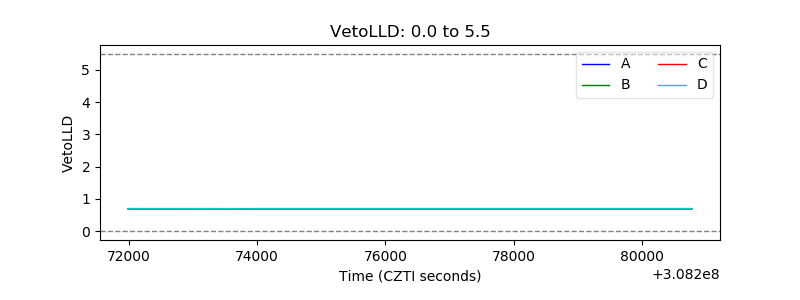 |
| Alpha Counter | 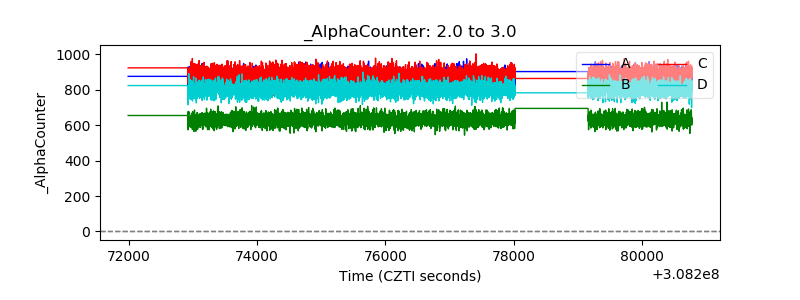 |
| _CPM_Rate | 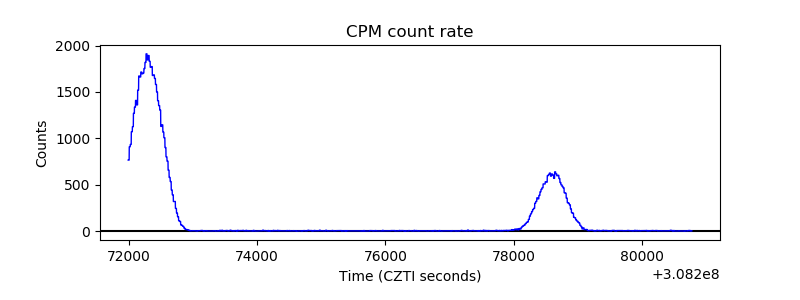 |
| CZT Counter | 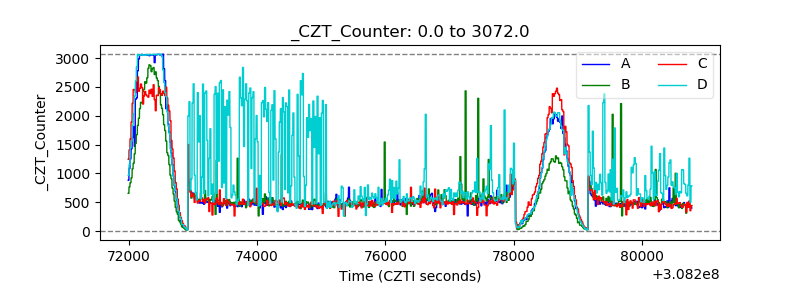 |
| +2.5 Volts monitor |  |
| +5 Volts monitor |  |
| _ROLL_ROT |  |
| _Roll_DEC | 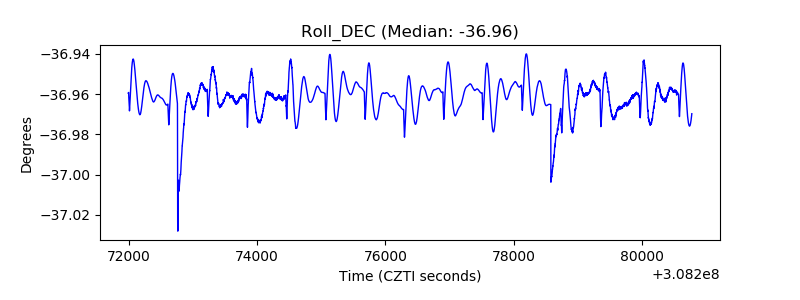 |
| _Roll_RA | 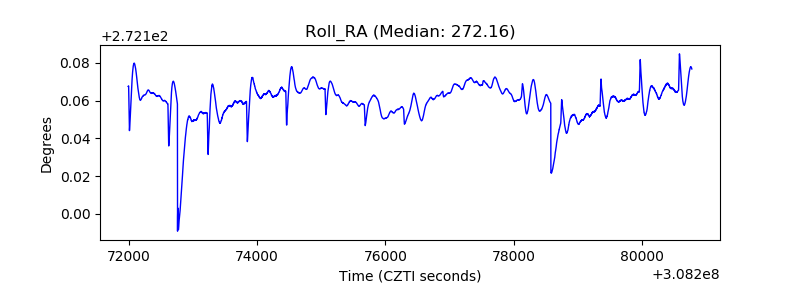 |
| Veto Counter | 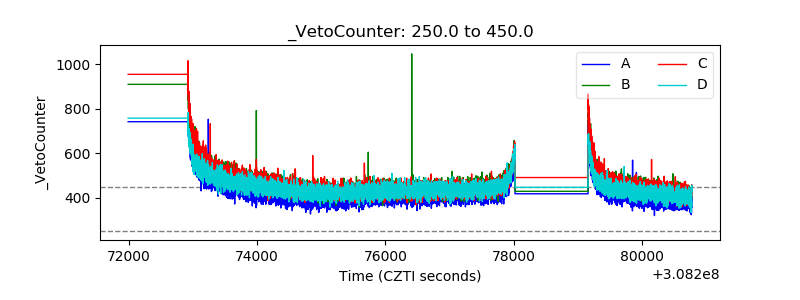 |