| Param | Original file | Final file |
|---|---|---|
| Filename | modeM0/AS1A07_006T01_9000003226_21787cztM0_level2.evt | modeM0/AS1A07_006T01_9000003226_21787cztM0_level2_quad_clean.evt |
| Size (bytes) | 566,550,720 | 67,896,000 |
| Size | 540.3 MB | 64.8 MB |
| Events in quadrant A | 3,114,738 | 416,557 |
| Events in quadrant B | 3,322,818 | 424,041 |
| Events in quadrant C | 3,132,216 | 413,942 |
| Events in quadrant D | 7,147,466 | 346,946 |
| Mode SS | |||
|---|---|---|---|
| Quadrant | BADHDUFLAG | Total packets | Discarded packets |
| A | 0 | 132 | 0 |
| B | 0 | 132 | 0 |
| C | 0 | 132 | 0 |
| D | 0 | 132 | 0 |
| Mode M0 | |||
|---|---|---|---|
| Quadrant | BADHDUFLAG | Total packets | Discarded packets |
| A | 0 | 13338 | 2 |
| B | 0 | 13780 | 1 |
| C | 0 | 13309 | 1 |
| D | 0 | 25807 | 1 |
| Mode M9 | |||
|---|---|---|---|
| Quadrant | BADHDUFLAG | Total packets | Discarded packets |
| A | 0 | 8 | 0 |
| B | 0 | 8 | 0 |
| C | 0 | 8 | 0 |
| D | 0 | 8 | 0 |
| Quadrant | Total seconds | Saturated seconds | Saturation percentage |
|---|---|---|---|
| A | 6506 | 48 | 0.737781% |
| B | 6507 | 74 | 1.137237% |
| C | 6507 | 89 | 1.367758% |
| D | 6507 | 936 | 14.384509% |
Noise dominated data is calculated using 1-second bins in cleaned event files. If a bin has >2000 counts, and if more than 50% of those come from <1% of pixels, then it is considered to be noise-dominated and hence unusable.
| Quadrant | # 1 sec bins | Bins with >0 counts | Bins with >2000 counts | High rate bins dominated by noise | Noise dominated (total time) | Noise dominated (detector-on time) | Marked lightcurve |
|---|---|---|---|---|---|---|---|
| A | 7301 | 6507 | 0 | 0 | 0.00% | 0.00% | 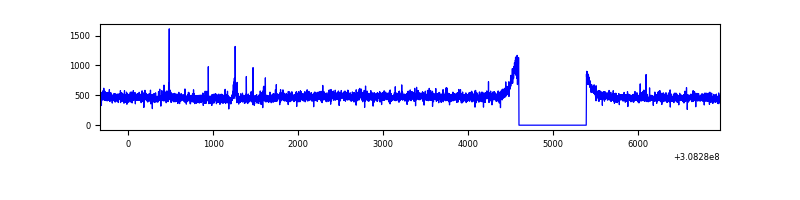 |
| B | 7302 | 6508 | 9 | 9 | 0.12% | 0.14% | 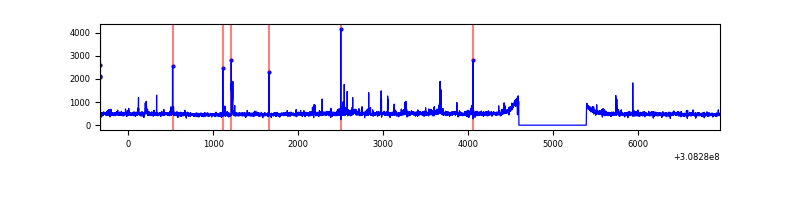 |
| C | 7302 | 6508 | 0 | 0 | 0.00% | 0.00% | 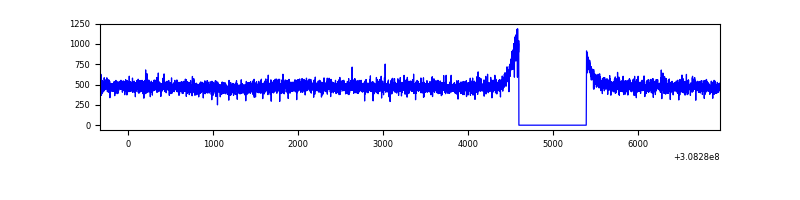 |
| D | 7302 | 6507 | 761 | 761 | 10.42% | 11.70% | 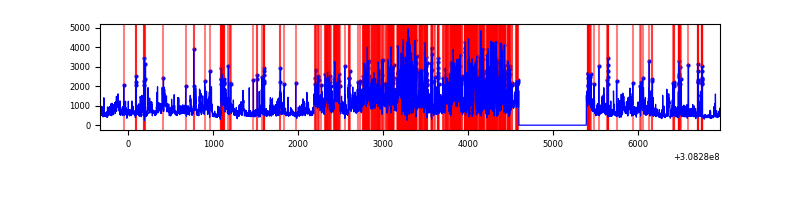 |
Top three noisy pixels from each quadrant. If the there are fewer than three noisy pixels in the level2.evt file, extra rows are filled as -1
| Pixel properties | Quadrant properties | ||||||
|---|---|---|---|---|---|---|---|
| Quadrant | DetID | PixID | Counts | Sigma | Mean | Median | Sigma |
| A | 5 | 16 | 22251 | 132.78 | 801 | 787 | 161.7 |
| A | 13 | 254 | 12327 | 71.39 | 801 | 787 | 161.7 |
| A | 0 | 226 | 6947 | 38.11 | 801 | 787 | 161.7 |
| B | 3 | 64 | 64809 | 411.37 | 805 | 785 | 155.6 |
| B | 0 | 190 | 30221 | 189.14 | 805 | 785 | 155.6 |
| B | 0 | 197 | 20896 | 129.22 | 805 | 785 | 155.6 |
| C | 14 | 238 | 121184 | 667.87 | 772 | 777 | 180.3 |
| C | 13 | 61 | 5553 | 26.49 | 772 | 777 | 180.3 |
| C | 3 | 202 | 1929 | 6.39 | 772 | 777 | 180.3 |
| D | 1 | 52 | 2152350 | 11972.88 | 733 | 711 | 179.7 |
| D | 7 | 238 | 2022465 | 11250.13 | 733 | 711 | 179.7 |
| D | 2 | 136 | 119799 | 662.67 | 733 | 711 | 179.7 |
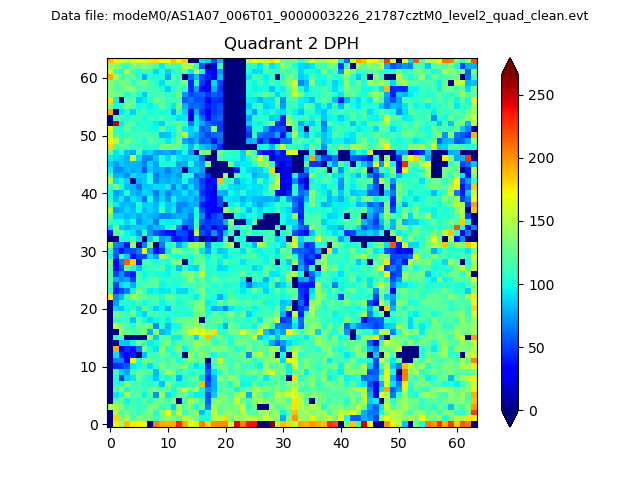
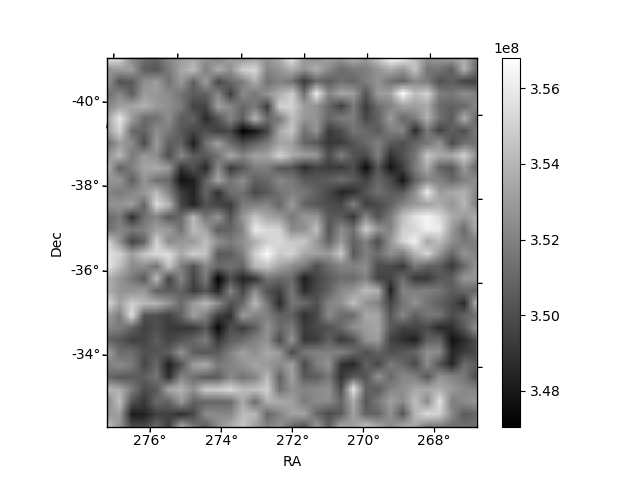
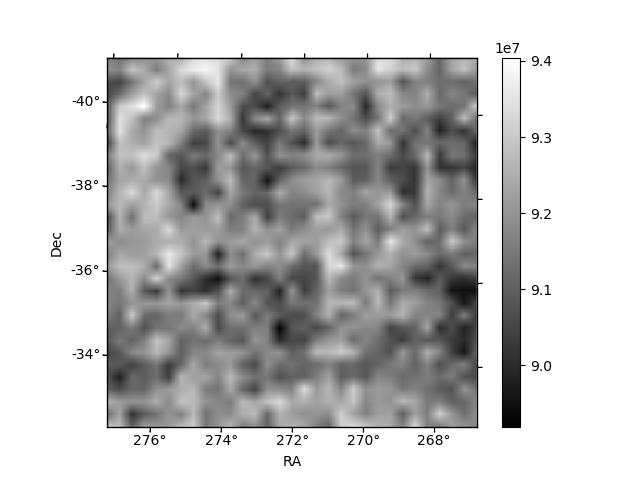
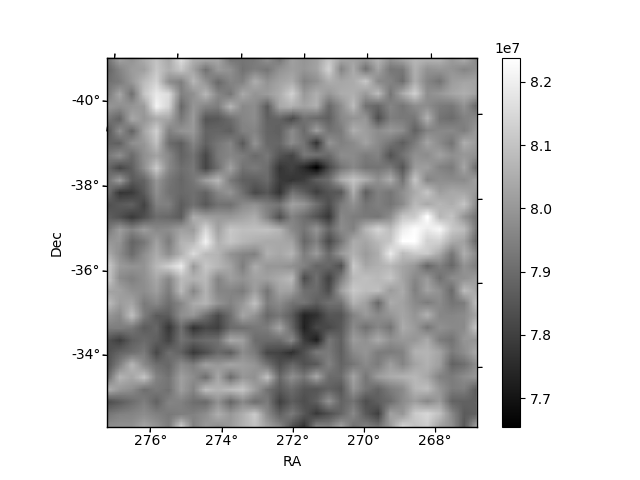
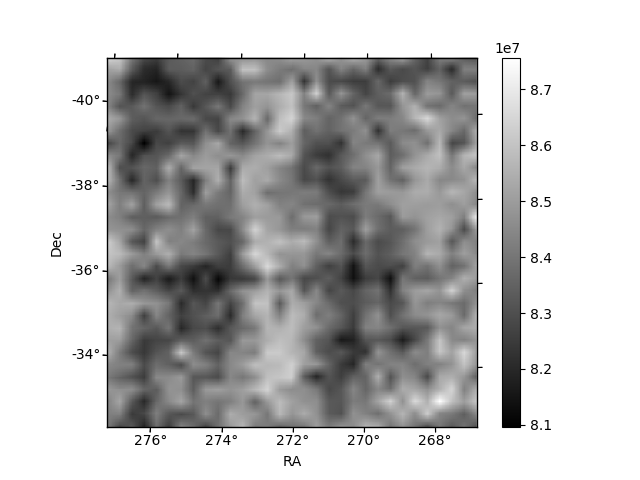
Histogram calculated using DETX and DETY for each event in the final _common_clean file
| Quadrant A | 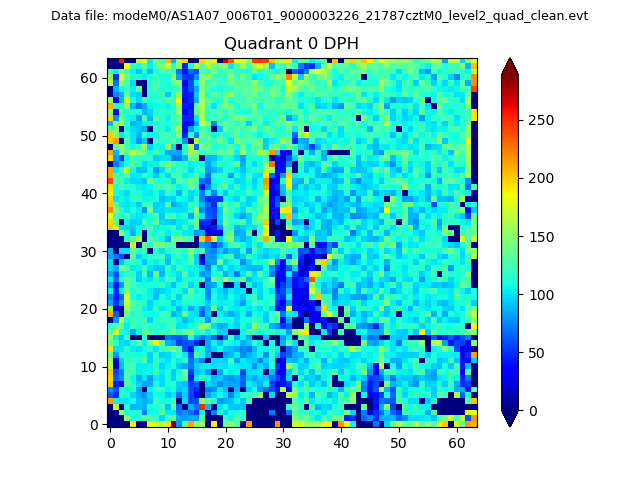 |
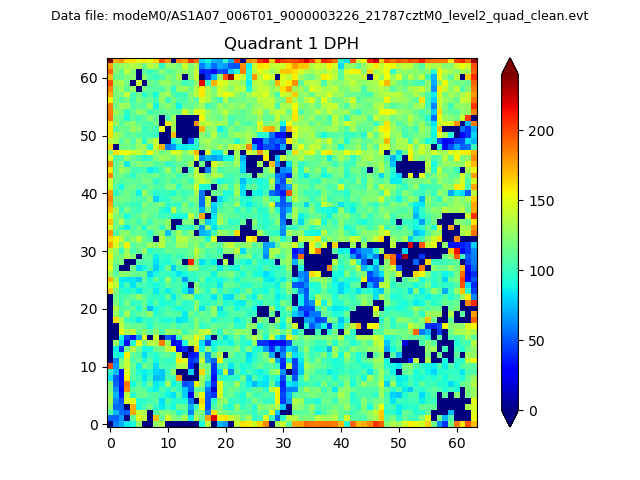 |
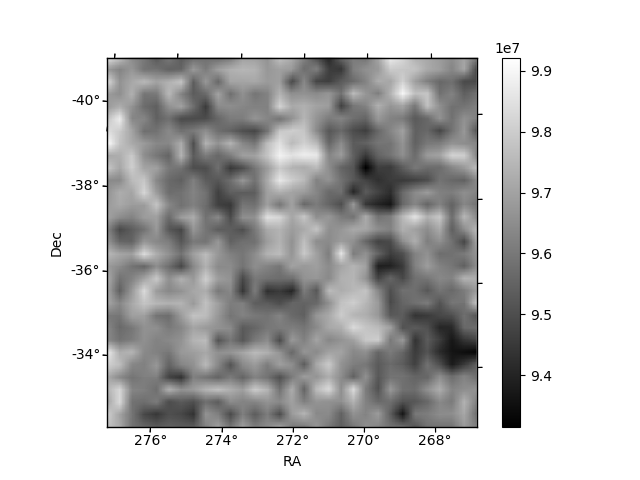
Quadrant B |
|---|---|---|---|
| Quadrant D | 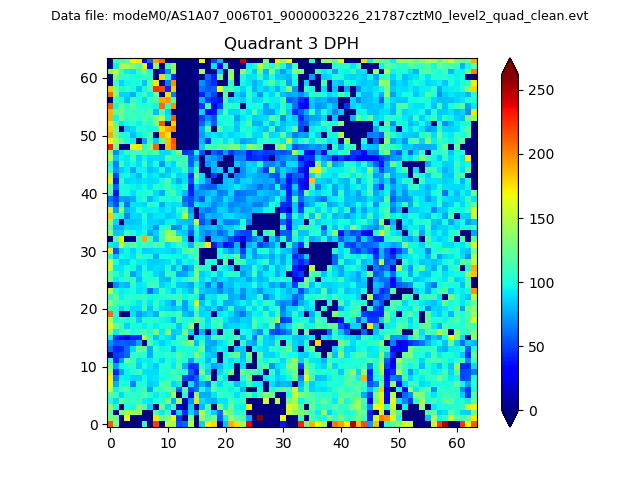 |
 |
Quadrant C |
| Plot type | Count rate plots | Images |
|---|---|---|
| Comparison with Poisson distribution Blue bars denote a histogram of data divided into 1 sec bins. Red curve is a Poisson curve with rate = median count rate of data. |
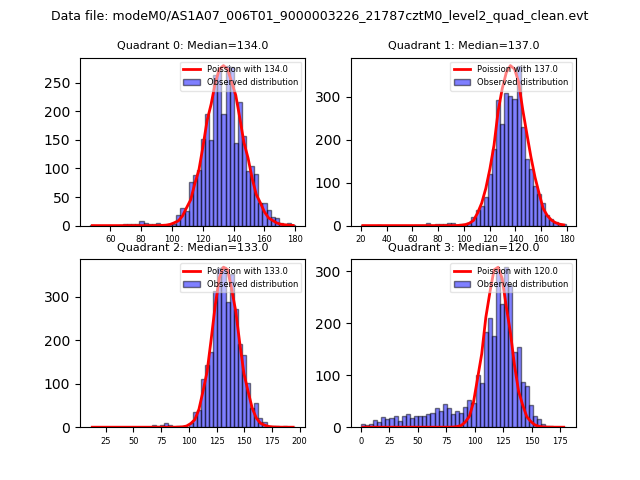 |
 |
| Quadrant-wise count rates Data is divided into 100 sec bins |
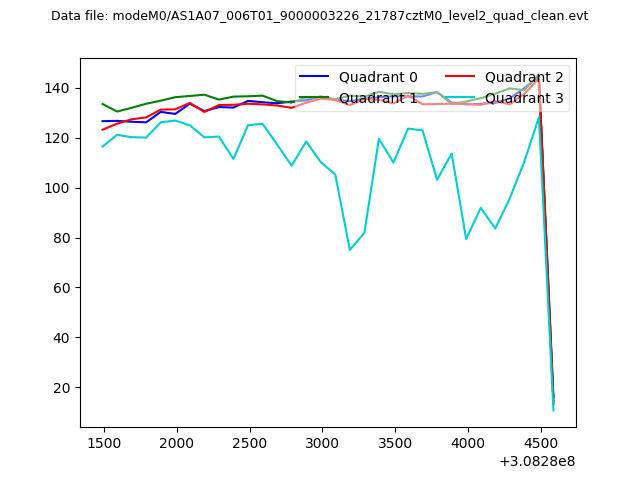 |
|
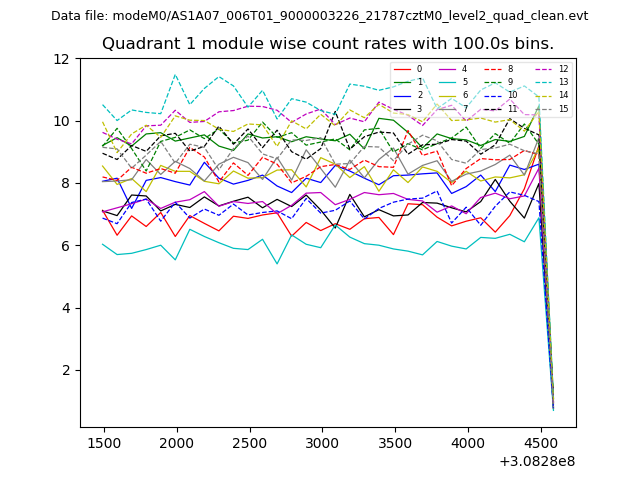
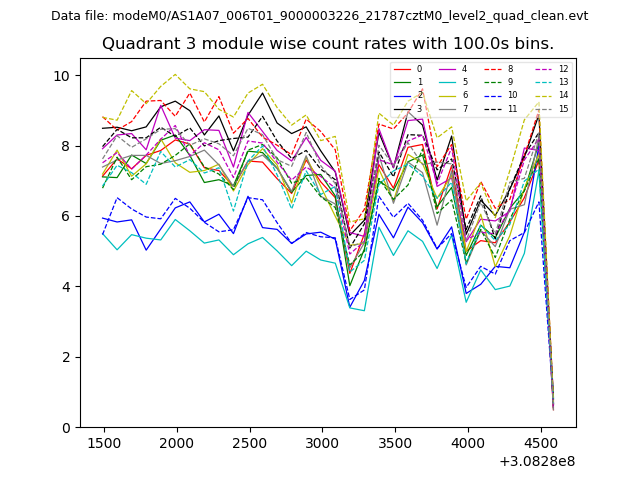
| Module-wise count rates for Quadrant A Data is divided into 100 sec bins |
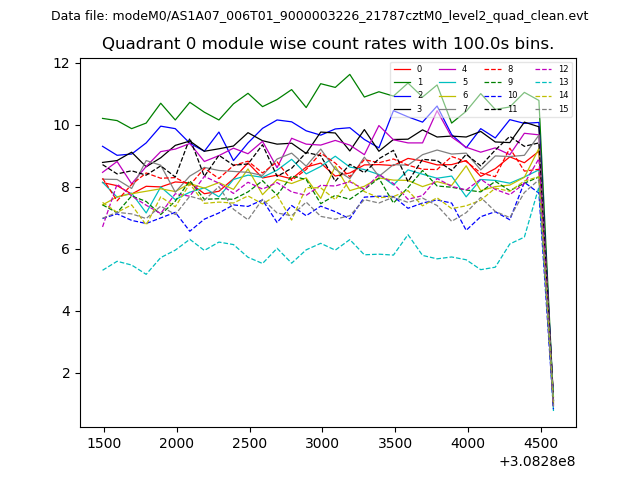 |
 |
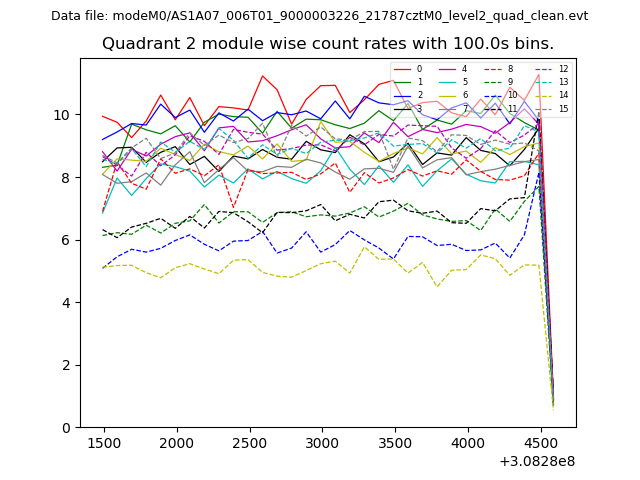
| Module-wise count rates for Quadrant B Data is divided into 100 sec bins |
 |
 |
| Module-wise count rates for Quadrant C Data is divided into 100 sec bins |
 |
 |
| Module-wise count rates for Quadrant D Data is divided into 100 sec bins |
 |
 |
| Parameter | Plot |
|---|---|
| CZT HV Monitor | 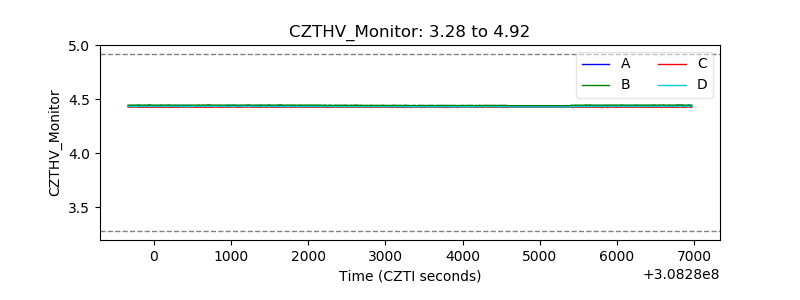 |
| D_VDD | 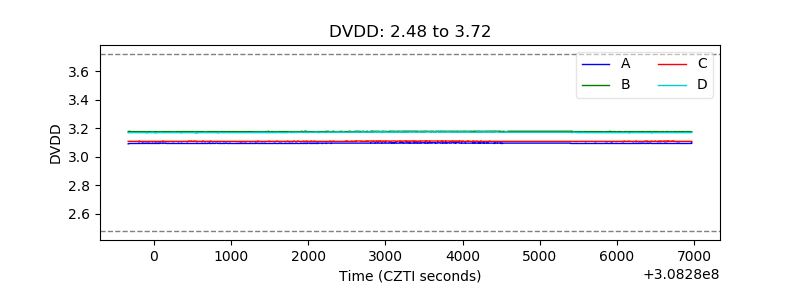 |
| Temperature 1 | 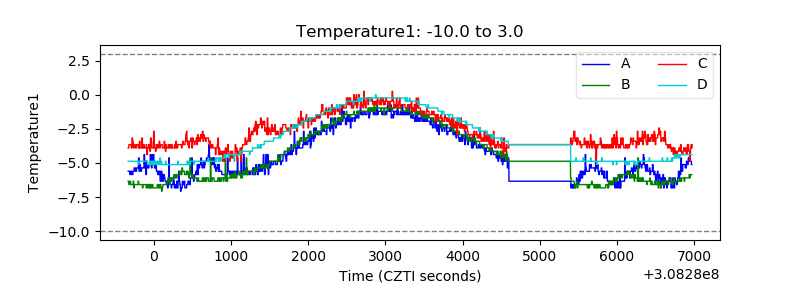 |
| Veto HV Monitor | 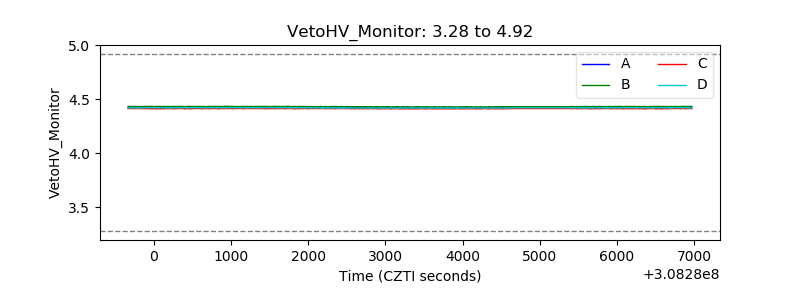 |
| Veto LLD | 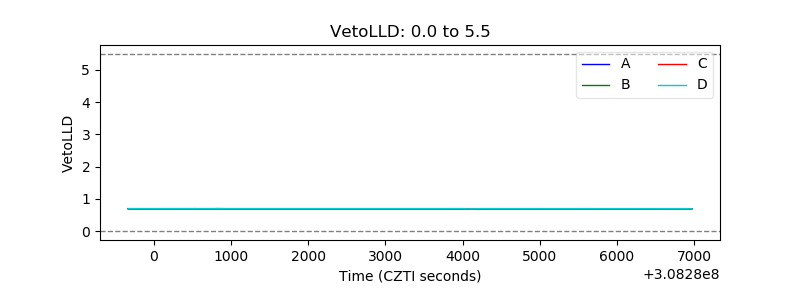 |
| Alpha Counter | 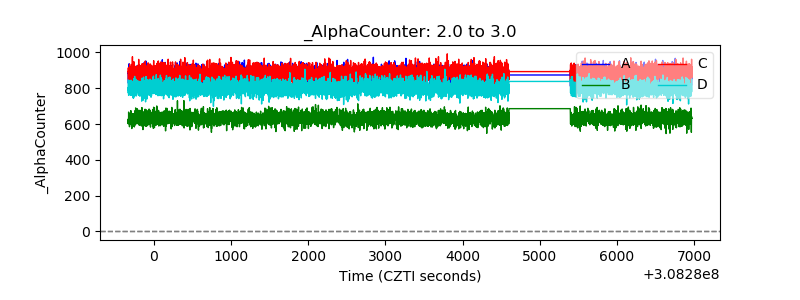 |
| _CPM_Rate | 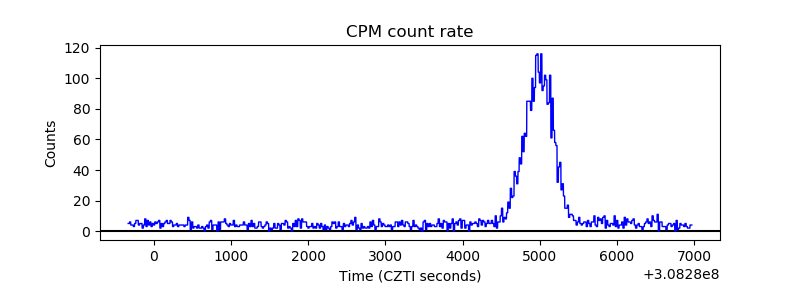 |
| CZT Counter | 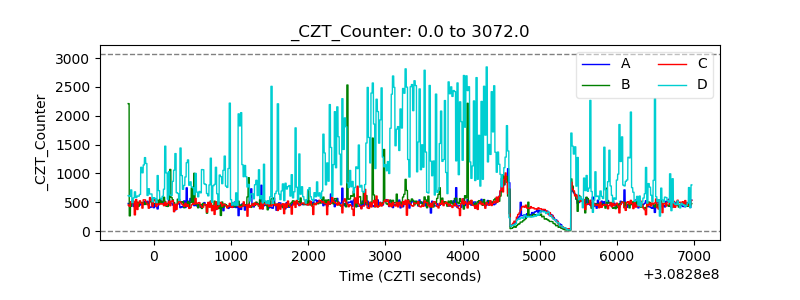 |
| +2.5 Volts monitor |  |
| +5 Volts monitor |  |
| _ROLL_ROT | 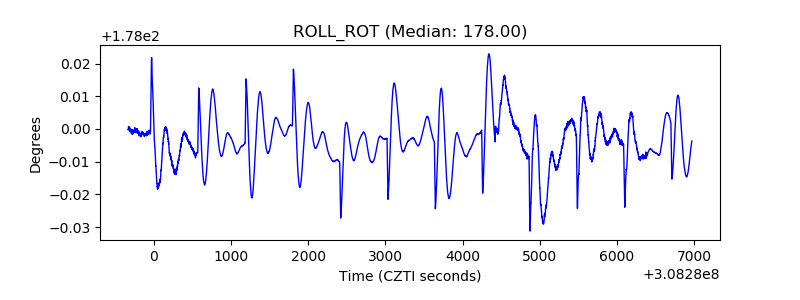 |
| _Roll_DEC | 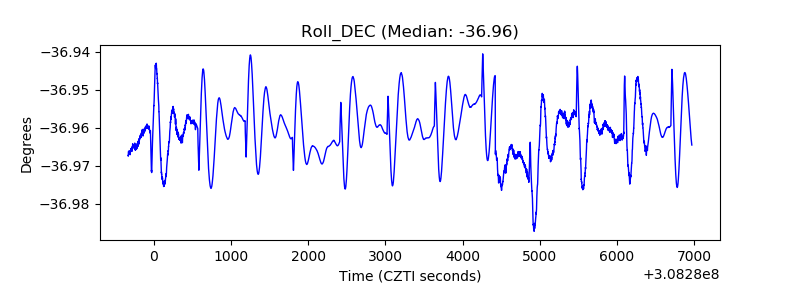 |
| _Roll_RA | 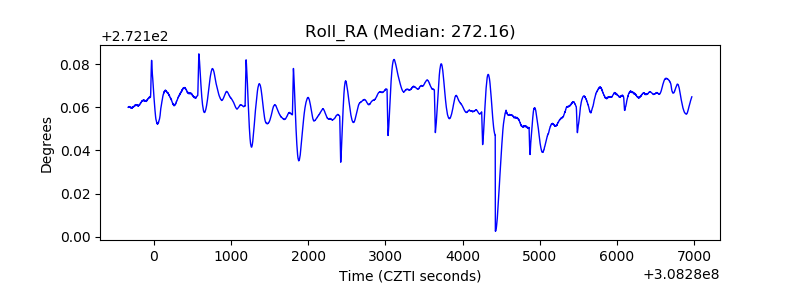 |
| Veto Counter | 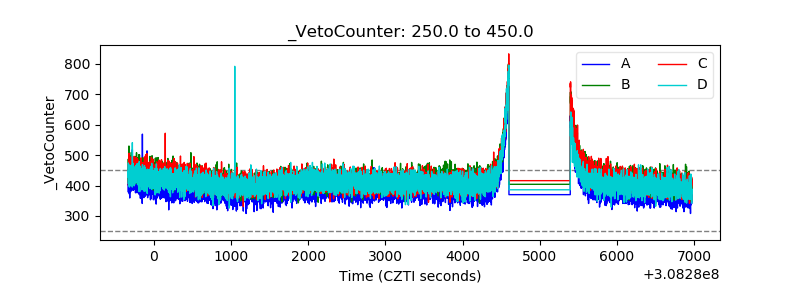 |