| Param | Original file | Final file |
|---|---|---|
| Filename | modeM0/AS1A07_006T01_9000003226_21788cztM0_level2.evt | modeM0/AS1A07_006T01_9000003226_21788cztM0_level2_quad_clean.evt |
| Size (bytes) | 743,135,040 | 83,013,120 |
| Size | 708.7 MB | 79.2 MB |
| Events in quadrant A | 3,872,192 | 520,578 |
| Events in quadrant B | 3,992,882 | 529,619 |
| Events in quadrant C | 3,740,771 | 518,323 |
| Events in quadrant D | 10,381,117 | 411,404 |
| Mode SS | |||
|---|---|---|---|
| Quadrant | BADHDUFLAG | Total packets | Discarded packets |
| A | 0 | 158 | 0 |
| B | 0 | 158 | 0 |
| C | 0 | 158 | 0 |
| D | 0 | 158 | 0 |
| Mode M0 | |||
|---|---|---|---|
| Quadrant | BADHDUFLAG | Total packets | Discarded packets |
| A | 0 | 16373 | 2 |
| B | 0 | 16595 | 2 |
| C | 0 | 15946 | 2 |
| D | 0 | 36030 | 2 |
| Mode M9 | |||
|---|---|---|---|
| Quadrant | BADHDUFLAG | Total packets | Discarded packets |
| A | 0 | 12 | 0 |
| B | 0 | 12 | 0 |
| C | 0 | 12 | 0 |
| D | 0 | 12 | 0 |
| Quadrant | Total seconds | Saturated seconds | Saturation percentage |
|---|---|---|---|
| A | 7660 | 142 | 1.853786% |
| B | 7661 | 198 | 2.584519% |
| C | 7660 | 187 | 2.441253% |
| D | 7660 | 2618 | 34.177546% |
Noise dominated data is calculated using 1-second bins in cleaned event files. If a bin has >2000 counts, and if more than 50% of those come from <1% of pixels, then it is considered to be noise-dominated and hence unusable.
| Quadrant | # 1 sec bins | Bins with >0 counts | Bins with >2000 counts | High rate bins dominated by noise | Noise dominated (total time) | Noise dominated (detector-on time) | Marked lightcurve |
|---|---|---|---|---|---|---|---|
| A | 8850 | 7662 | 3 | 3 | 0.03% | 0.04% |  |
| B | 8851 | 7663 | 21 | 21 | 0.24% | 0.27% | 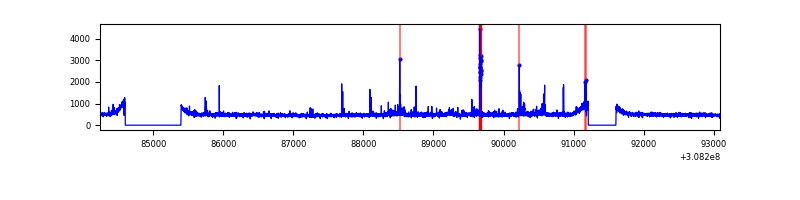 |
| C | 8850 | 7662 | 0 | 0 | 0.00% | 0.00% | 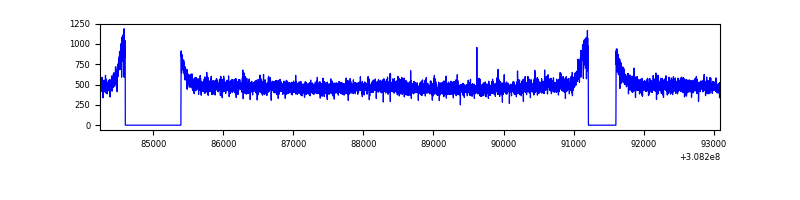 |
| D | 8850 | 7661 | 2171 | 2171 | 24.53% | 28.34% | 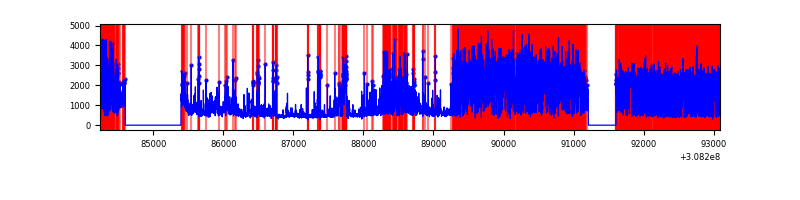 |
Top three noisy pixels from each quadrant. If the there are fewer than three noisy pixels in the level2.evt file, extra rows are filled as -1
| Pixel properties | Quadrant properties | ||||||
|---|---|---|---|---|---|---|---|
| Quadrant | DetID | PixID | Counts | Sigma | Mean | Median | Sigma |
| A | 14 | 235 | 170927 | 877.45 | 955 | 934 | 193.7 |
| A | 13 | 254 | 14460 | 69.82 | 955 | 934 | 193.7 |
| A | 0 | 226 | 8210 | 37.56 | 955 | 934 | 193.7 |
| B | 3 | 64 | 106229 | 566.54 | 958 | 933 | 185.9 |
| B | 0 | 190 | 40500 | 212.89 | 958 | 933 | 185.9 |
| B | 15 | 32 | 38113 | 200.04 | 958 | 933 | 185.9 |
| C | 14 | 238 | 140883 | 642.68 | 923 | 931 | 217.8 |
| C | 13 | 61 | 6435 | 25.28 | 923 | 931 | 217.8 |
| C | 4 | 223 | 2971 | 9.37 | 923 | 931 | 217.8 |
| D | 7 | 238 | 5190865 | 25927.97 | 824 | 801 | 200.2 |
| D | 1 | 52 | 1818835 | 9082.34 | 824 | 801 | 200.2 |
| D | 13 | 153 | 103986 | 515.48 | 824 | 801 | 200.2 |
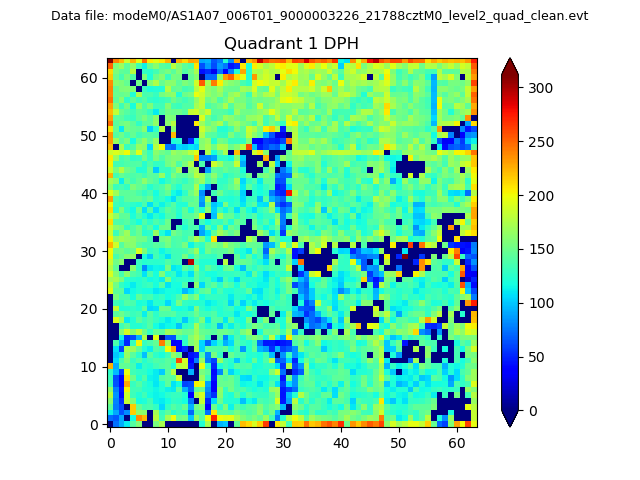
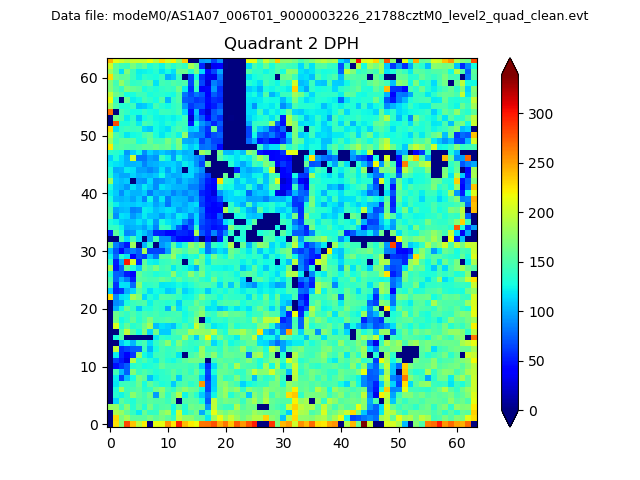
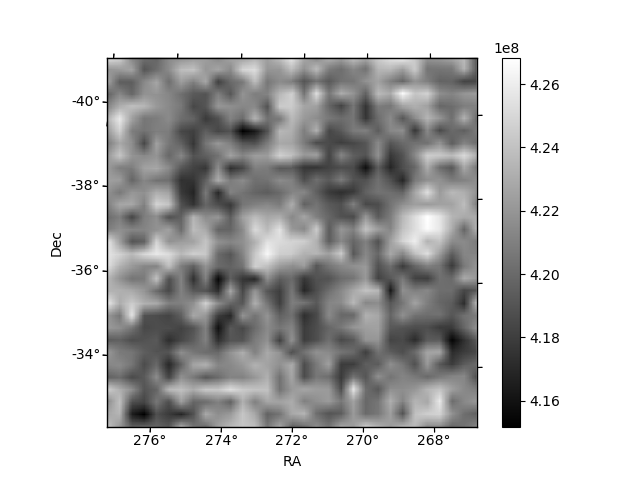
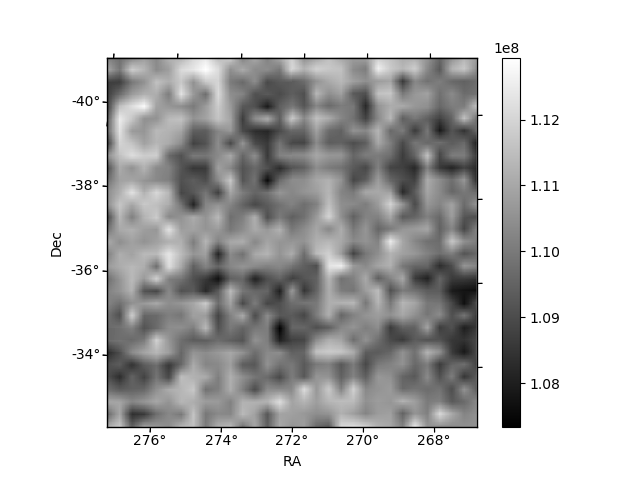
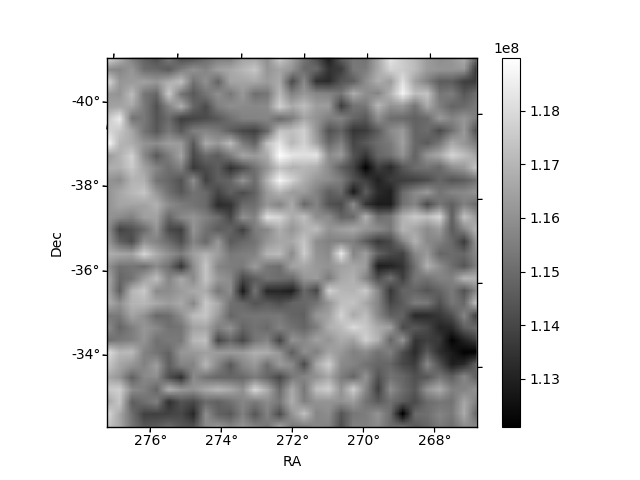
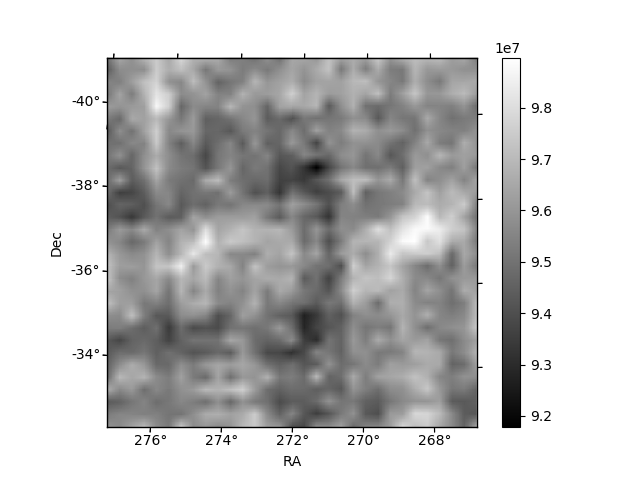
Histogram calculated using DETX and DETY for each event in the final _common_clean file
| Quadrant A | 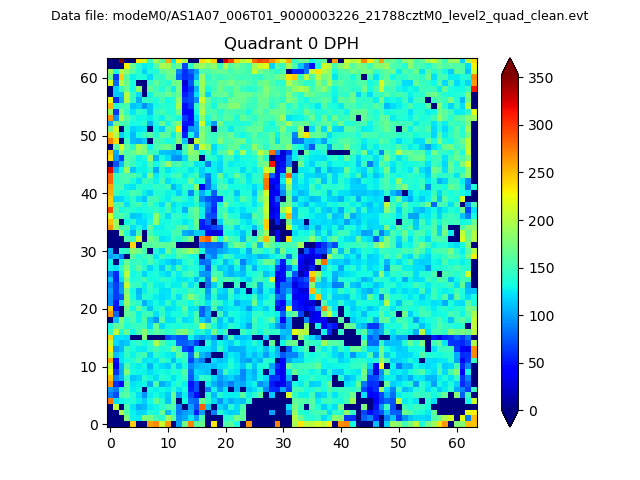 |
 |
Quadrant B |
|---|---|---|---|
| Quadrant D | 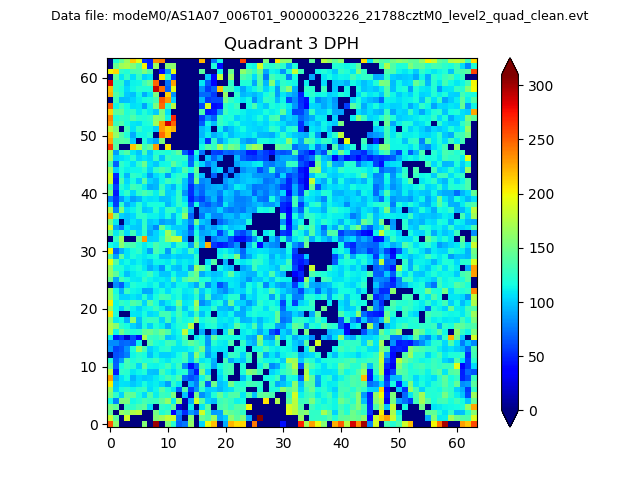 |
 |
Quadrant C |
| Plot type | Count rate plots | Images |
|---|---|---|
| Comparison with Poisson distribution Blue bars denote a histogram of data divided into 1 sec bins. Red curve is a Poisson curve with rate = median count rate of data. |
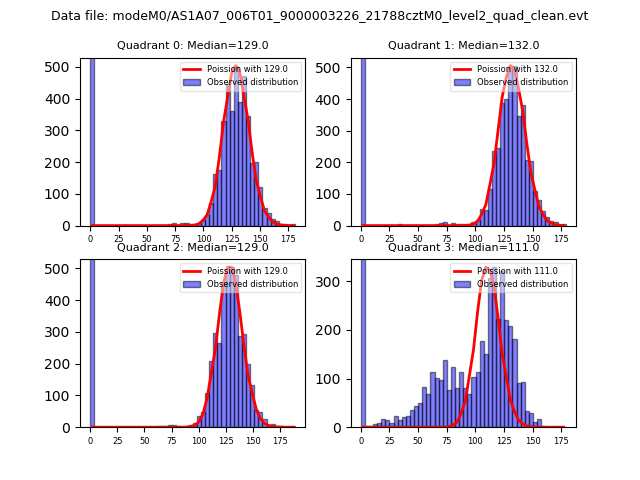 |
 |
| Quadrant-wise count rates Data is divided into 100 sec bins |
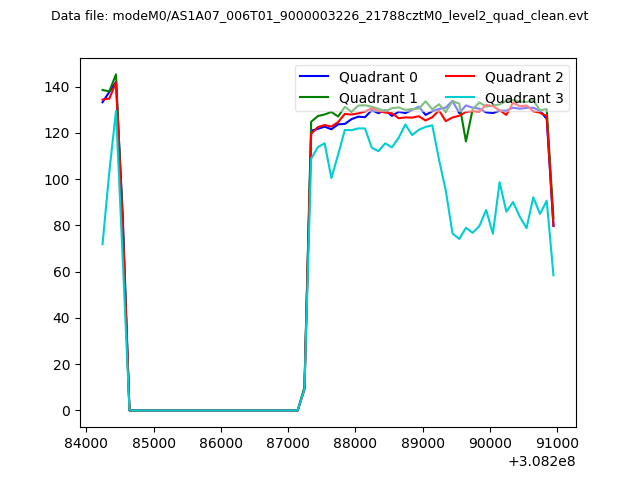 |
|
| Module-wise count rates for Quadrant A Data is divided into 100 sec bins |
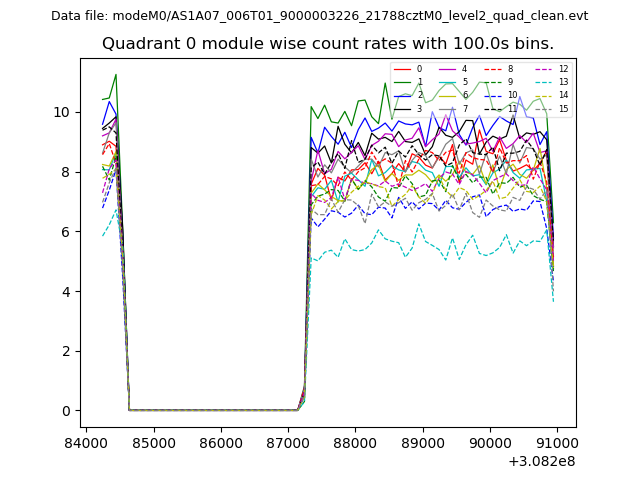 |
 |
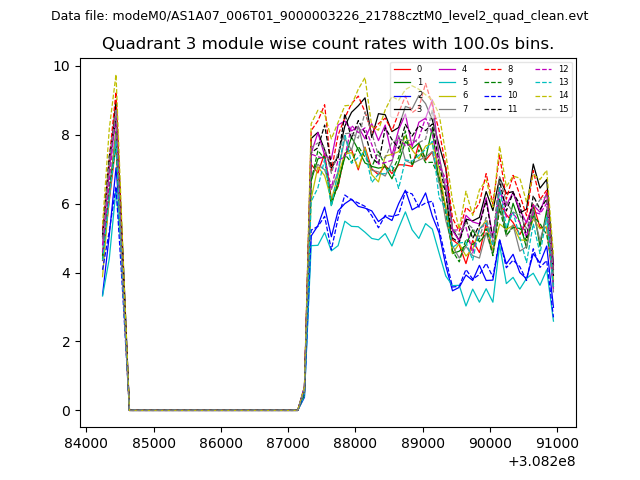
| Module-wise count rates for Quadrant B Data is divided into 100 sec bins |
 |
 |
| Module-wise count rates for Quadrant C Data is divided into 100 sec bins |
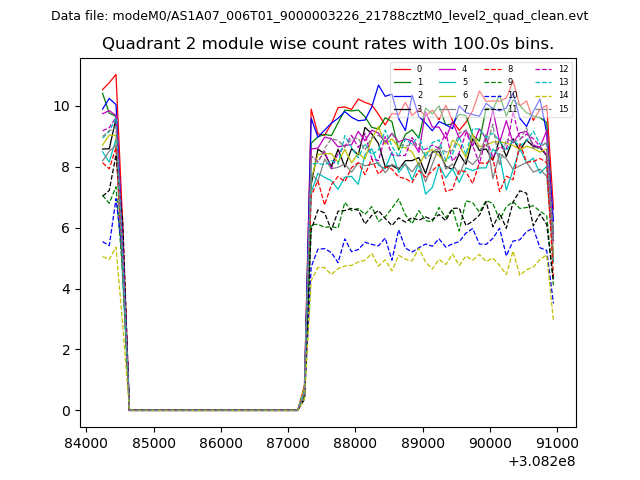 |
 |
| Module-wise count rates for Quadrant D Data is divided into 100 sec bins |
 |
 |
| Parameter | Plot |
|---|---|
| CZT HV Monitor |  |
| D_VDD | 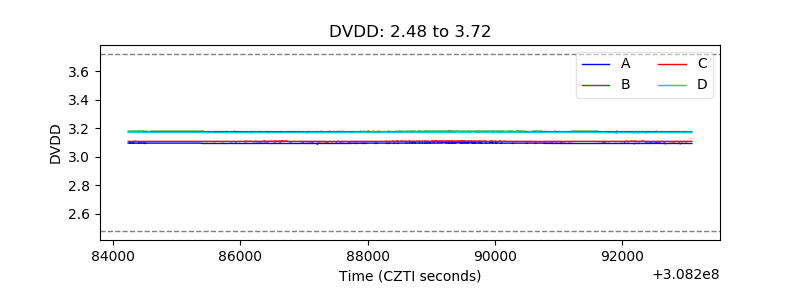 |
| Temperature 1 | 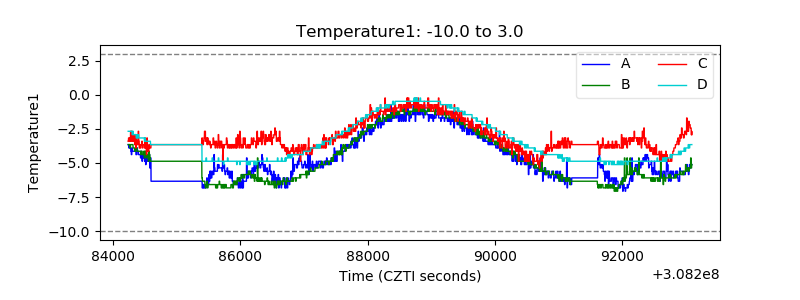 |
| Veto HV Monitor | 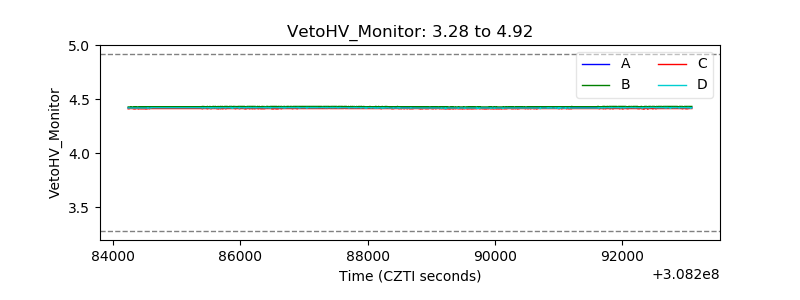 |
| Veto LLD | 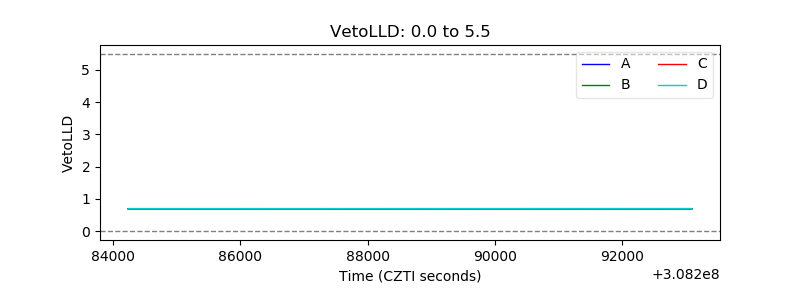 |
| Alpha Counter |  |
| _CPM_Rate | 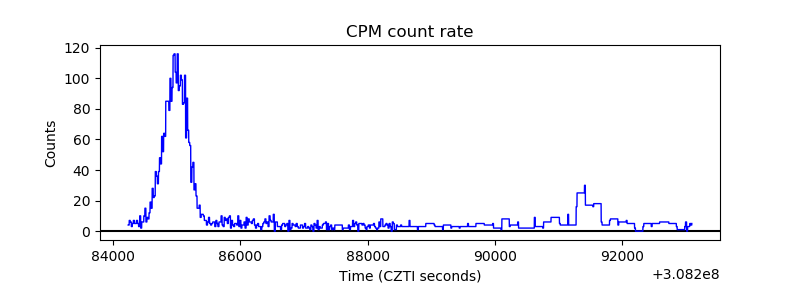 |
| CZT Counter | 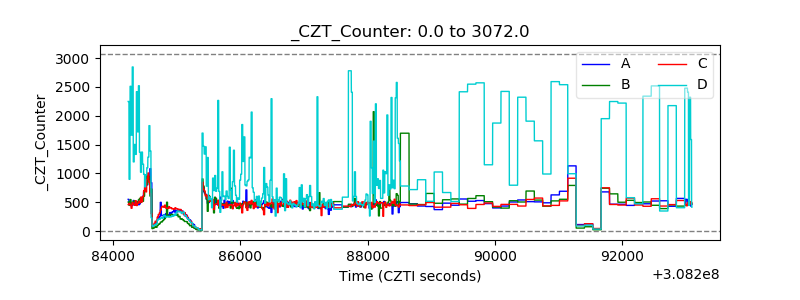 |
| +2.5 Volts monitor | 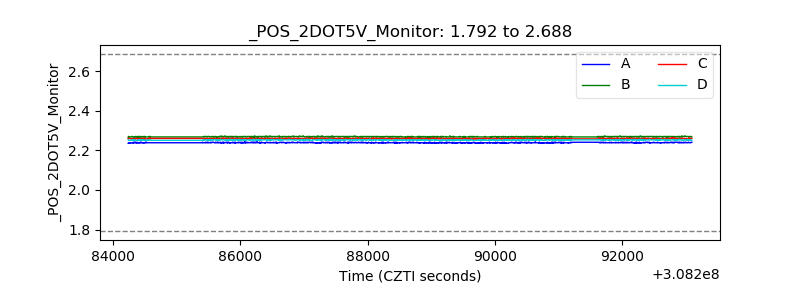 |
| +5 Volts monitor | 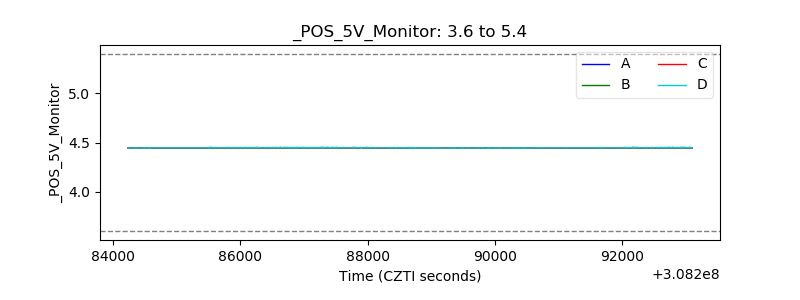 |
| _ROLL_ROT | 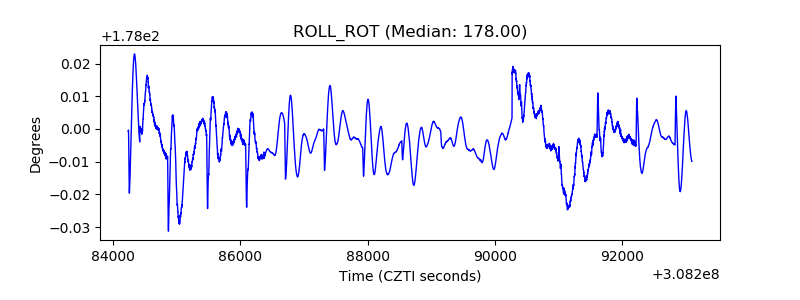 |
| _Roll_DEC | 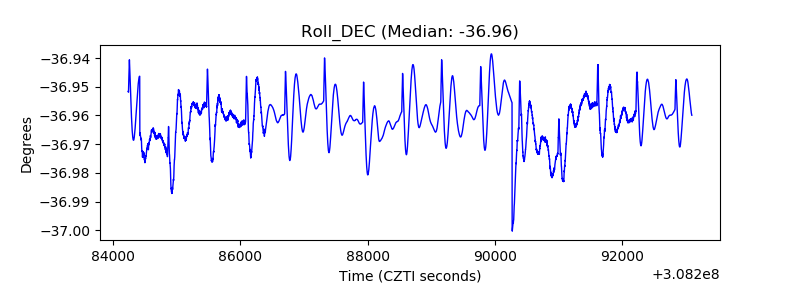 |
| _Roll_RA | 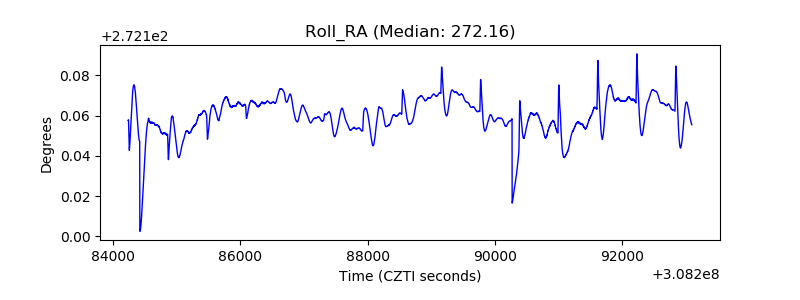 |
| Veto Counter | 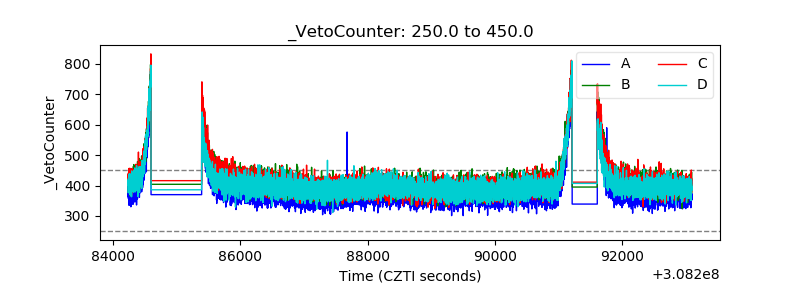 |