| Param | Original file | Final file |
|---|---|---|
| Filename | modeM0/AS1A07_006T01_9000003226_21789cztM0_level2.evt | modeM0/AS1A07_006T01_9000003226_21789cztM0_level2_quad_clean.evt |
| Size (bytes) | 757,889,280 | 81,630,720 |
| Size | 722.8 MB | 77.8 MB |
| Events in quadrant A | 3,734,781 | 516,193 |
| Events in quadrant B | 3,693,982 | 527,519 |
| Events in quadrant C | 3,511,526 | 513,592 |
| Events in quadrant D | 11,514,961 | 402,537 |
| Mode SS | |||
|---|---|---|---|
| Quadrant | BADHDUFLAG | Total packets | Discarded packets |
| A | 0 | 148 | 0 |
| B | 0 | 148 | 0 |
| C | 0 | 148 | 0 |
| D | 0 | 148 | 0 |
| Mode M0 | |||
|---|---|---|---|
| Quadrant | BADHDUFLAG | Total packets | Discarded packets |
| A | 0 | 15665 | 1 |
| B | 0 | 15477 | 1 |
| C | 0 | 15105 | 1 |
| D | 0 | 39206 | 1 |
| Mode M9 | |||
|---|---|---|---|
| Quadrant | BADHDUFLAG | Total packets | Discarded packets |
| A | 0 | 2 | 0 |
| B | 0 | 2 | 0 |
| C | 0 | 2 | 0 |
| D | 0 | 2 | 0 |
| Quadrant | Total seconds | Saturated seconds | Saturation percentage |
|---|---|---|---|
| A | 7345 | 211 | 2.872703% |
| B | 7346 | 234 | 3.185407% |
| C | 7346 | 261 | 3.552954% |
| D | 7346 | 3313 | 45.099374% |
Noise dominated data is calculated using 1-second bins in cleaned event files. If a bin has >2000 counts, and if more than 50% of those come from <1% of pixels, then it is considered to be noise-dominated and hence unusable.
| Quadrant | # 1 sec bins | Bins with >0 counts | Bins with >2000 counts | High rate bins dominated by noise | Noise dominated (total time) | Noise dominated (detector-on time) | Marked lightcurve |
|---|---|---|---|---|---|---|---|
| A | 7515 | 7346 | 3 | 3 | 0.04% | 0.04% | 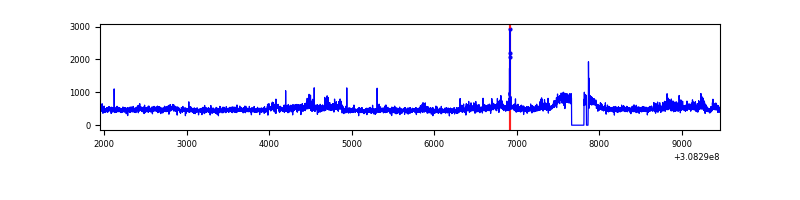 |
| B | 7516 | 7348 | 5 | 5 | 0.07% | 0.07% | 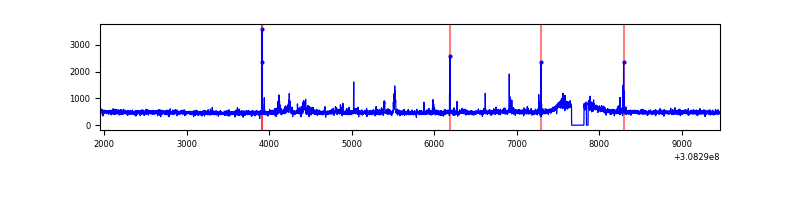 |
| C | 7516 | 7348 | 0 | 0 | 0.00% | 0.00% | 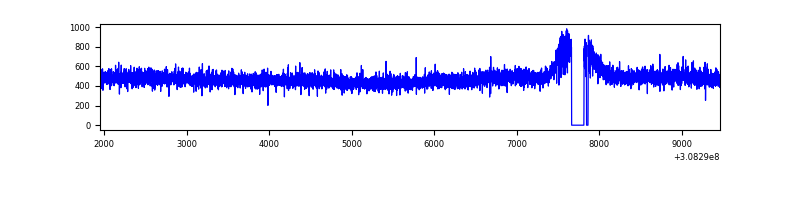 |
| D | 7516 | 7346 | 2786 | 2786 | 37.07% | 37.93% | 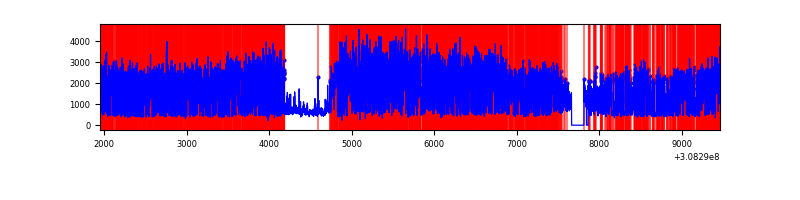 |
Top three noisy pixels from each quadrant. If the there are fewer than three noisy pixels in the level2.evt file, extra rows are filled as -1
| Pixel properties | Quadrant properties | ||||||
|---|---|---|---|---|---|---|---|
| Quadrant | DetID | PixID | Counts | Sigma | Mean | Median | Sigma |
| A | 14 | 235 | 182994 | 1000.08 | 900 | 880 | 182.1 |
| A | 13 | 252 | 58722 | 317.64 | 900 | 880 | 182.1 |
| A | 5 | 16 | 14256 | 73.45 | 900 | 880 | 182.1 |
| B | 3 | 64 | 47051 | 264.54 | 901 | 874 | 174.6 |
| B | 0 | 190 | 46055 | 258.83 | 901 | 874 | 174.6 |
| B | 0 | 219 | 34595 | 193.18 | 901 | 874 | 174.6 |
| C | 14 | 238 | 134025 | 650.32 | 866 | 869 | 204.8 |
| C | 13 | 61 | 6061 | 25.36 | 866 | 869 | 204.8 |
| C | 15 | 78 | 2067 | 5.85 | 866 | 869 | 204.8 |
| D | 7 | 238 | 7883495 | 41594.95 | 775 | 751 | 189.5 |
| D | 1 | 52 | 491884 | 2591.57 | 775 | 751 | 189.5 |
| D | 13 | 153 | 97632 | 511.21 | 775 | 751 | 189.5 |
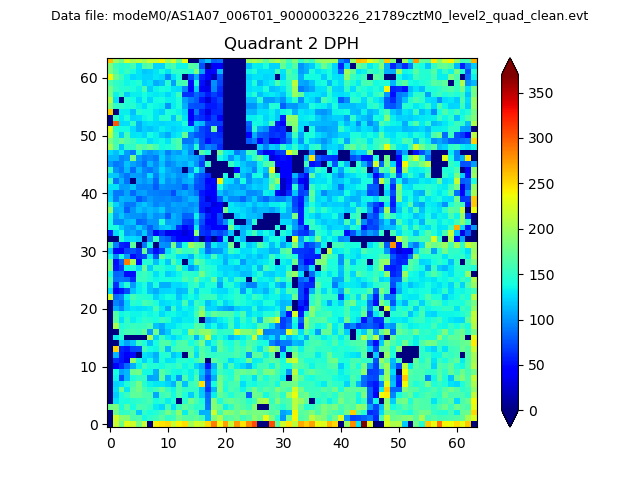
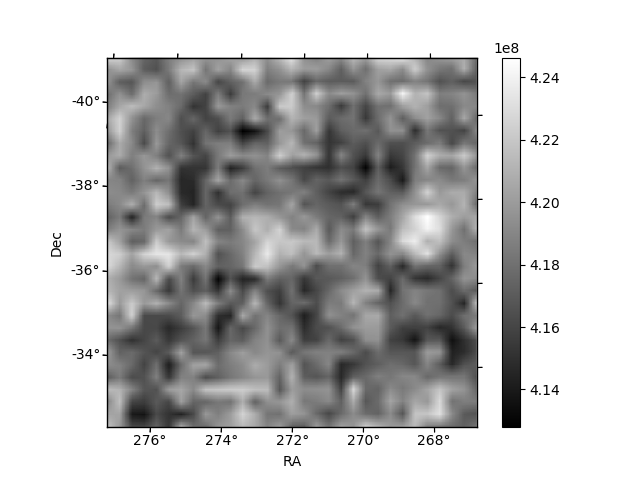
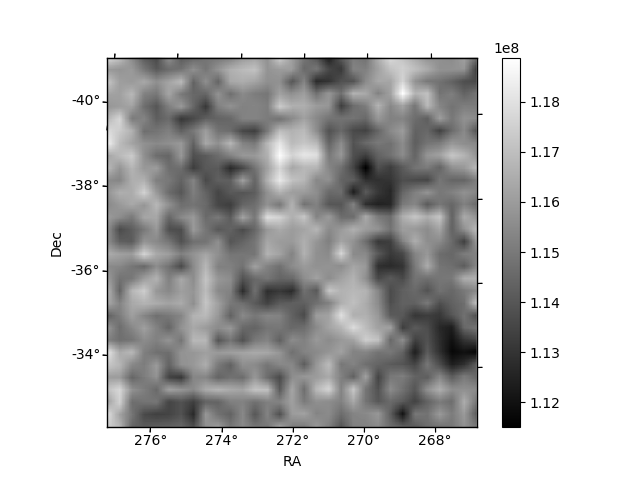
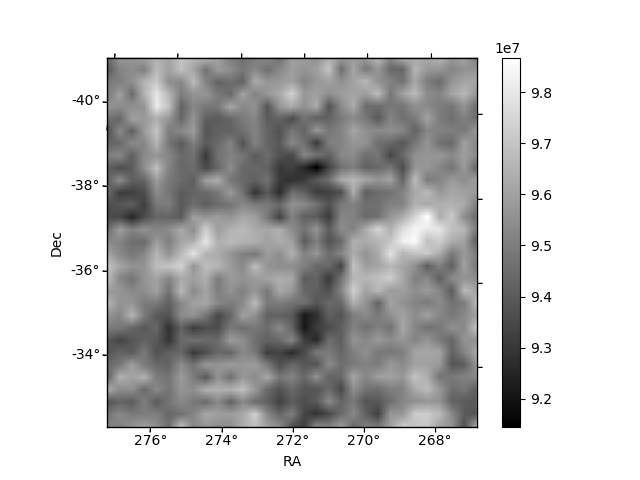
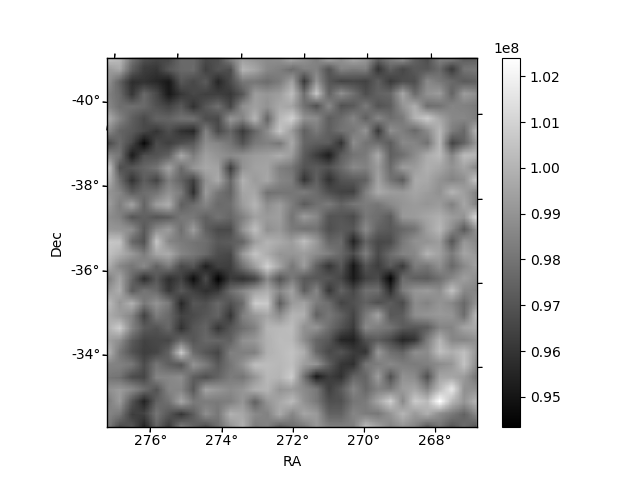
Histogram calculated using DETX and DETY for each event in the final _common_clean file
| Quadrant A | 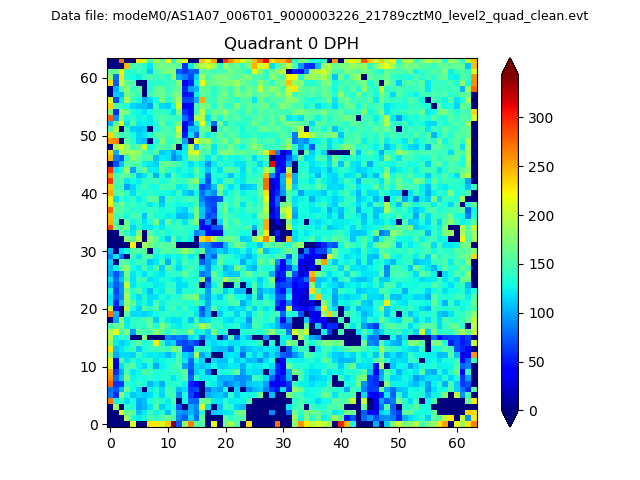 |
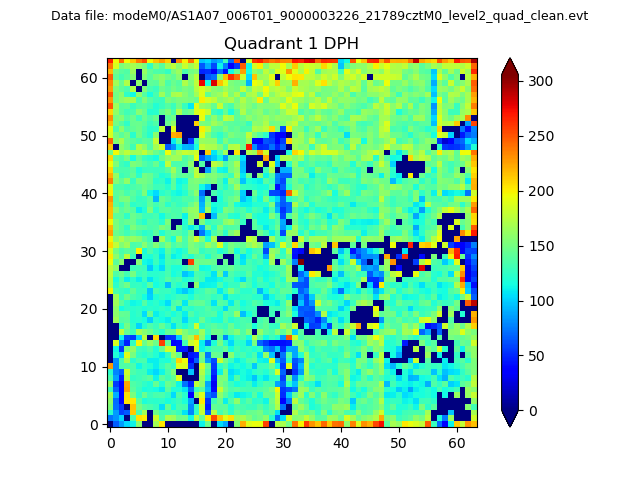 |
Quadrant B |
|---|---|---|---|
| Quadrant D | 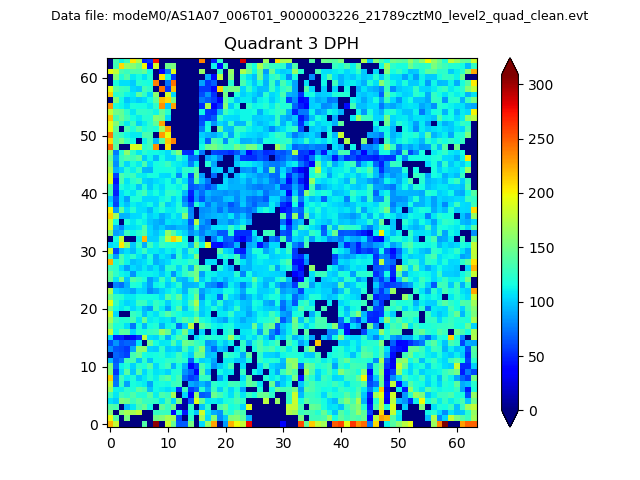 |
 |
Quadrant C |
| Plot type | Count rate plots | Images |
|---|---|---|
| Comparison with Poisson distribution Blue bars denote a histogram of data divided into 1 sec bins. Red curve is a Poisson curve with rate = median count rate of data. |
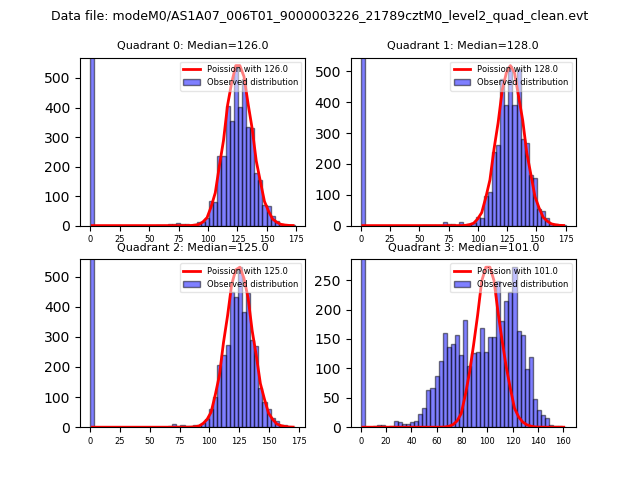 |
 |
| Quadrant-wise count rates Data is divided into 100 sec bins |
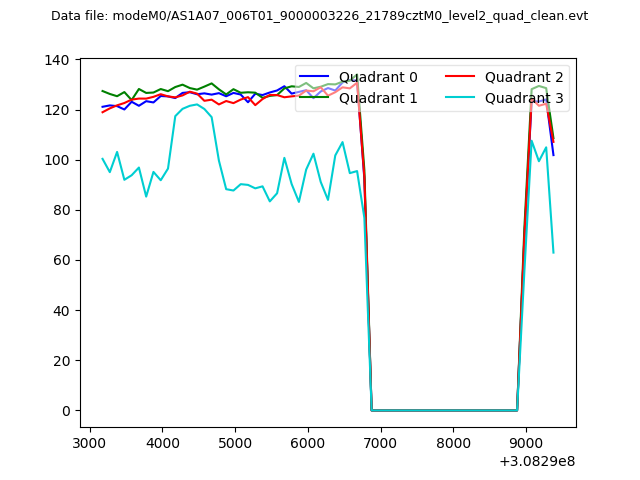 |
|
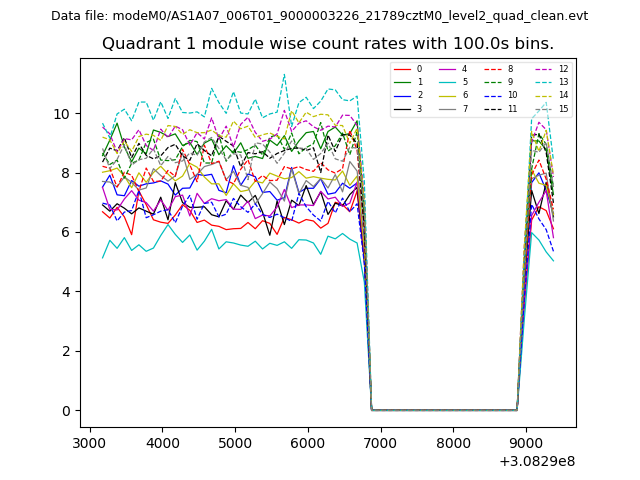
| Module-wise count rates for Quadrant A Data is divided into 100 sec bins |
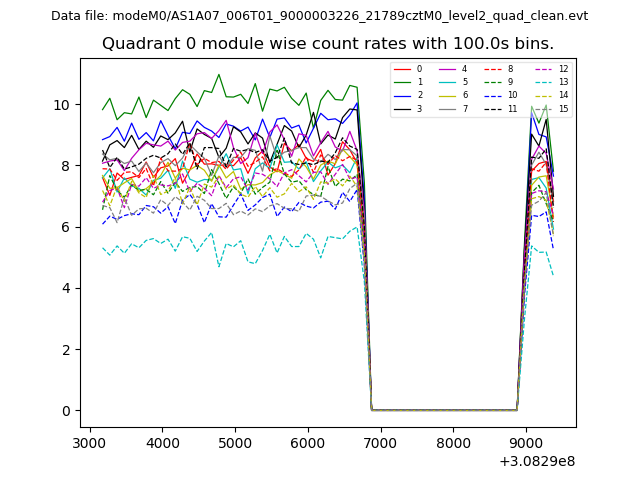 |
 |
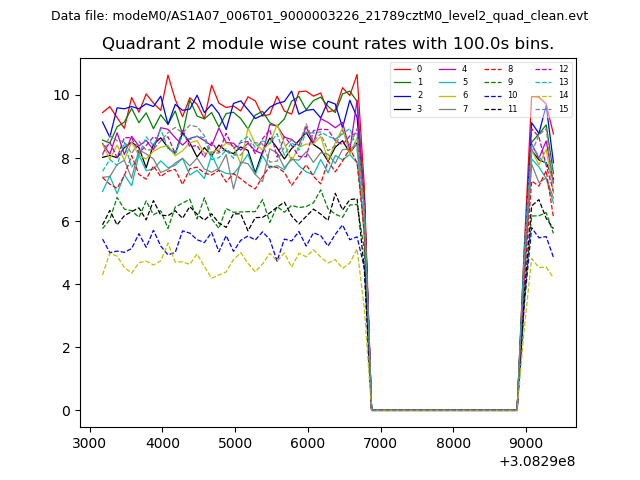
| Module-wise count rates for Quadrant B Data is divided into 100 sec bins |
 |
 |
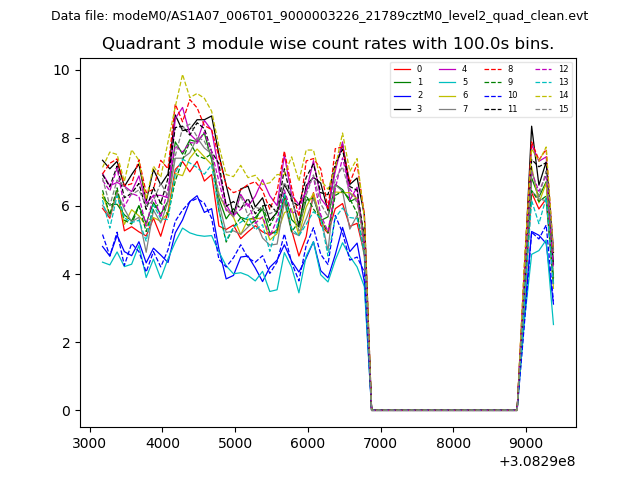
| Module-wise count rates for Quadrant C Data is divided into 100 sec bins |
 |
 |
| Module-wise count rates for Quadrant D Data is divided into 100 sec bins |
 |
 |
| Parameter | Plot |
|---|---|
| CZT HV Monitor | 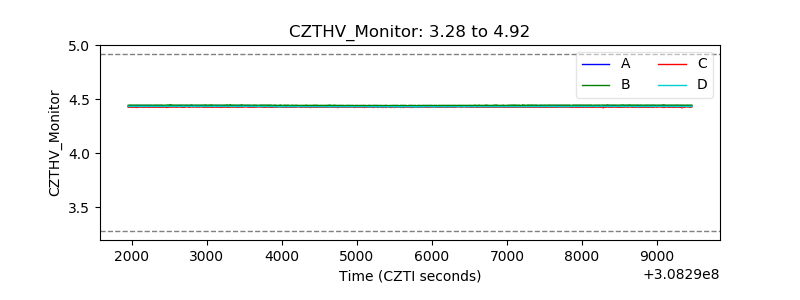 |
| D_VDD | 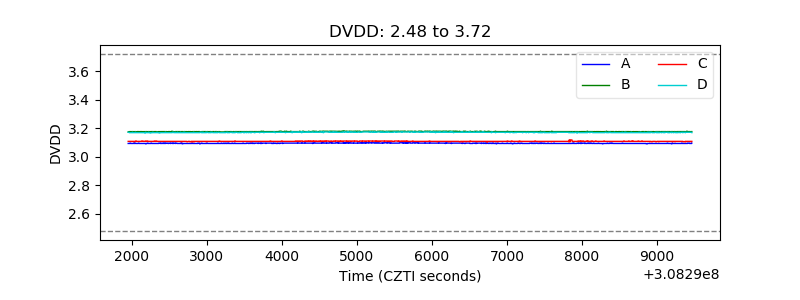 |
| Temperature 1 | 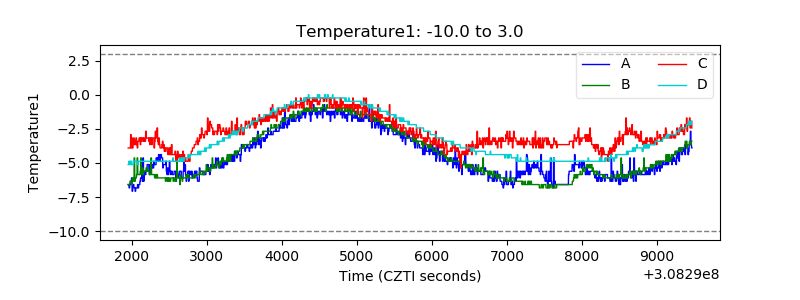 |
| Veto HV Monitor |  |
| Veto LLD | 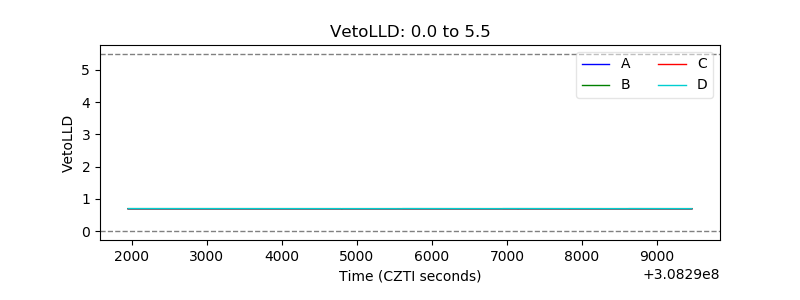 |
| Alpha Counter | 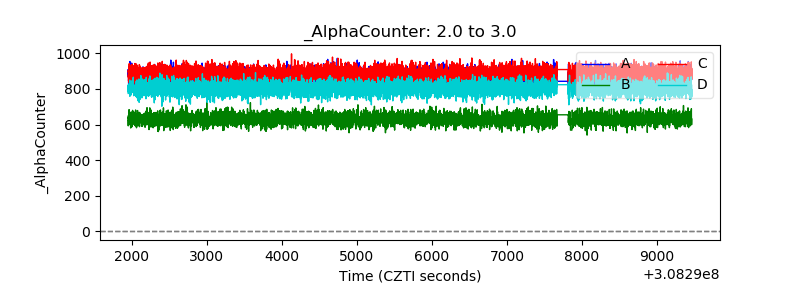 |
| _CPM_Rate | 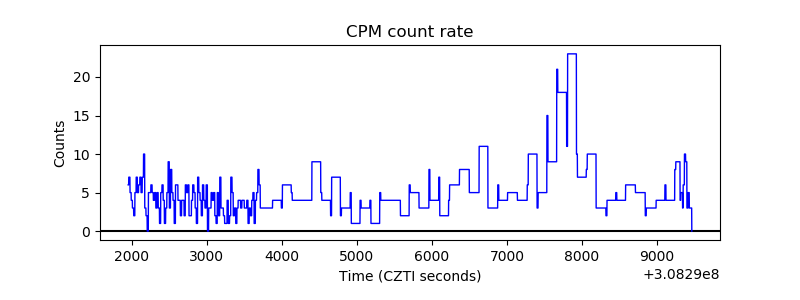 |
| CZT Counter | 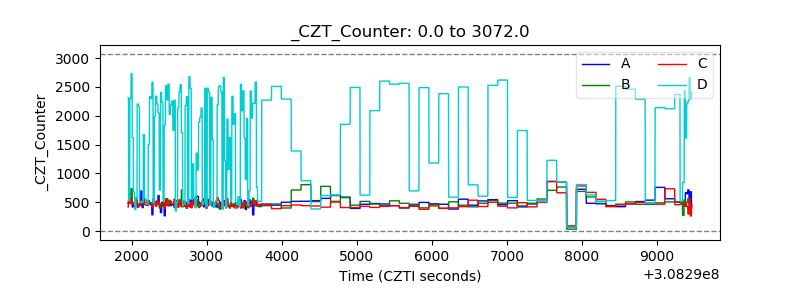 |
| +2.5 Volts monitor |  |
| +5 Volts monitor |  |
| _ROLL_ROT | 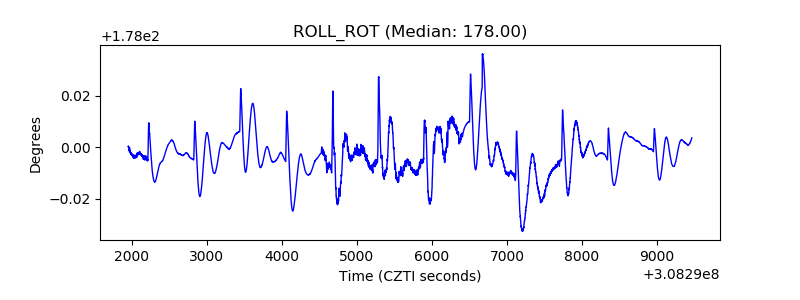 |
| _Roll_DEC | 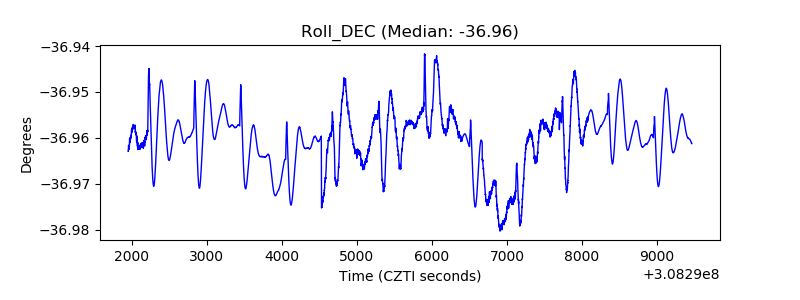 |
| _Roll_RA | 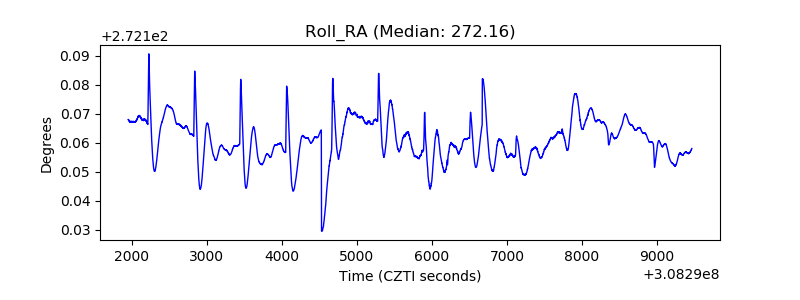 |
| Veto Counter | 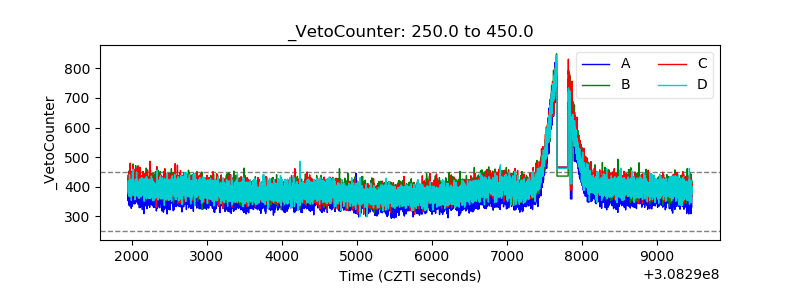 |