| Param | Original file | Final file |
|---|---|---|
| Filename | modeM0/AS1A07_006T01_9000003226_21790cztM0_level2.evt | modeM0/AS1A07_006T01_9000003226_21790cztM0_level2_quad_clean.evt |
| Size (bytes) | 827,812,800 | 89,904,960 |
| Size | 789.5 MB | 85.7 MB |
| Events in quadrant A | 3,973,296 | 579,016 |
| Events in quadrant B | 4,065,831 | 590,725 |
| Events in quadrant C | 3,799,846 | 576,508 |
| Events in quadrant D | 12,701,964 | 431,474 |
| Mode SS | |||
|---|---|---|---|
| Quadrant | BADHDUFLAG | Total packets | Discarded packets |
| A | 0 | 160 | 2 |
| B | 0 | 160 | 0 |
| C | 0 | 160 | 0 |
| D | 0 | 160 | 0 |
| Mode M0 | |||
|---|---|---|---|
| Quadrant | BADHDUFLAG | Total packets | Discarded packets |
| A | 0 | 16642 | 59 |
| B | 0 | 16943 | 42 |
| C | 0 | 16298 | 69 |
| D | 0 | 43231 | 111 |
| Mode M9 | |||
|---|---|---|---|
| Quadrant | BADHDUFLAG | Total packets | Discarded packets |
| A | 0 | 5 | 0 |
| B | 0 | 5 | 0 |
| C | 0 | 5 | 0 |
| D | 0 | 5 | 0 |
| Quadrant | Total seconds | Saturated seconds | Saturation percentage |
|---|---|---|---|
| A | 7823 | 311 | 3.975457% |
| B | 7828 | 371 | 4.739397% |
| C | 7820 | 381 | 4.872123% |
| D | 7818 | 3797 | 48.567409% |
Noise dominated data is calculated using 1-second bins in cleaned event files. If a bin has >2000 counts, and if more than 50% of those come from <1% of pixels, then it is considered to be noise-dominated and hence unusable.
| Quadrant | # 1 sec bins | Bins with >0 counts | Bins with >2000 counts | High rate bins dominated by noise | Noise dominated (total time) | Noise dominated (detector-on time) | Marked lightcurve |
|---|---|---|---|---|---|---|---|
| A | 8367 | 7835 | 0 | 0 | 0.00% | 0.00% | 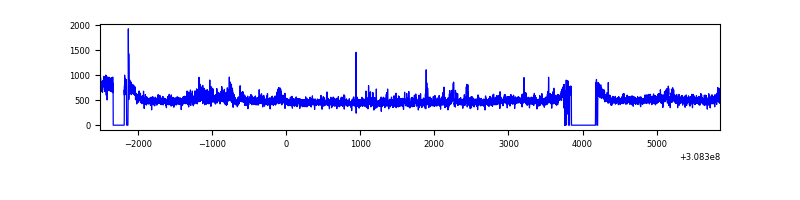 |
| B | 8366 | 7842 | 12 | 12 | 0.14% | 0.15% | 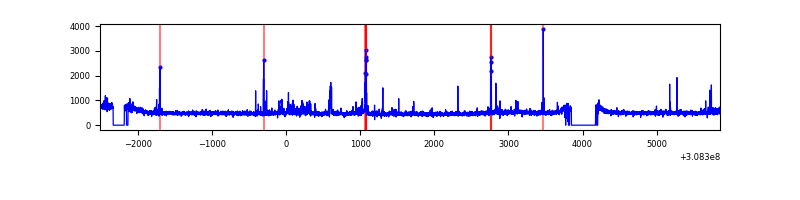 |
| C | 8367 | 7836 | 0 | 0 | 0.00% | 0.00% | 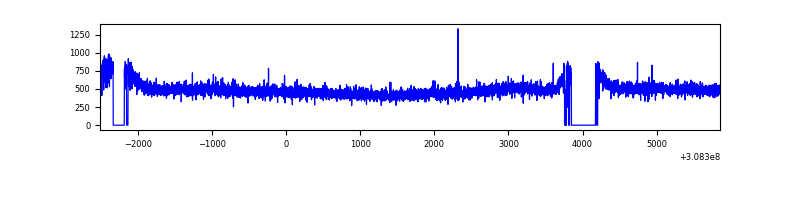 |
| D | 8367 | 7825 | 3014 | 3014 | 36.02% | 38.52% | 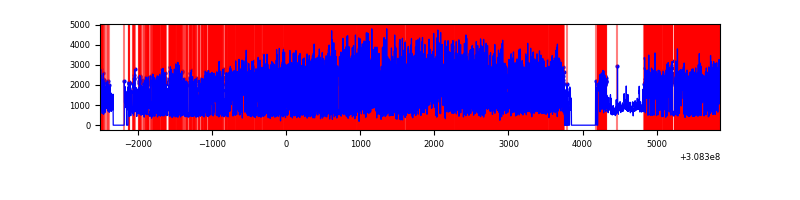 |
Top three noisy pixels from each quadrant. If the there are fewer than three noisy pixels in the level2.evt file, extra rows are filled as -1
| Pixel properties | Quadrant properties | ||||||
|---|---|---|---|---|---|---|---|
| Quadrant | DetID | PixID | Counts | Sigma | Mean | Median | Sigma |
| A | 13 | 252 | 110181 | 553.9 | 973 | 951 | 197.2 |
| A | 14 | 235 | 99981 | 502.18 | 973 | 951 | 197.2 |
| A | 13 | 254 | 14096 | 66.66 | 973 | 951 | 197.2 |
| B | 3 | 64 | 104460 | 551.28 | 972 | 945 | 187.8 |
| B | 0 | 190 | 61529 | 322.65 | 972 | 945 | 187.8 |
| B | 0 | 197 | 33727 | 174.58 | 972 | 945 | 187.8 |
| C | 14 | 238 | 145556 | 654.28 | 937 | 941 | 221.0 |
| C | 13 | 61 | 6442 | 24.89 | 937 | 941 | 221.0 |
| C | 15 | 78 | 2235 | 5.85 | 937 | 941 | 221.0 |
| D | 7 | 238 | 8749115 | 44754.52 | 805 | 781 | 195.5 |
| D | 1 | 52 | 333815 | 1703.73 | 805 | 781 | 195.5 |
| D | 7 | 223 | 252878 | 1289.67 | 805 | 781 | 195.5 |
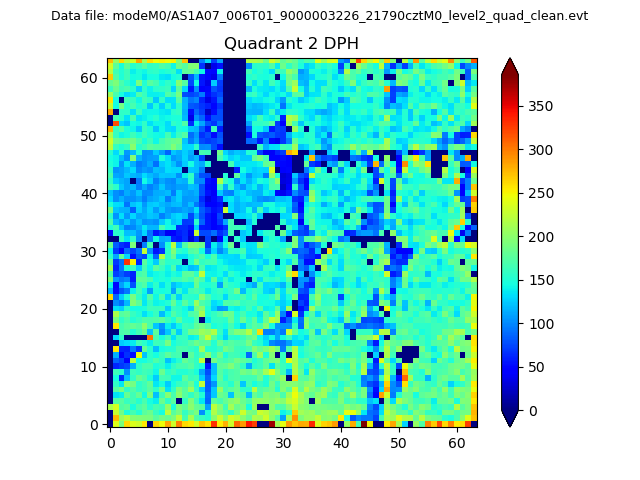
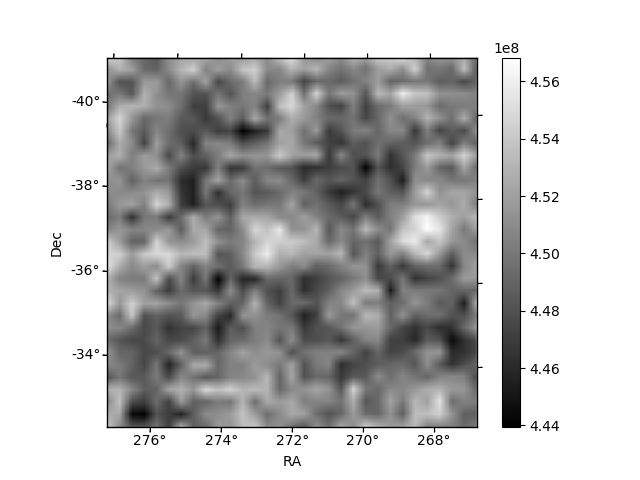
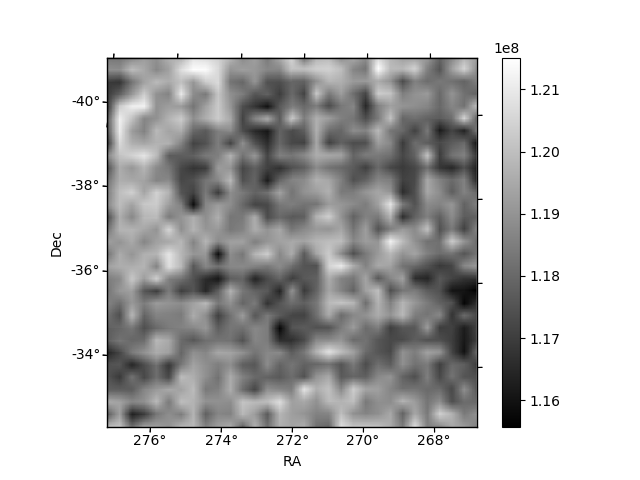
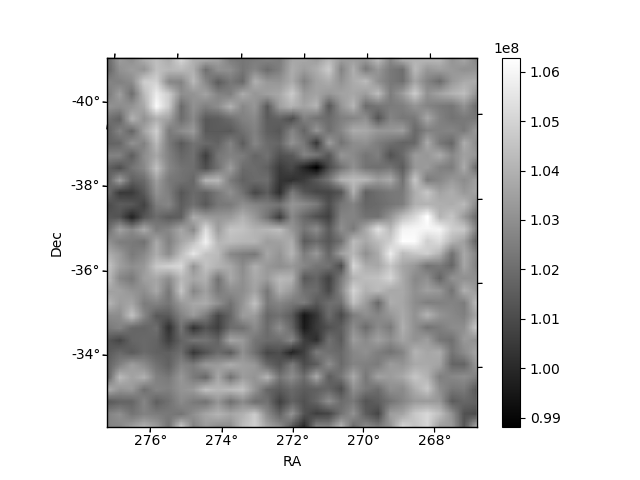
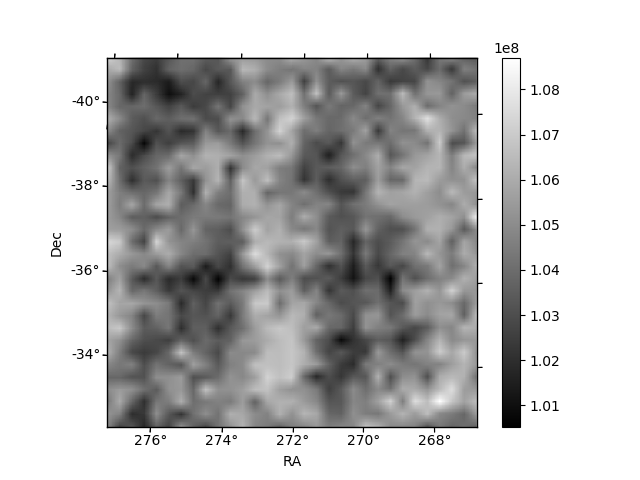
Histogram calculated using DETX and DETY for each event in the final _common_clean file
| Quadrant A | 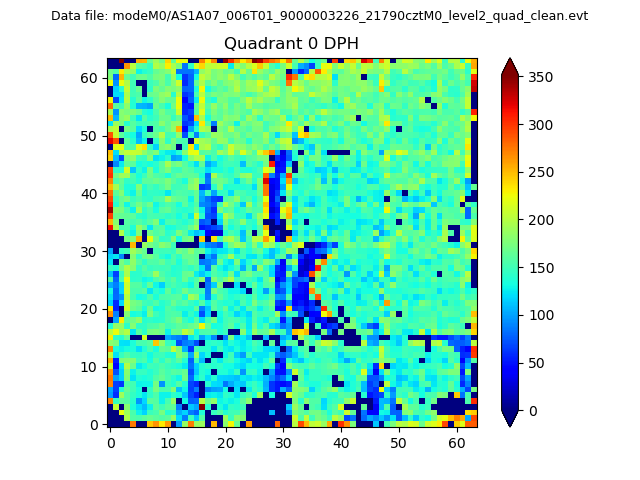 |
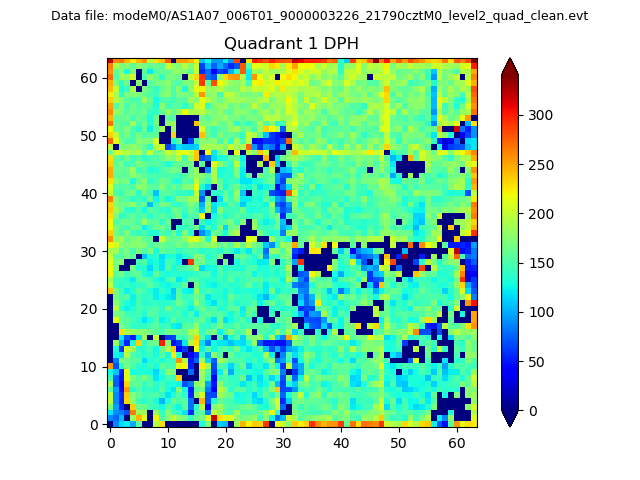 |
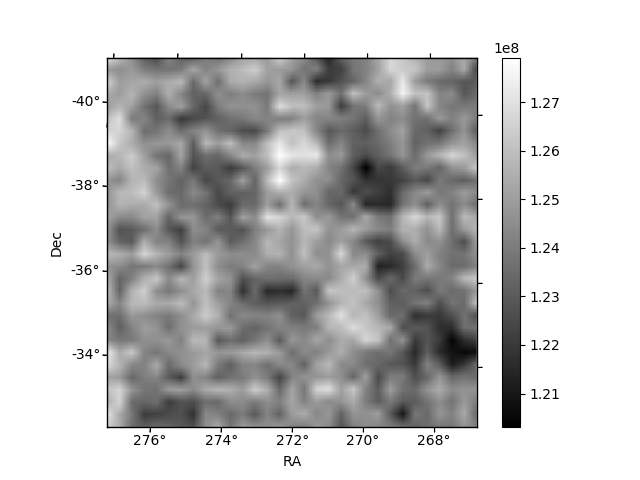
Quadrant B |
|---|---|---|---|
| Quadrant D | 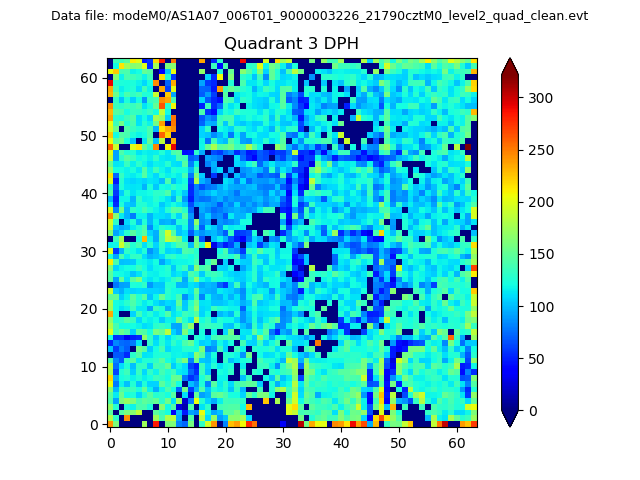 |
 |
Quadrant C |
| Plot type | Count rate plots | Images |
|---|---|---|
| Comparison with Poisson distribution Blue bars denote a histogram of data divided into 1 sec bins. Red curve is a Poisson curve with rate = median count rate of data. |
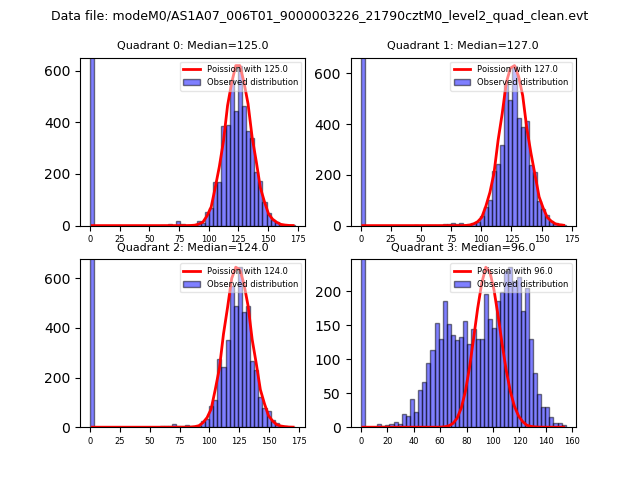 |
 |
| Quadrant-wise count rates Data is divided into 100 sec bins |
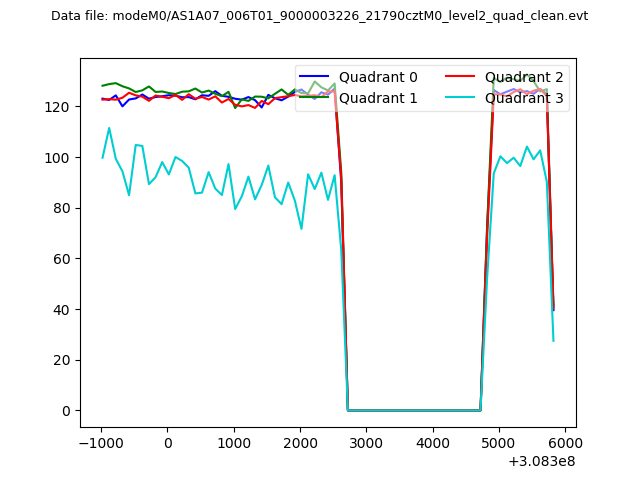 |
|
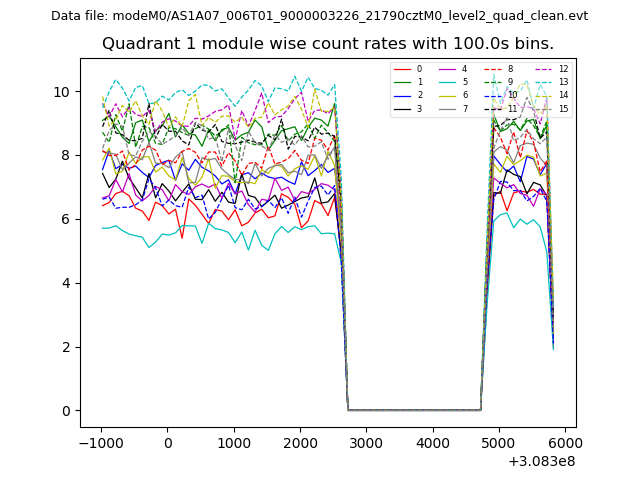
| Module-wise count rates for Quadrant A Data is divided into 100 sec bins |
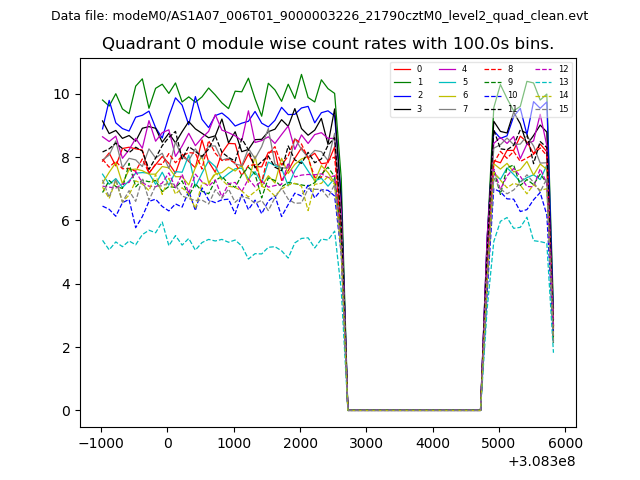 |
 |
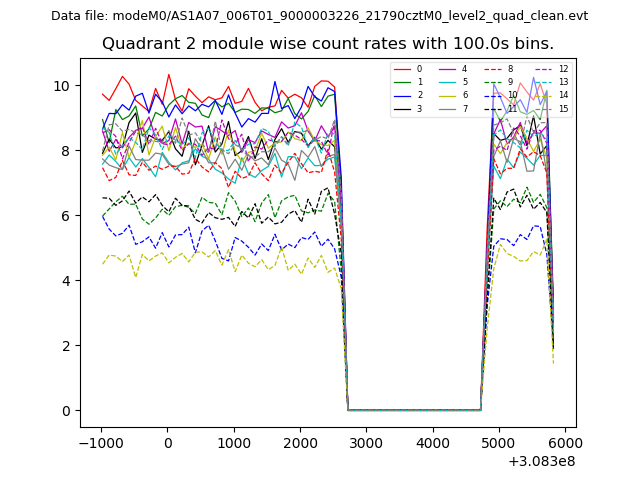
| Module-wise count rates for Quadrant B Data is divided into 100 sec bins |
 |
 |
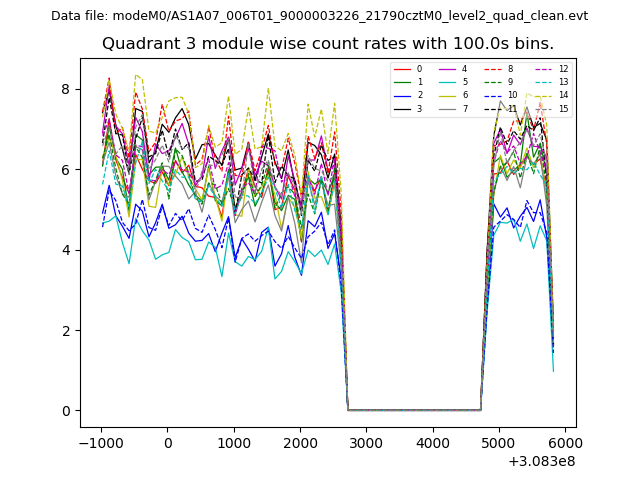
| Module-wise count rates for Quadrant C Data is divided into 100 sec bins |
 |
 |
| Module-wise count rates for Quadrant D Data is divided into 100 sec bins |
 |
 |
| Parameter | Plot |
|---|---|
| CZT HV Monitor | 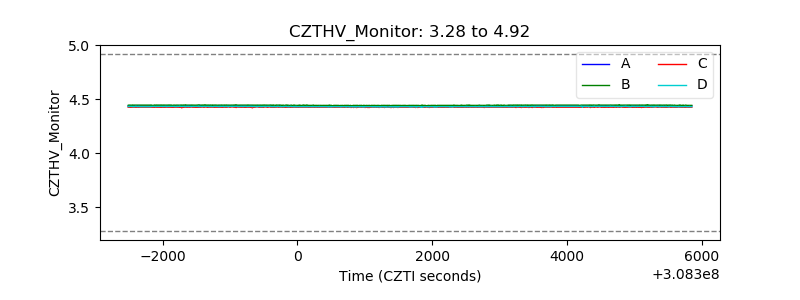 |
| D_VDD | 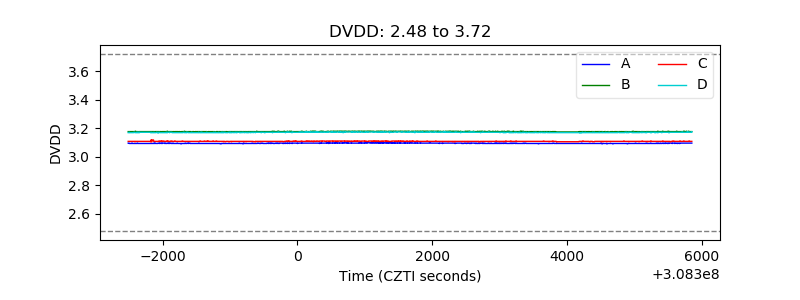 |
| Temperature 1 | 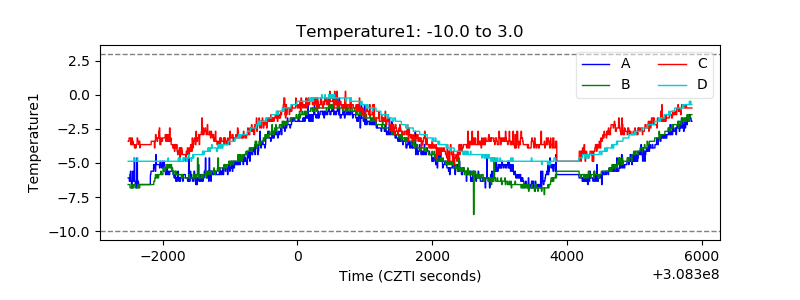 |
| Veto HV Monitor |  |
| Veto LLD | 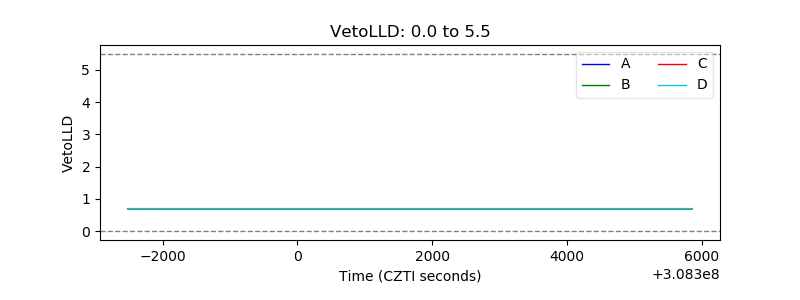 |
| Alpha Counter | 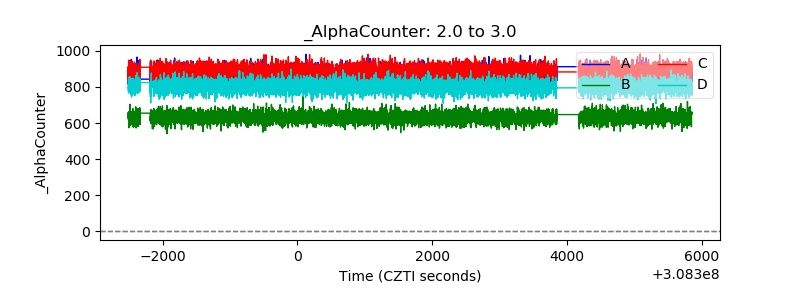 |
| _CPM_Rate | 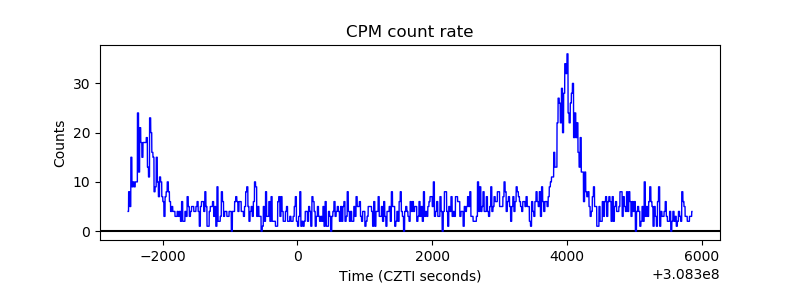 |
| CZT Counter | 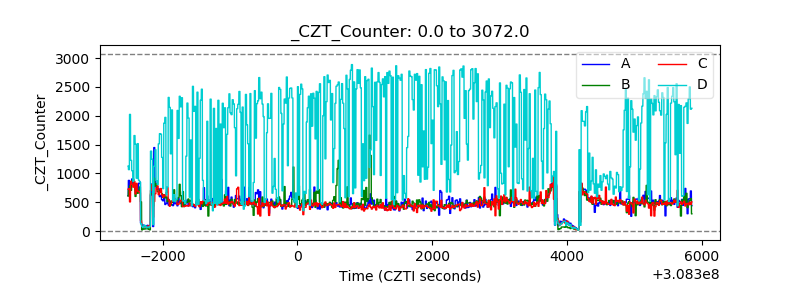 |
| +2.5 Volts monitor |  |
| +5 Volts monitor |  |
| _ROLL_ROT | 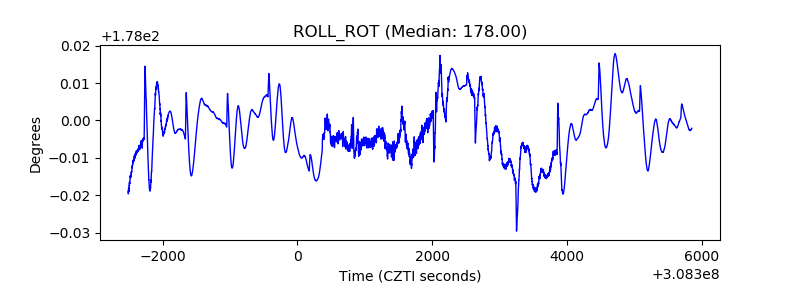 |
| _Roll_DEC | 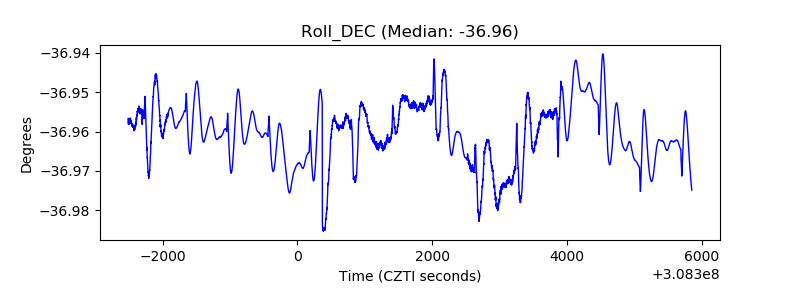 |
| _Roll_RA | 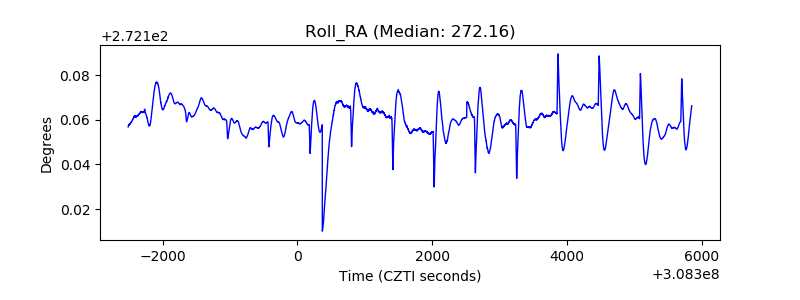 |
| Veto Counter | 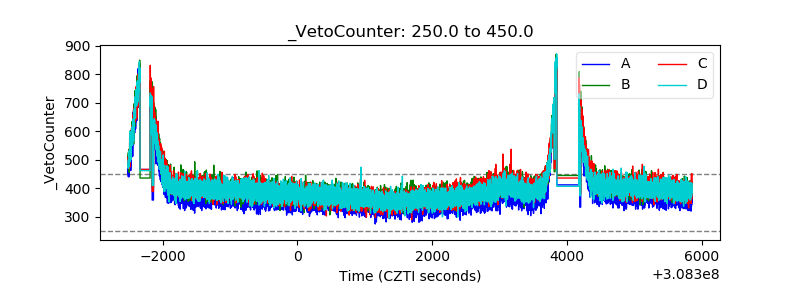 |