| Param | Original file | Final file |
|---|---|---|
| Filename | modeM0/AS1A07_006T01_9000003226_21793cztM0_level2.evt | modeM0/AS1A07_006T01_9000003226_21793cztM0_level2_quad_clean.evt |
| Size (bytes) | 563,690,880 | 76,976,640 |
| Size | 537.6 MB | 73.4 MB |
| Events in quadrant A | 2,881,100 | 510,223 |
| Events in quadrant B | 3,018,882 | 515,428 |
| Events in quadrant C | 2,782,982 | 499,911 |
| Events in quadrant D | 7,982,434 | 386,672 |
| Mode SS | |||
|---|---|---|---|
| Quadrant | BADHDUFLAG | Total packets | Discarded packets |
| A | 0 | 122 | 0 |
| B | 0 | 122 | 0 |
| C | 0 | 122 | 0 |
| D | 0 | 122 | 0 |
| Mode M0 | |||
|---|---|---|---|
| Quadrant | BADHDUFLAG | Total packets | Discarded packets |
| A | 0 | 12644 | 1 |
| B | 0 | 12806 | 1 |
| C | 0 | 12238 | 1 |
| D | 0 | 27739 | 1 |
| Mode M9 | |||
|---|---|---|---|
| Quadrant | BADHDUFLAG | Total packets | Discarded packets |
| A | 0 | 9 | 0 |
| B | 0 | 9 | 0 |
| C | 0 | 9 | 0 |
| D | 0 | 9 | 0 |
| Quadrant | Total seconds | Saturated seconds | Saturation percentage |
|---|---|---|---|
| A | 5981 | 28 | 0.468149% |
| B | 5982 | 44 | 0.735540% |
| C | 5982 | 46 | 0.768974% |
| D | 5982 | 1956 | 32.698094% |
Noise dominated data is calculated using 1-second bins in cleaned event files. If a bin has >2000 counts, and if more than 50% of those come from <1% of pixels, then it is considered to be noise-dominated and hence unusable.
| Quadrant | # 1 sec bins | Bins with >0 counts | Bins with >2000 counts | High rate bins dominated by noise | Noise dominated (total time) | Noise dominated (detector-on time) | Marked lightcurve |
|---|---|---|---|---|---|---|---|
| A | 6886 | 5982 | 0 | 0 | 0.00% | 0.00% | 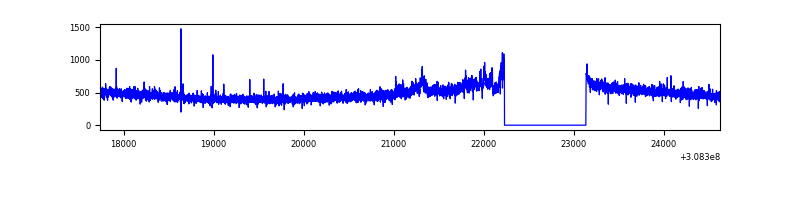 |
| B | 6887 | 5983 | 15 | 15 | 0.22% | 0.25% | 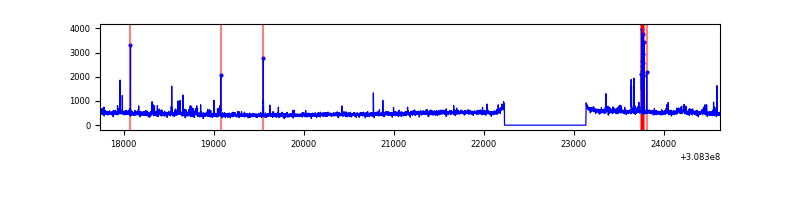 |
| C | 6887 | 5983 | 0 | 0 | 0.00% | 0.00% | 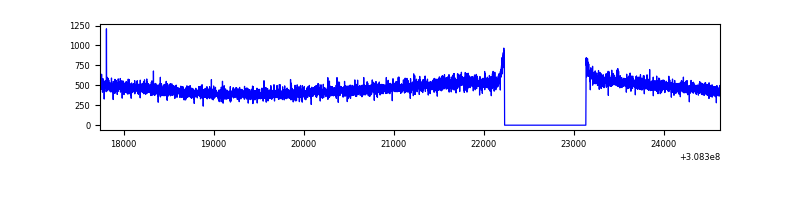 |
| D | 6887 | 5983 | 1759 | 1759 | 25.54% | 29.40% | 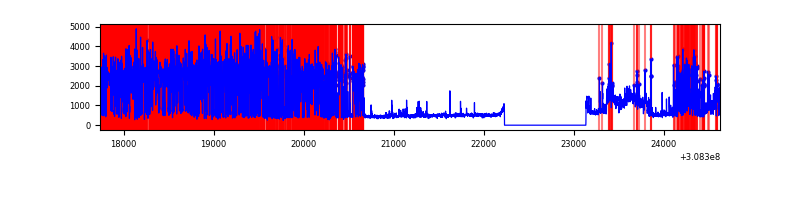 |
Top three noisy pixels from each quadrant. If the there are fewer than three noisy pixels in the level2.evt file, extra rows are filled as -1
| Pixel properties | Quadrant properties | ||||||
|---|---|---|---|---|---|---|---|
| Quadrant | DetID | PixID | Counts | Sigma | Mean | Median | Sigma |
| A | 14 | 235 | 67160 | 450.59 | 722 | 707 | 147.5 |
| A | 13 | 252 | 28239 | 186.68 | 722 | 707 | 147.5 |
| A | 13 | 254 | 11626 | 74.04 | 722 | 707 | 147.5 |
| B | 3 | 64 | 70702 | 502.65 | 718 | 701 | 139.3 |
| B | 0 | 190 | 46795 | 330.98 | 718 | 701 | 139.3 |
| B | 0 | 228 | 30045 | 210.71 | 718 | 701 | 139.3 |
| C | 14 | 238 | 106959 | 653.06 | 686 | 688 | 162.7 |
| C | 13 | 61 | 4972 | 26.33 | 686 | 688 | 162.7 |
| C | 14 | 111 | 1605 | 5.64 | 686 | 688 | 162.7 |
| D | 7 | 238 | 5281893 | 34517.86 | 622 | 604 | 153.0 |
| D | 7 | 38 | 113573 | 738.35 | 622 | 604 | 153.0 |
| D | 13 | 153 | 112383 | 730.57 | 622 | 604 | 153.0 |
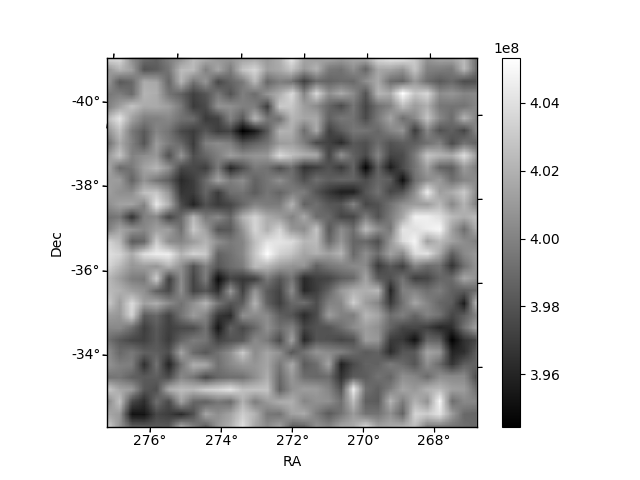
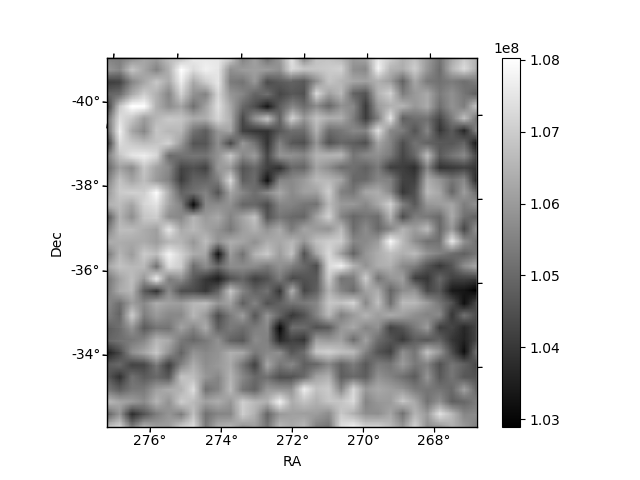
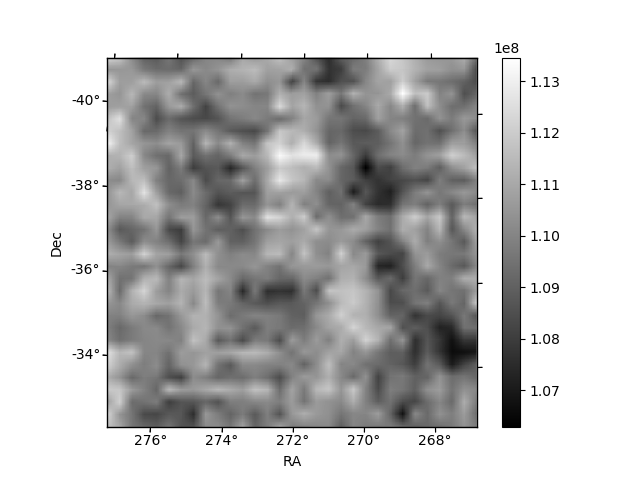
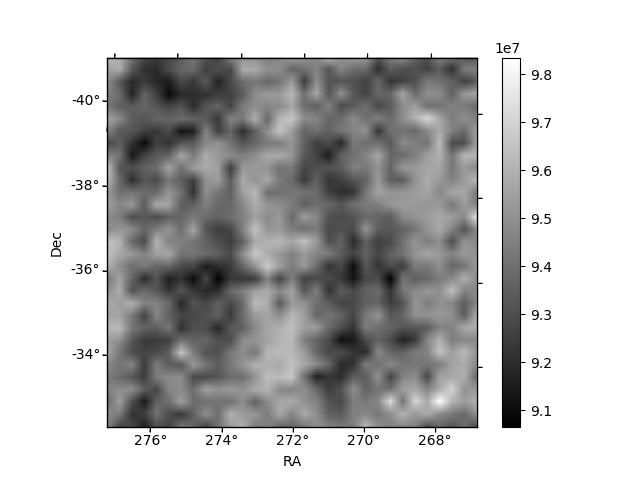
Histogram calculated using DETX and DETY for each event in the final _common_clean file
| Quadrant A | 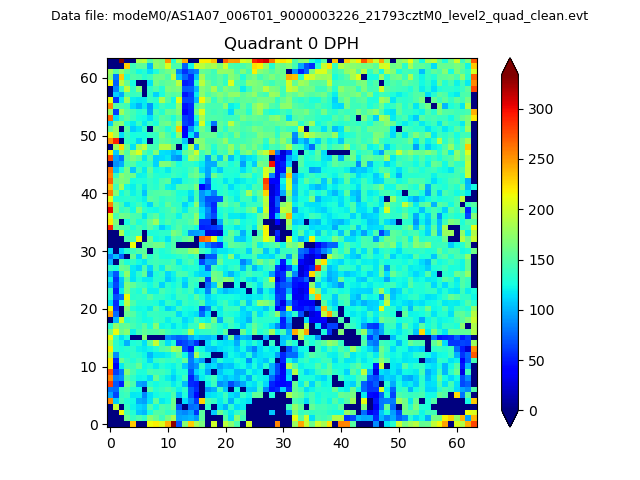 |
 |
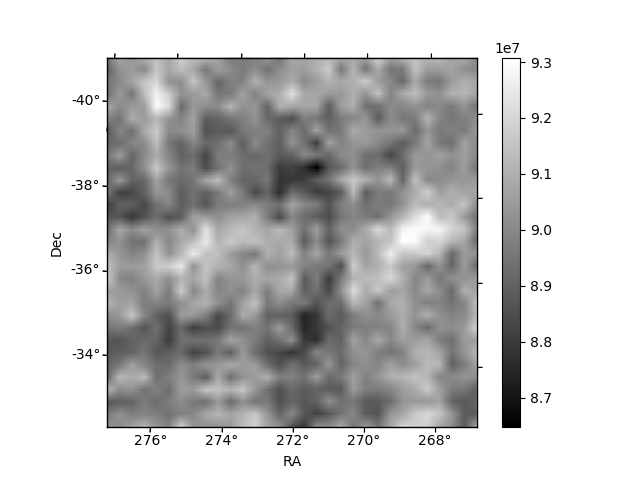
Quadrant B |
|---|---|---|---|
| Quadrant D | 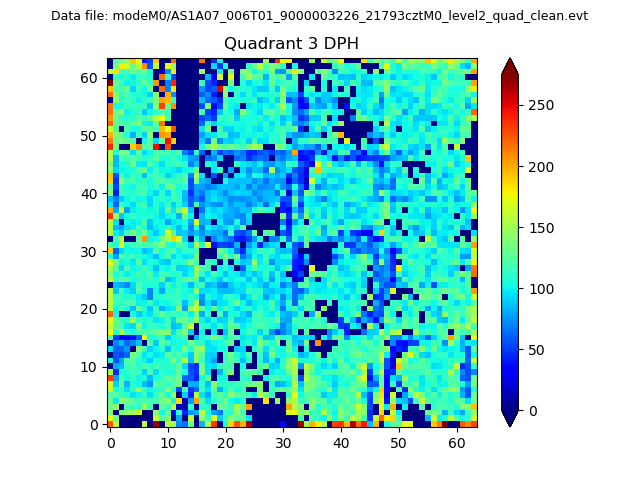 |
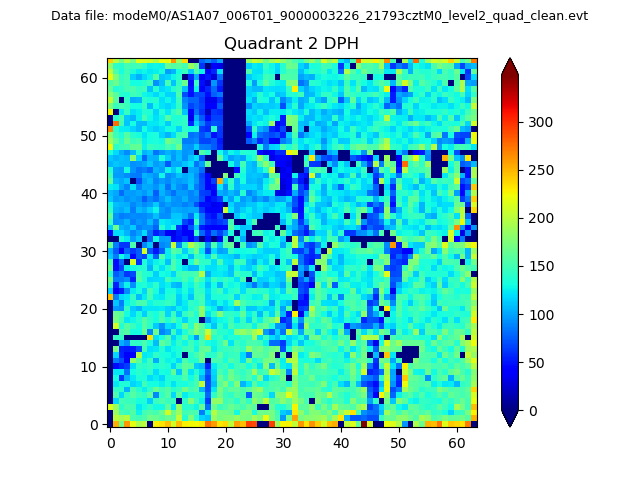 |
Quadrant C |
| Plot type | Count rate plots | Images |
|---|---|---|
| Comparison with Poisson distribution Blue bars denote a histogram of data divided into 1 sec bins. Red curve is a Poisson curve with rate = median count rate of data. |
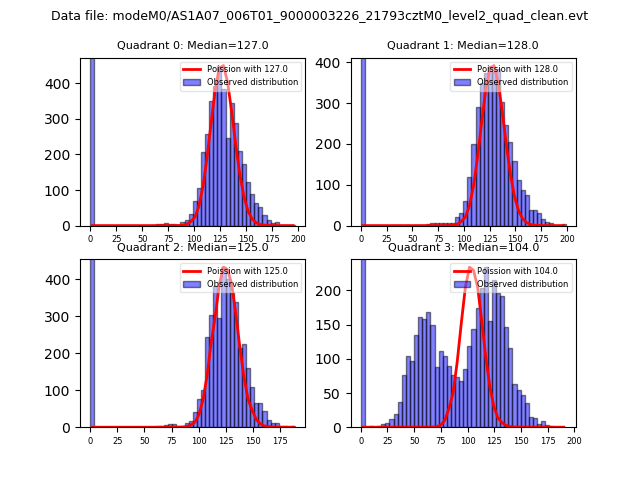 |
 |
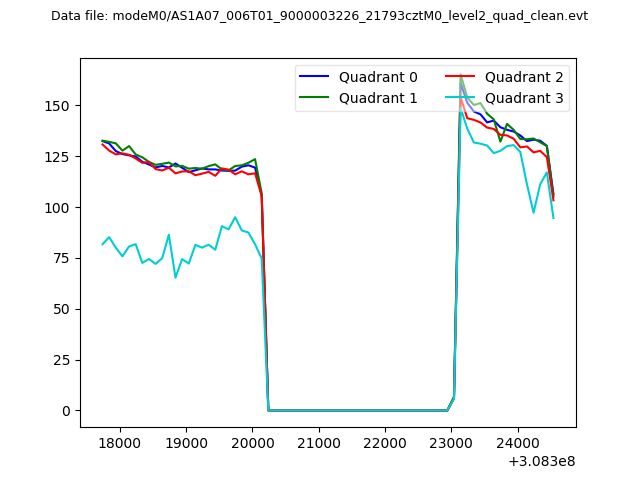
| Quadrant-wise count rates Data is divided into 100 sec bins |
 |
|
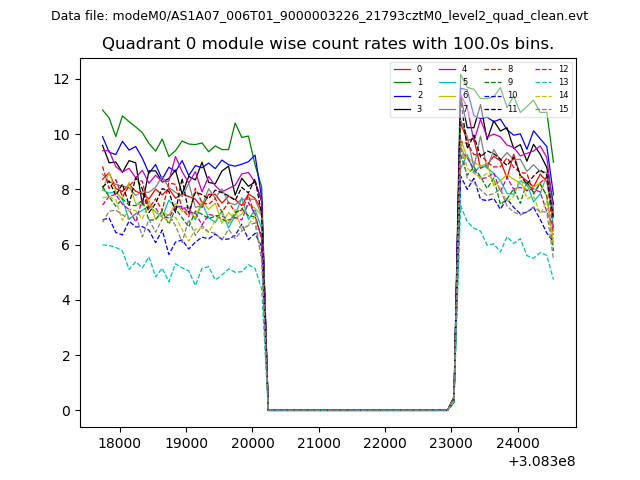
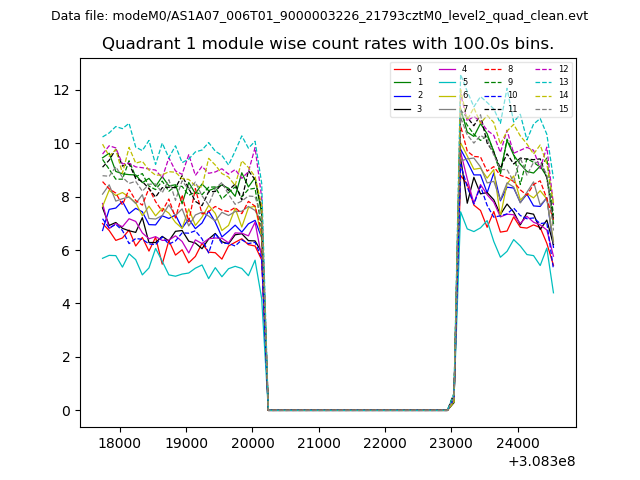
| Module-wise count rates for Quadrant A Data is divided into 100 sec bins |
 |
 |
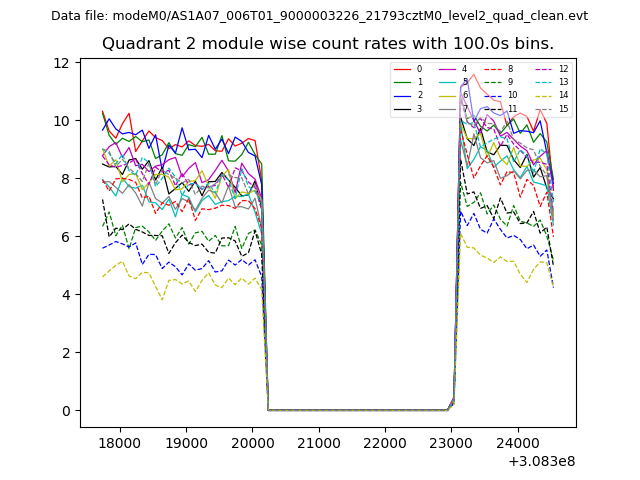
| Module-wise count rates for Quadrant B Data is divided into 100 sec bins |
 |
 |
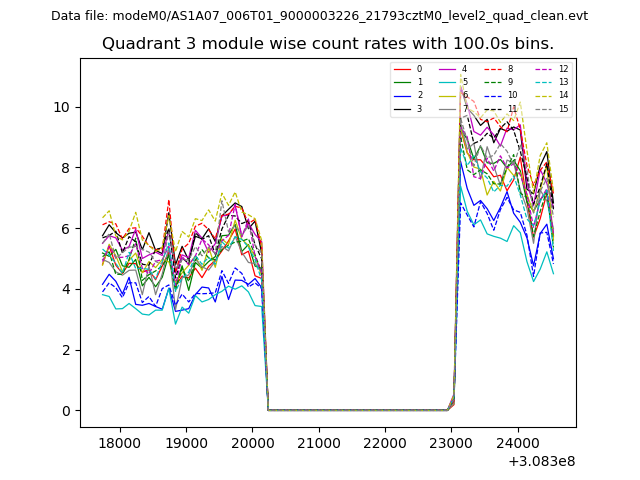
| Module-wise count rates for Quadrant C Data is divided into 100 sec bins |
 |
 |
| Module-wise count rates for Quadrant D Data is divided into 100 sec bins |
 |
 |
| Parameter | Plot |
|---|---|
| CZT HV Monitor | 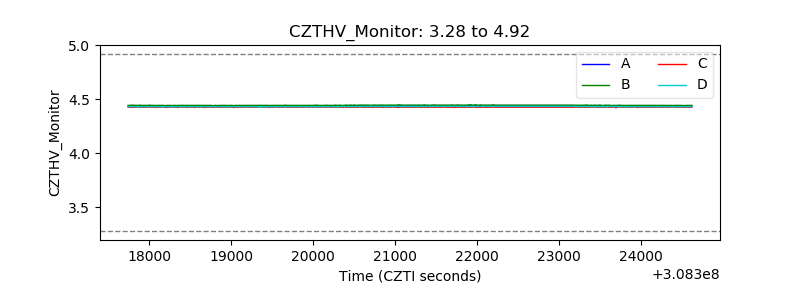 |
| D_VDD | 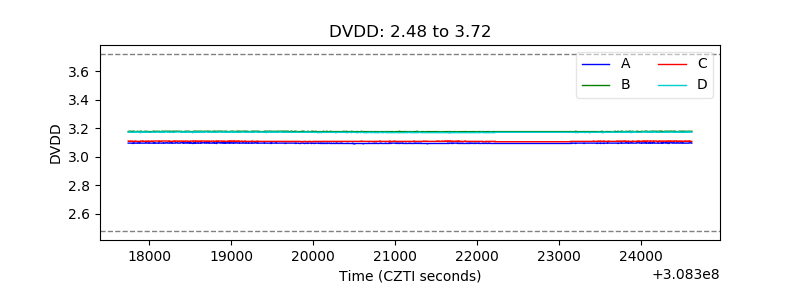 |
| Temperature 1 | 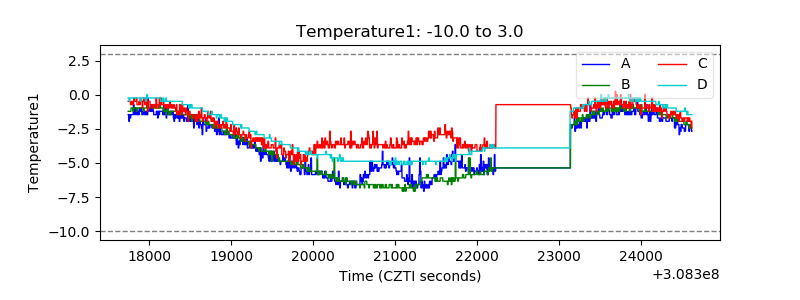 |
| Veto HV Monitor | 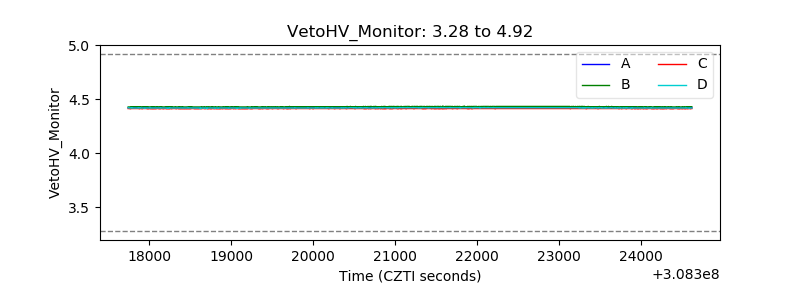 |
| Veto LLD | 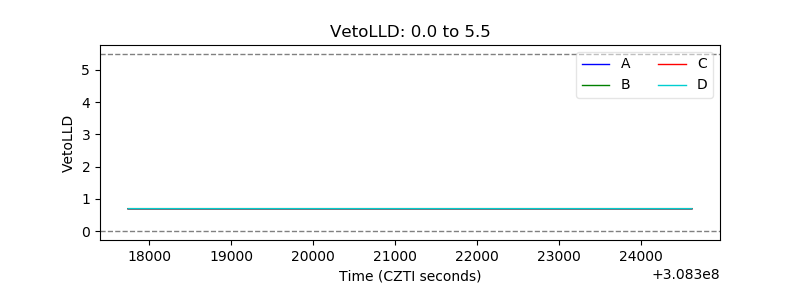 |
| Alpha Counter | 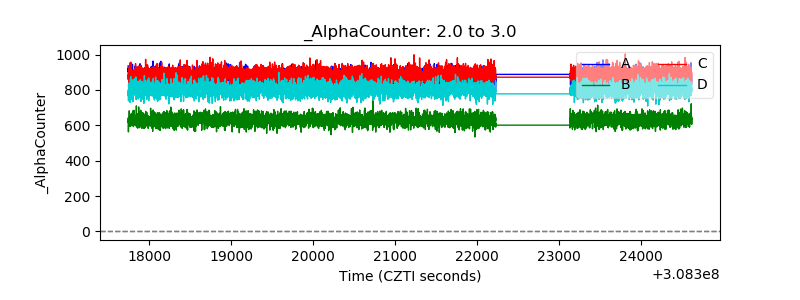 |
| _CPM_Rate | 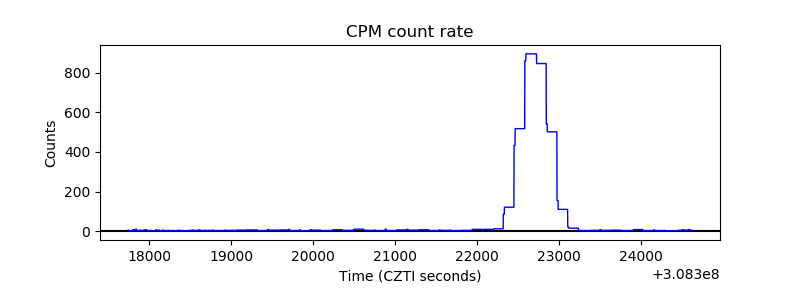 |
| CZT Counter |  |
| +2.5 Volts monitor |  |
| +5 Volts monitor |  |
| _ROLL_ROT | 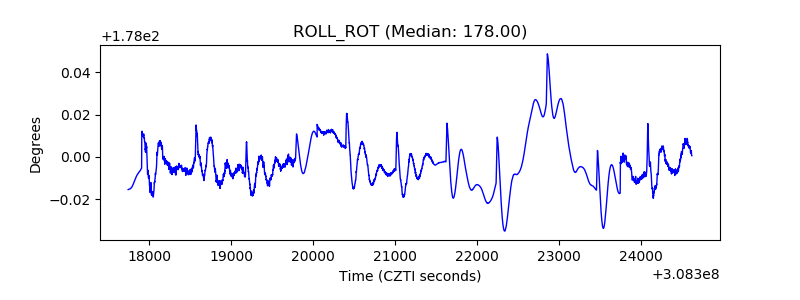 |
| _Roll_DEC | 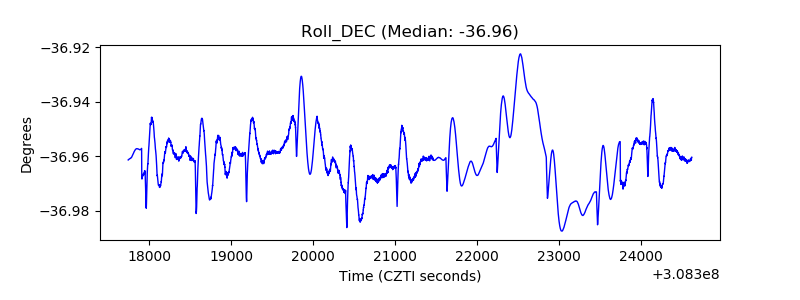 |
| _Roll_RA |  |
| Veto Counter | 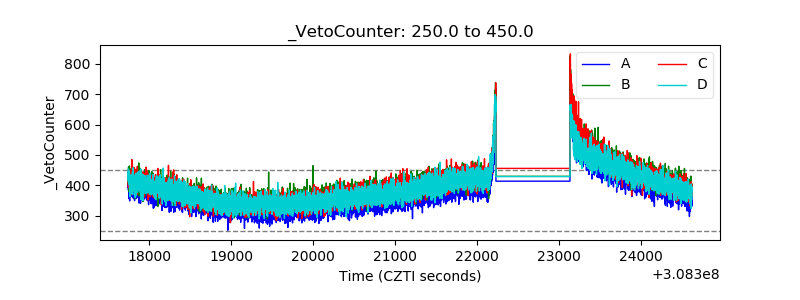 |