| Param | Original file | Final file |
|---|---|---|
| Filename | modeM0/AS1A07_006T01_9000003226_21794cztM0_level2.evt | modeM0/AS1A07_006T01_9000003226_21794cztM0_level2_quad_clean.evt |
| Size (bytes) | 397,157,760 | 62,458,560 |
| Size | 378.8 MB | 59.6 MB |
| Events in quadrant A | 2,425,027 | 392,553 |
| Events in quadrant B | 2,566,060 | 398,479 |
| Events in quadrant C | 2,406,231 | 382,714 |
| Events in quadrant D | 4,281,551 | 357,429 |
| Mode SS | |||
|---|---|---|---|
| Quadrant | BADHDUFLAG | Total packets | Discarded packets |
| A | 0 | 104 | 0 |
| B | 0 | 104 | 0 |
| C | 0 | 104 | 0 |
| D | 0 | 104 | 0 |
| Mode M0 | |||
|---|---|---|---|
| Quadrant | BADHDUFLAG | Total packets | Discarded packets |
| A | 0 | 10663 | 1 |
| B | 0 | 10965 | 1 |
| C | 0 | 10595 | 1 |
| D | 0 | 16155 | 1 |
| Mode M9 | |||
|---|---|---|---|
| Quadrant | BADHDUFLAG | Total packets | Discarded packets |
| A | 0 | 11 | 0 |
| B | 0 | 11 | 0 |
| C | 0 | 11 | 0 |
| D | 0 | 11 | 0 |
| Quadrant | Total seconds | Saturated seconds | Saturation percentage |
|---|---|---|---|
| A | 5136 | 30 | 0.584112% |
| B | 5136 | 43 | 0.837227% |
| C | 5137 | 45 | 0.875998% |
| D | 5137 | 300 | 5.839984% |
Noise dominated data is calculated using 1-second bins in cleaned event files. If a bin has >2000 counts, and if more than 50% of those come from <1% of pixels, then it is considered to be noise-dominated and hence unusable.
| Quadrant | # 1 sec bins | Bins with >0 counts | Bins with >2000 counts | High rate bins dominated by noise | Noise dominated (total time) | Noise dominated (detector-on time) | Marked lightcurve |
|---|---|---|---|---|---|---|---|
| A | 6196 | 5137 | 0 | 0 | 0.00% | 0.00% | 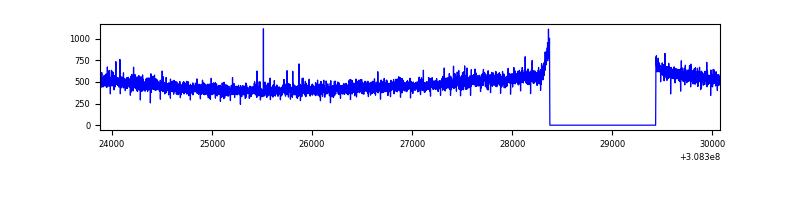 |
| B | 6196 | 5137 | 8 | 8 | 0.13% | 0.16% | 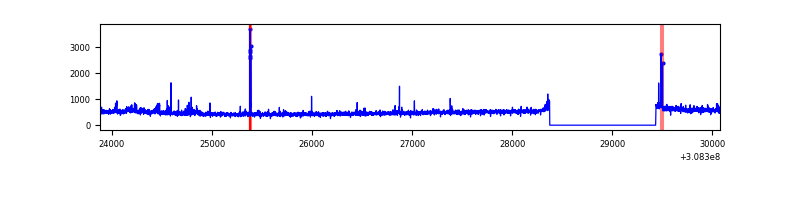 |
| C | 6197 | 5138 | 0 | 0 | 0.00% | 0.00% | 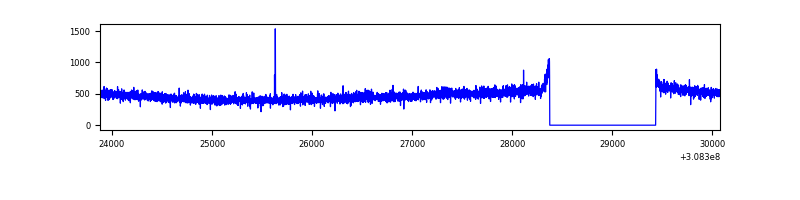 |
| D | 6197 | 5138 | 303 | 303 | 4.89% | 5.90% |  |
Top three noisy pixels from each quadrant. If the there are fewer than three noisy pixels in the level2.evt file, extra rows are filled as -1
| Pixel properties | Quadrant properties | ||||||
|---|---|---|---|---|---|---|---|
| Quadrant | DetID | PixID | Counts | Sigma | Mean | Median | Sigma |
| A | 13 | 252 | 21724 | 167.35 | 620 | 608 | 126.2 |
| A | 13 | 254 | 9940 | 73.96 | 620 | 608 | 126.2 |
| A | 14 | 235 | 7880 | 57.63 | 620 | 608 | 126.2 |
| B | 3 | 64 | 40107 | 327.58 | 622 | 608 | 120.6 |
| B | 0 | 190 | 30929 | 251.46 | 622 | 608 | 120.6 |
| B | 0 | 189 | 17080 | 136.61 | 622 | 608 | 120.6 |
| C | 14 | 238 | 94224 | 670.71 | 591 | 593 | 139.6 |
| C | 10 | 22 | 4387 | 27.17 | 591 | 593 | 139.6 |
| C | 13 | 61 | 4125 | 25.3 | 591 | 593 | 139.6 |
| D | 7 | 238 | 1691871 | 11646.4 | 589 | 570 | 145.2 |
| D | 1 | 52 | 176915 | 1214.32 | 589 | 570 | 145.2 |
| D | 13 | 153 | 84501 | 577.95 | 589 | 570 | 145.2 |
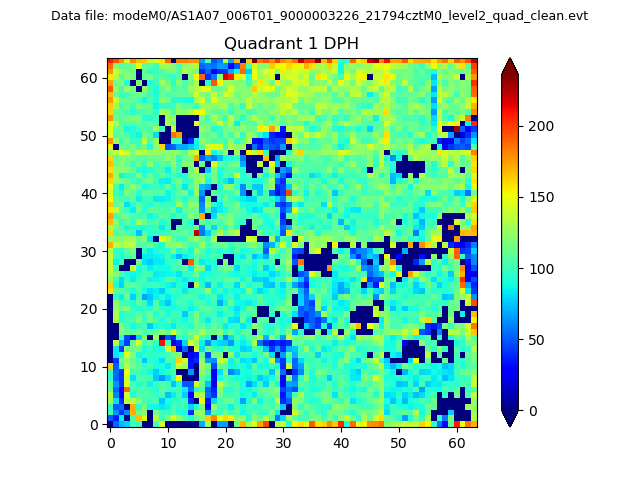
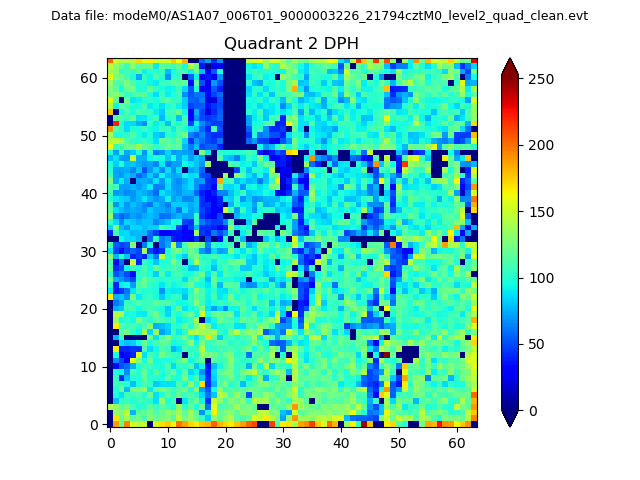
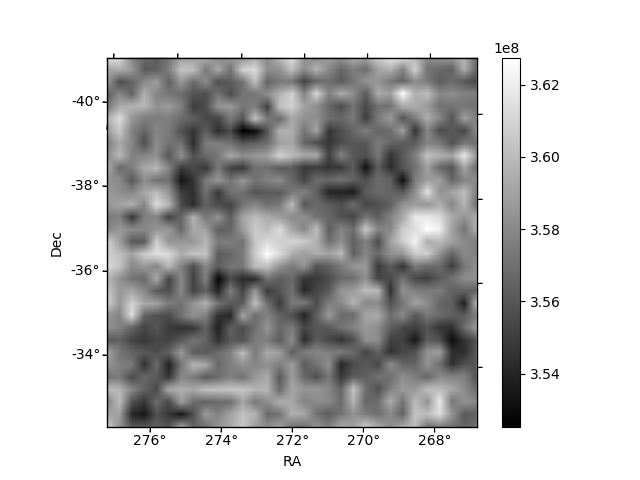
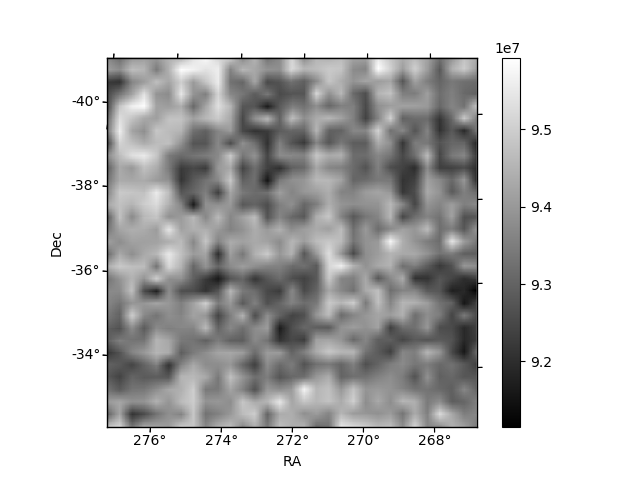
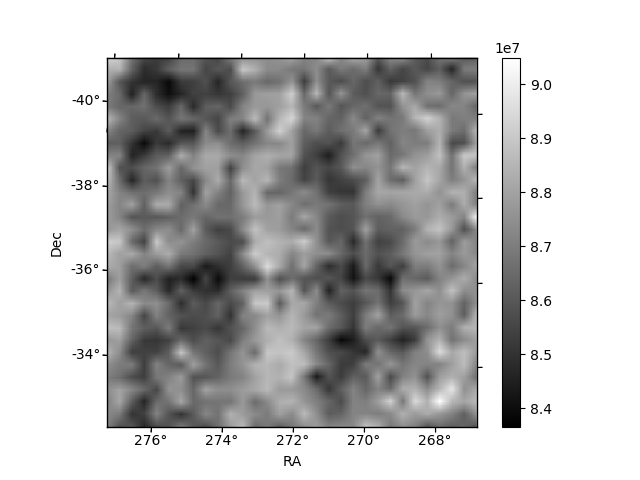
Histogram calculated using DETX and DETY for each event in the final _common_clean file
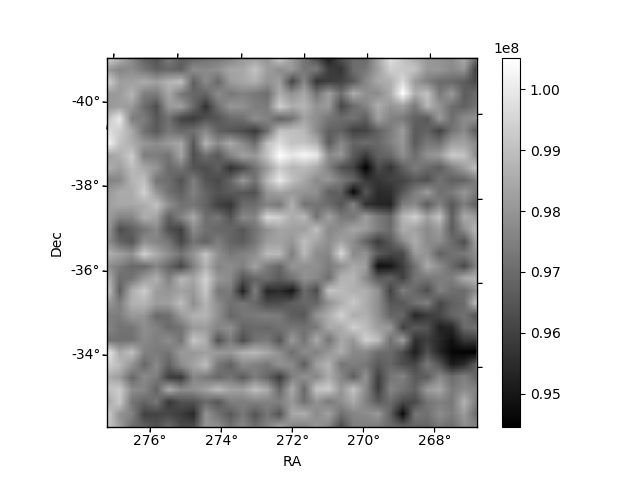
| Quadrant A | 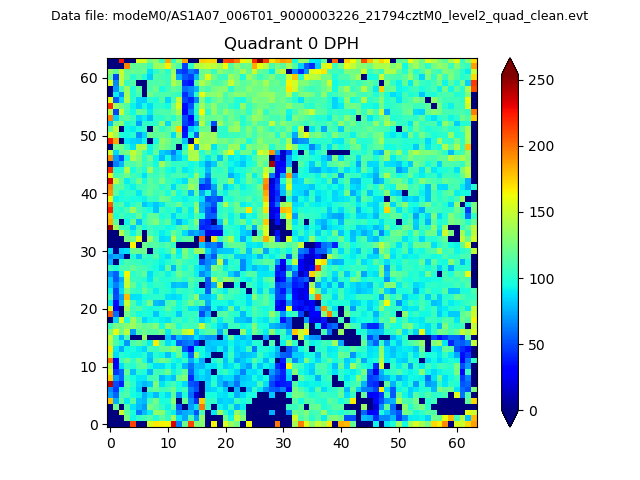 |
 |
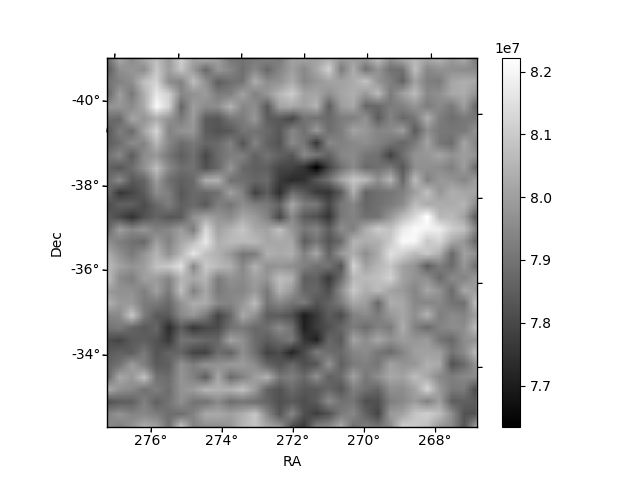
Quadrant B |
|---|---|---|---|
| Quadrant D | 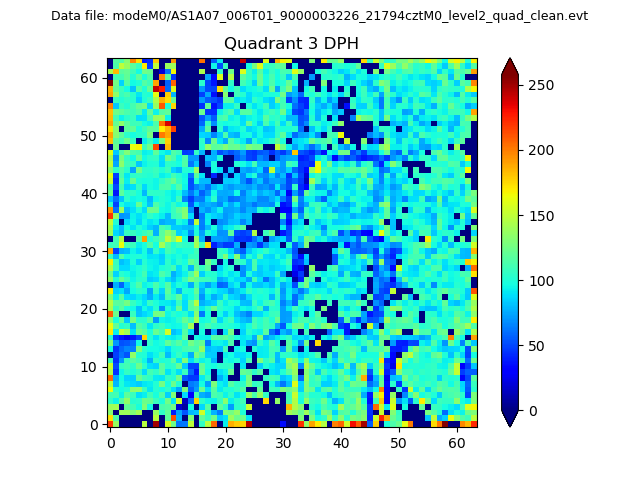 |
 |
Quadrant C |
| Plot type | Count rate plots | Images |
|---|---|---|
| Comparison with Poisson distribution Blue bars denote a histogram of data divided into 1 sec bins. Red curve is a Poisson curve with rate = median count rate of data. |
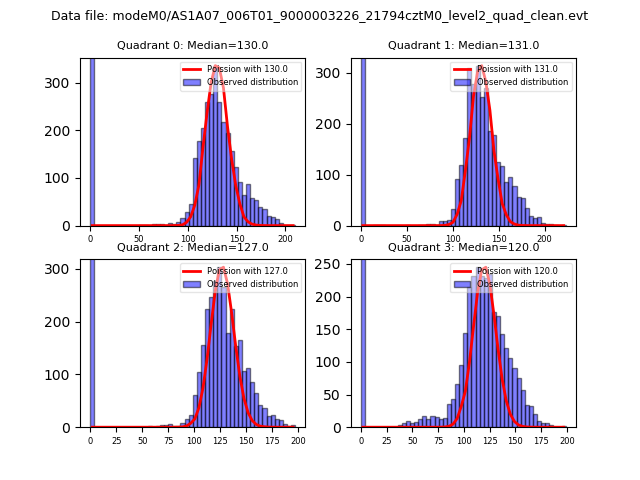 |
 |
| Quadrant-wise count rates Data is divided into 100 sec bins |
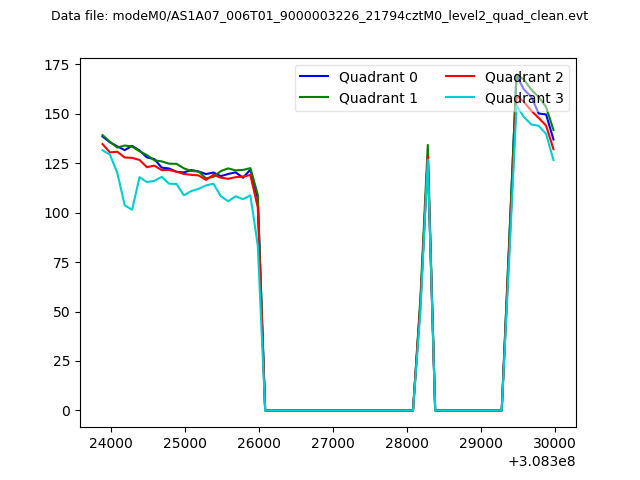 |
|
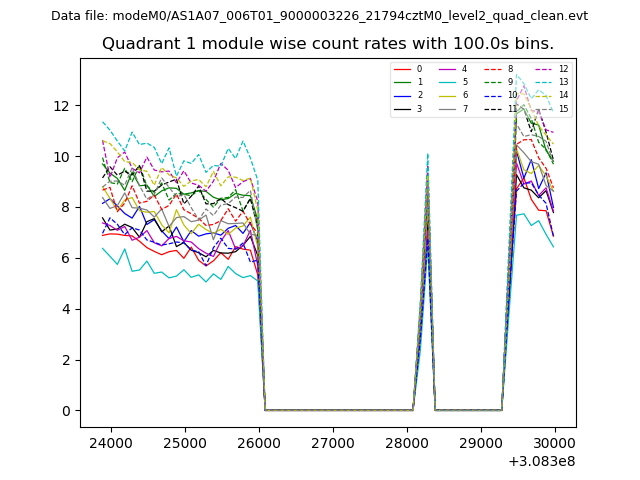
| Module-wise count rates for Quadrant A Data is divided into 100 sec bins |
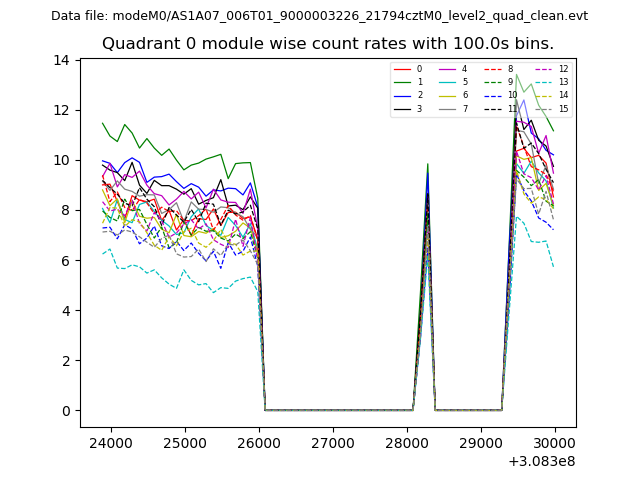 |
 |
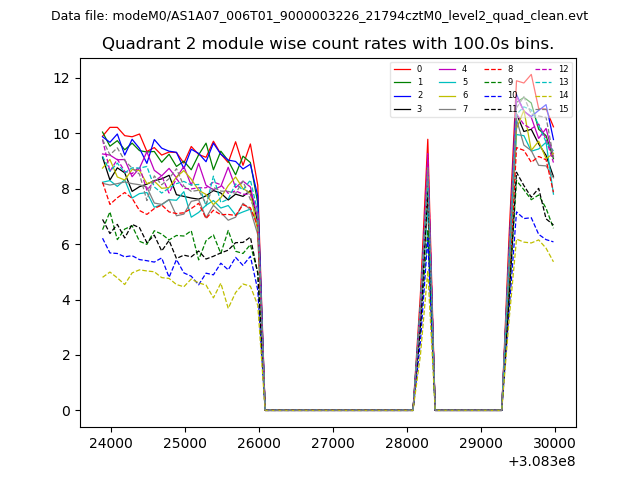
| Module-wise count rates for Quadrant B Data is divided into 100 sec bins |
 |
 |
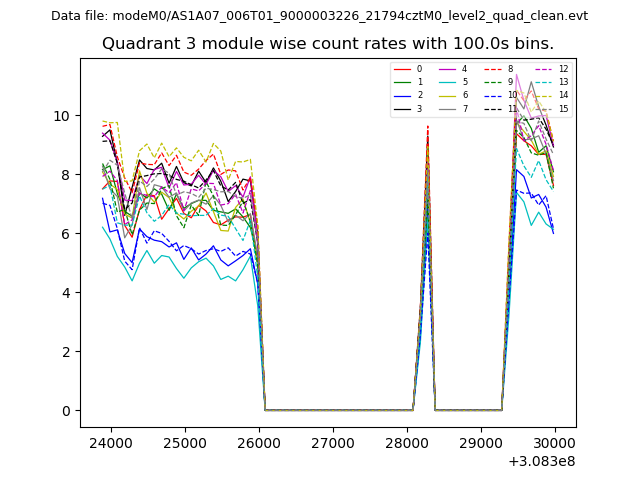
| Module-wise count rates for Quadrant C Data is divided into 100 sec bins |
 |
 |
| Module-wise count rates for Quadrant D Data is divided into 100 sec bins |
 |
 |
| Parameter | Plot |
|---|---|
| CZT HV Monitor | 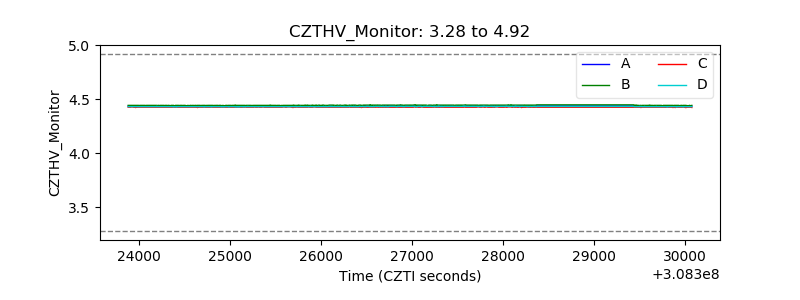 |
| D_VDD | 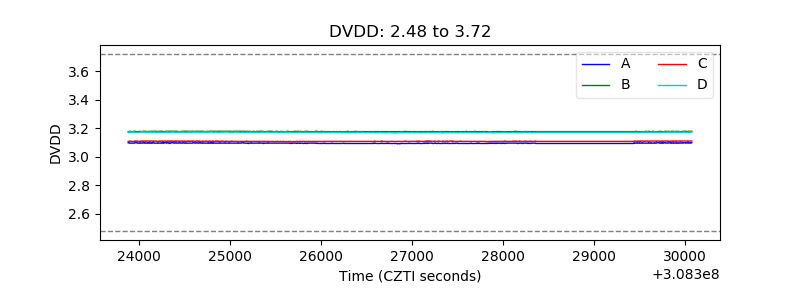 |
| Temperature 1 | 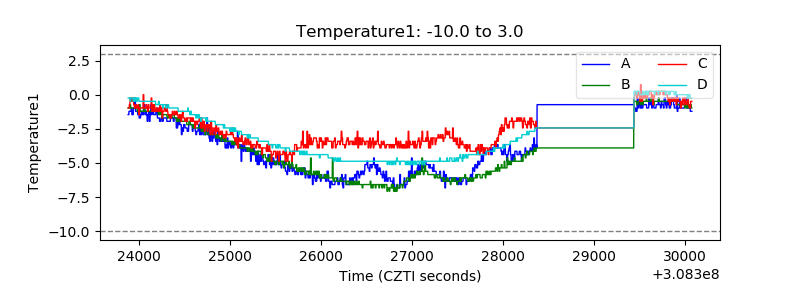 |
| Veto HV Monitor | 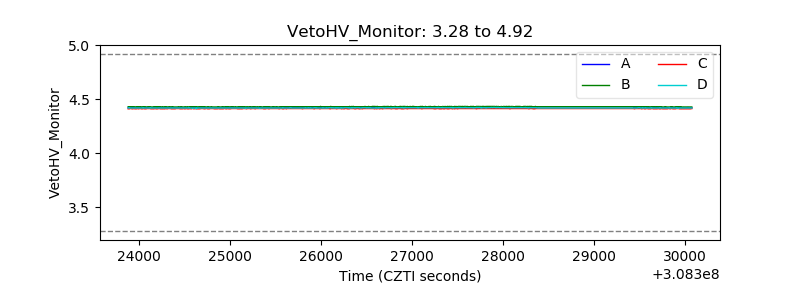 |
| Veto LLD | 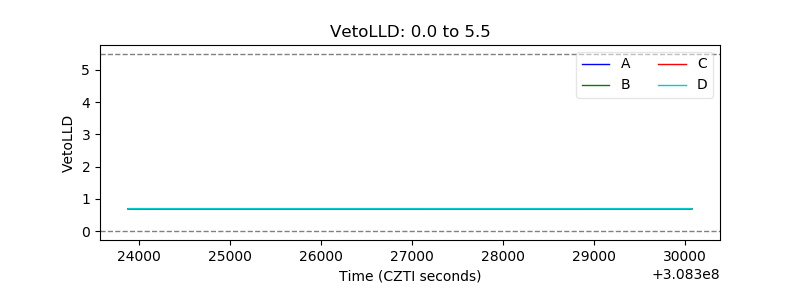 |
| Alpha Counter | 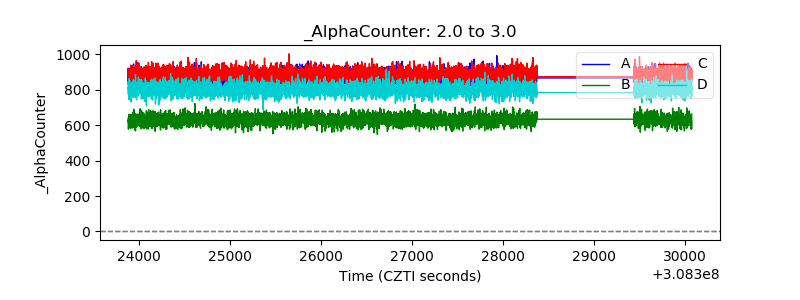 |
| _CPM_Rate | 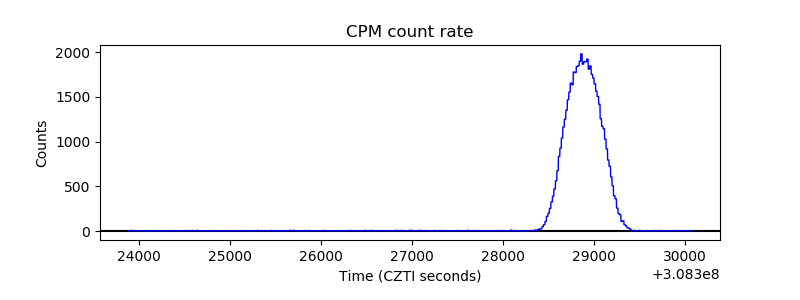 |
| CZT Counter | 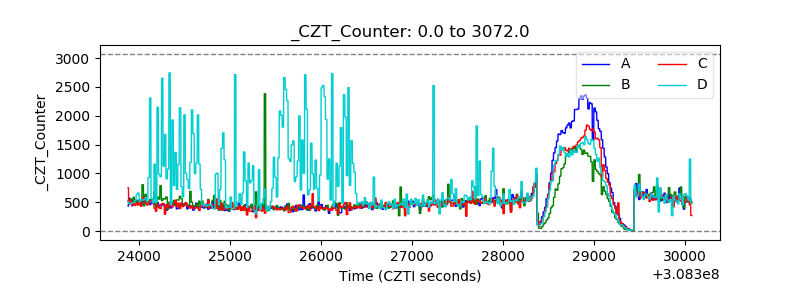 |
| +2.5 Volts monitor |  |
| +5 Volts monitor |  |
| _ROLL_ROT | 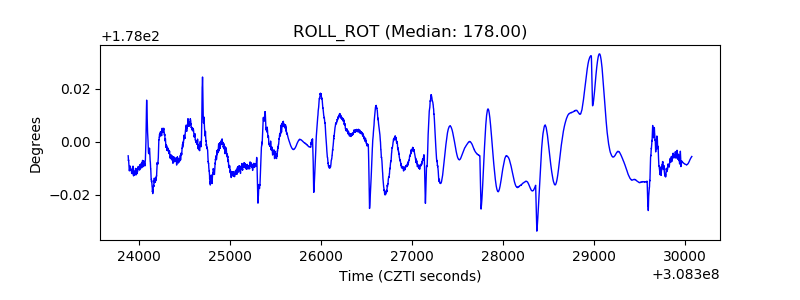 |
| _Roll_DEC | 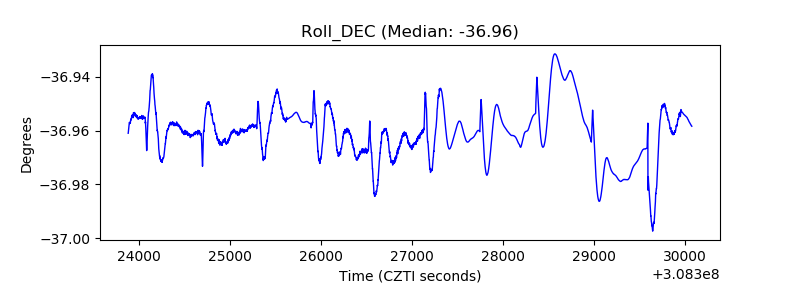 |
| _Roll_RA | 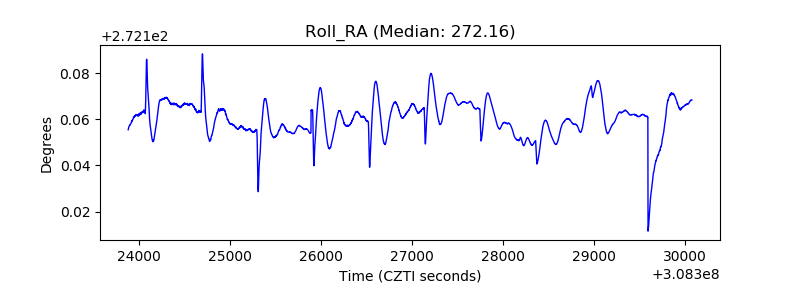 |
| Veto Counter | 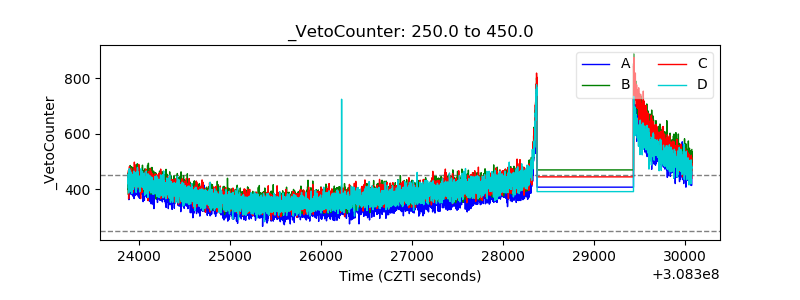 |