| Param | Original file | Final file |
|---|---|---|
| Filename | modeM0/AS1A07_006T01_9000003226_21796cztM0_level2.evt | modeM0/AS1A07_006T01_9000003226_21796cztM0_level2_quad_clean.evt |
| Size (bytes) | 50,751,360 | 14,454,720 |
| Size | 48.4 MB | 13.8 MB |
| Events in quadrant A | 360,739 | 98,510 |
| Events in quadrant B | 391,984 | 101,361 |
| Events in quadrant C | 350,303 | 94,376 |
| Events in quadrant D | 387,980 | 91,377 |
| Mode SS | |||
|---|---|---|---|
| Quadrant | BADHDUFLAG | Total packets | Discarded packets |
| A | 0 | 12 | 0 |
| B | 0 | 12 | 0 |
| C | 0 | 12 | 0 |
| D | 0 | 12 | 0 |
| Mode M0 | |||
|---|---|---|---|
| Quadrant | BADHDUFLAG | Total packets | Discarded packets |
| A | 0 | 1473 | 1 |
| B | 0 | 1608 | 1 |
| C | 0 | 1423 | 1 |
| D | 0 | 1573 | 1 |
| Quadrant | Total seconds | Saturated seconds | Saturation percentage |
|---|---|---|---|
| A | 629 | 0 | 0.000000% |
| B | 629 | 7 | 1.112878% |
| C | 629 | 6 | 0.953895% |
| D | 629 | 4 | 0.635930% |
Noise dominated data is calculated using 1-second bins in cleaned event files. If a bin has >2000 counts, and if more than 50% of those come from <1% of pixels, then it is considered to be noise-dominated and hence unusable.
| Quadrant | # 1 sec bins | Bins with >0 counts | Bins with >2000 counts | High rate bins dominated by noise | Noise dominated (total time) | Noise dominated (detector-on time) | Marked lightcurve |
|---|---|---|---|---|---|---|---|
| A | 629 | 629 | 0 | 0 | 0.00% | 0.00% | 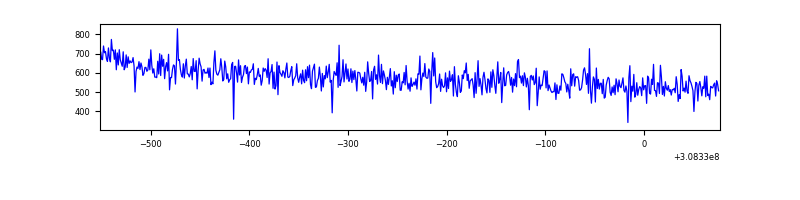 |
| B | 629 | 629 | 2 | 2 | 0.32% | 0.32% | 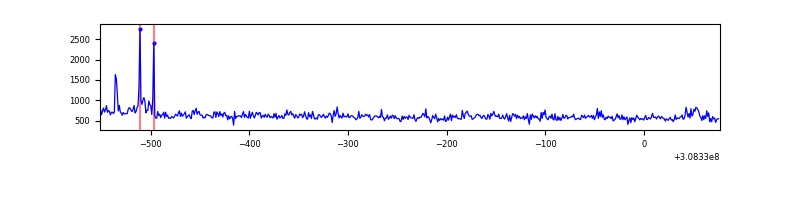 |
| C | 629 | 629 | 0 | 0 | 0.00% | 0.00% |  |
| D | 629 | 629 | 2 | 2 | 0.32% | 0.32% | 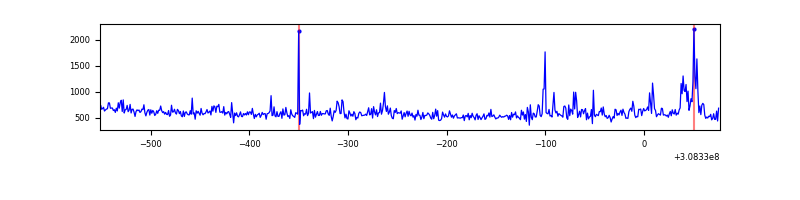 |
Top three noisy pixels from each quadrant. If the there are fewer than three noisy pixels in the level2.evt file, extra rows are filled as -1
| Pixel properties | Quadrant properties | ||||||
|---|---|---|---|---|---|---|---|
| Quadrant | DetID | PixID | Counts | Sigma | Mean | Median | Sigma |
| A | 13 | 254 | 1345 | 60.59 | 93 | 91 | 20.7 |
| A | 0 | 226 | 869 | 37.59 | 93 | 91 | 20.7 |
| A | 3 | 137 | 761 | 32.37 | 93 | 91 | 20.7 |
| B | 0 | 245 | 14505 | 729.9 | 91 | 89 | 19.8 |
| B | 0 | 190 | 4597 | 228.24 | 91 | 89 | 19.8 |
| B | 0 | 228 | 4468 | 221.71 | 91 | 89 | 19.8 |
| C | 14 | 238 | 13468 | 602.03 | 86 | 86 | 22.2 |
| C | 13 | 61 | 607 | 23.44 | 86 | 86 | 22.2 |
| C | 14 | 111 | 251 | 7.42 | 86 | 86 | 22.2 |
| D | 1 | 52 | 22447 | 943.04 | 88 | 85 | 23.7 |
| D | 7 | 238 | 16351 | 685.96 | 88 | 85 | 23.7 |
| D | 2 | 153 | 3168 | 130.01 | 88 | 85 | 23.7 |
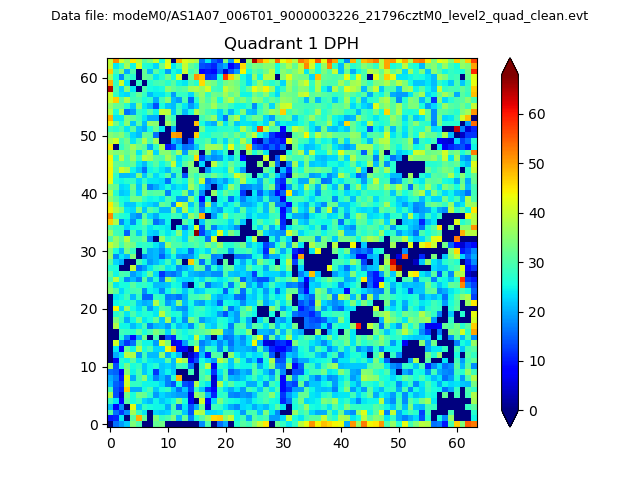
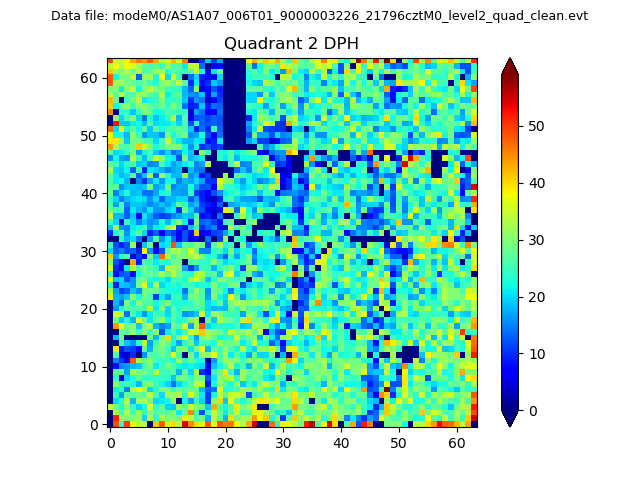
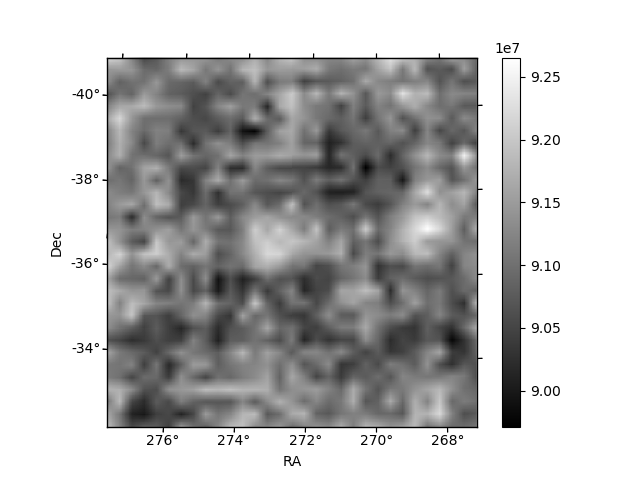
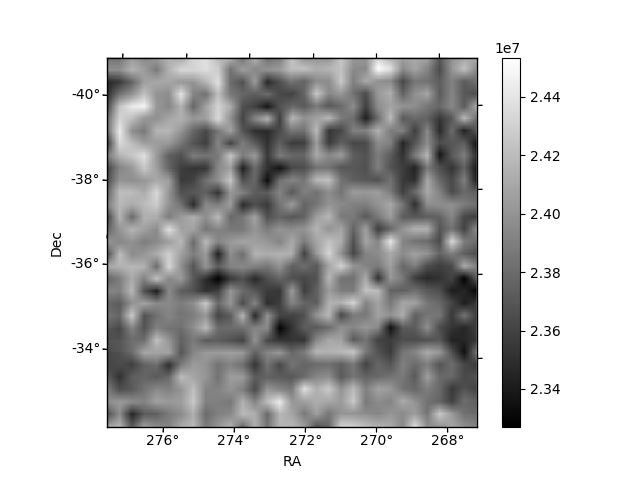
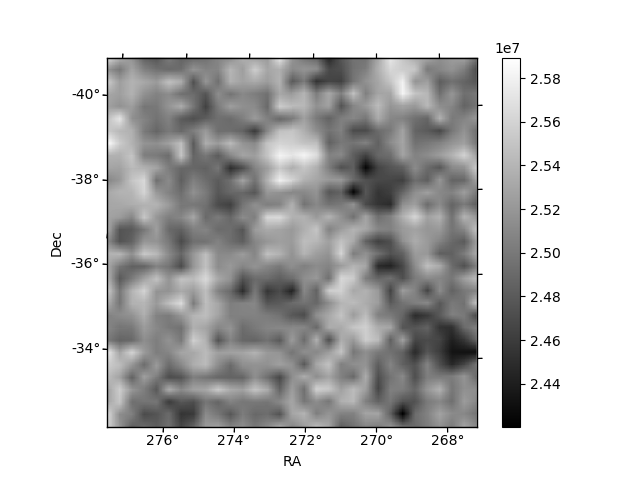
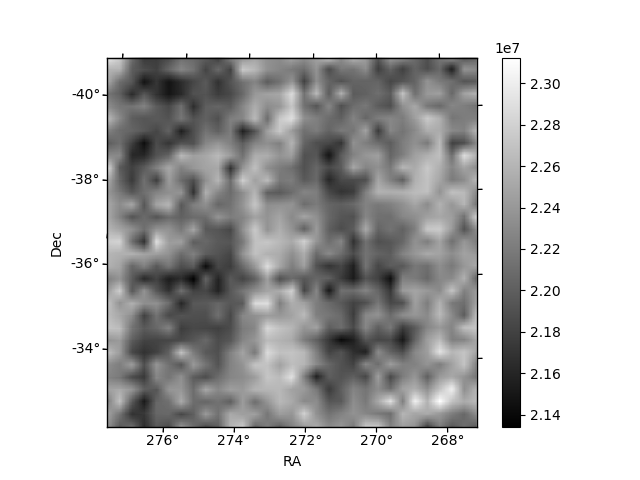
Histogram calculated using DETX and DETY for each event in the final _common_clean file
| Quadrant A | 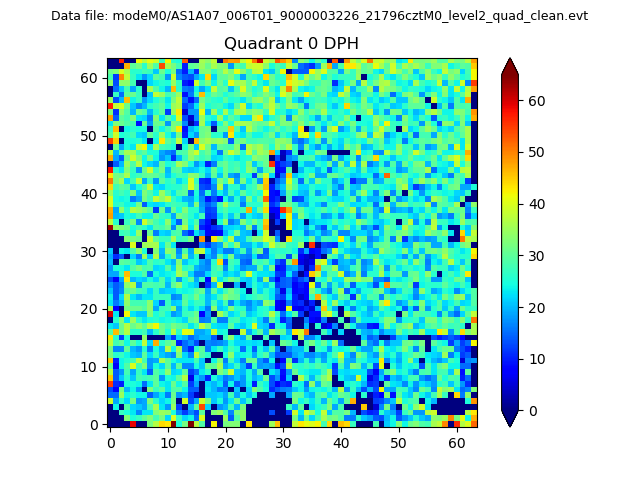 |
 |
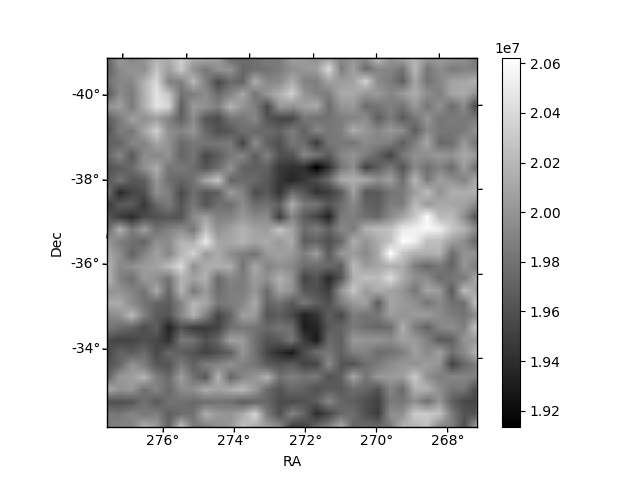
Quadrant B |
|---|---|---|---|
| Quadrant D | 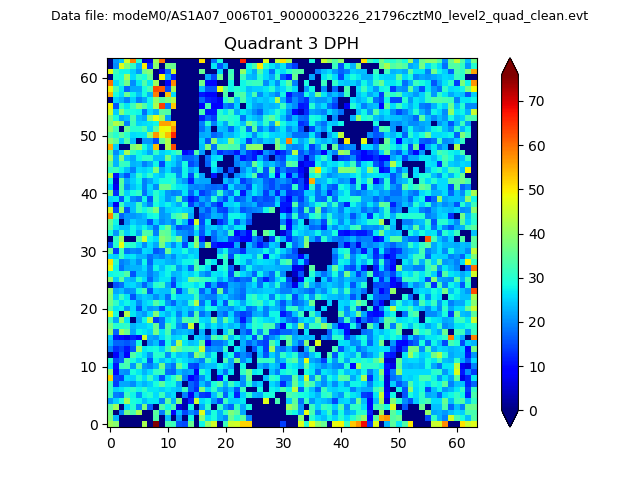 |
 |
Quadrant C |
| Plot type | Count rate plots | Images |
|---|---|---|
| Comparison with Poisson distribution Blue bars denote a histogram of data divided into 1 sec bins. Red curve is a Poisson curve with rate = median count rate of data. |
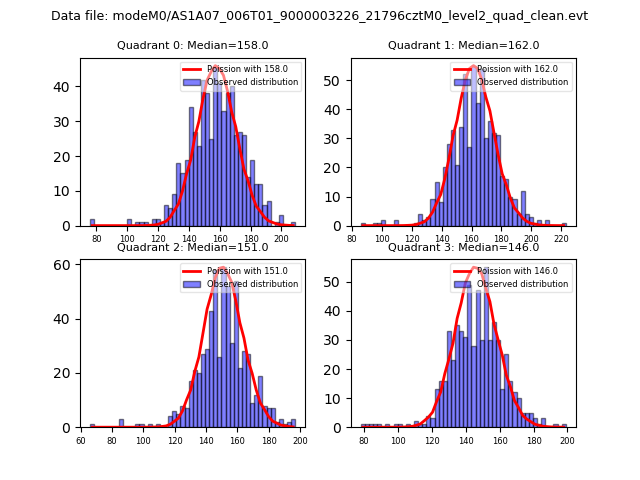 |
 |
| Quadrant-wise count rates Data is divided into 100 sec bins |
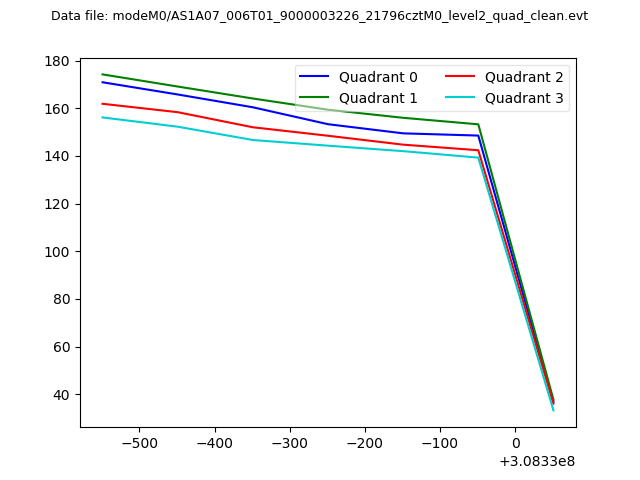 |
|
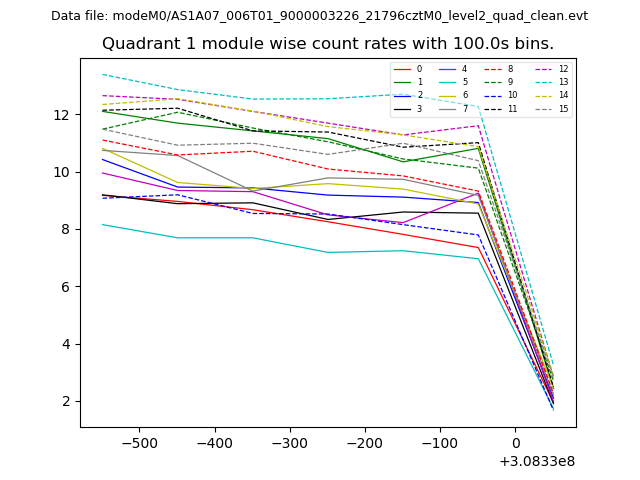
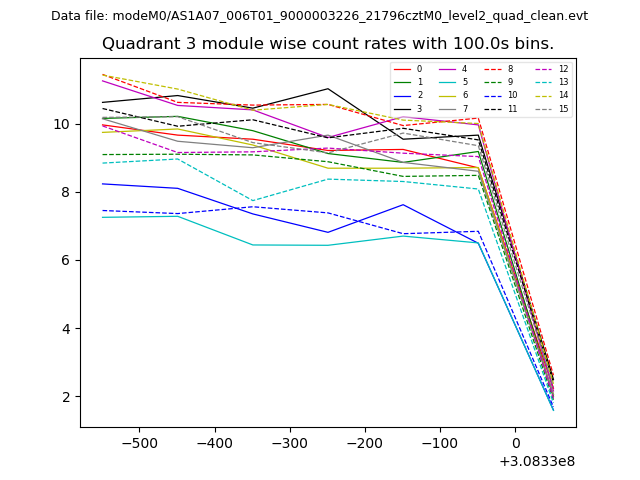
| Module-wise count rates for Quadrant A Data is divided into 100 sec bins |
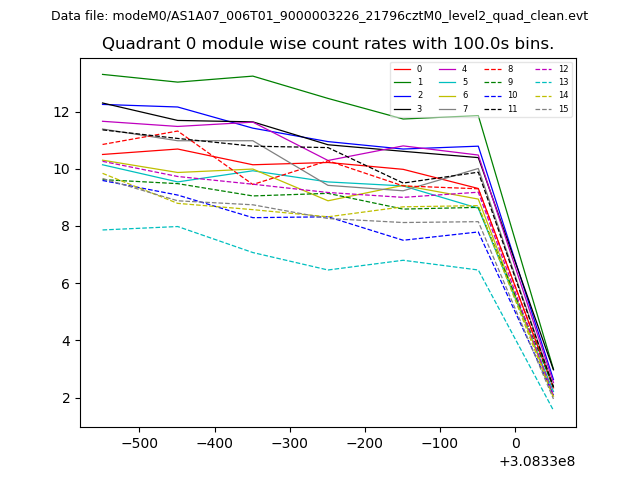 |
 |
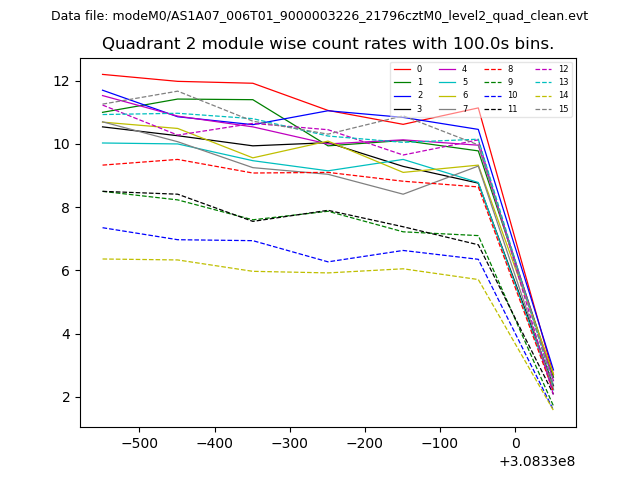
| Module-wise count rates for Quadrant B Data is divided into 100 sec bins |
 |
 |
| Module-wise count rates for Quadrant C Data is divided into 100 sec bins |
 |
 |
| Module-wise count rates for Quadrant D Data is divided into 100 sec bins |
 |
 |
| Parameter | Plot |
|---|---|
| CZT HV Monitor | 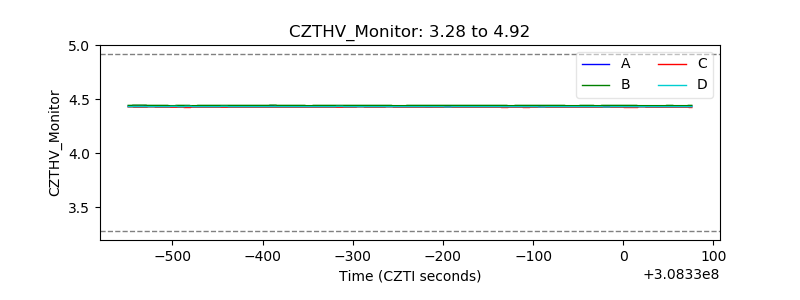 |
| D_VDD | 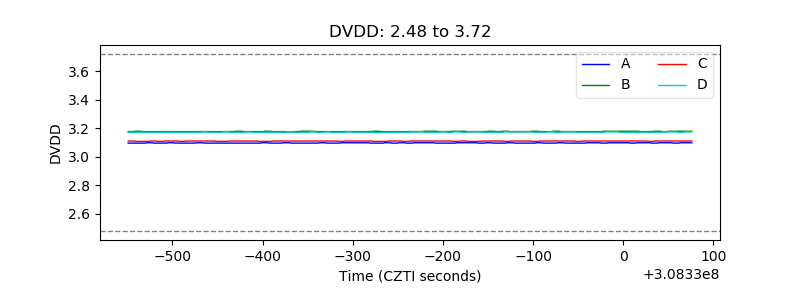 |
| Temperature 1 | 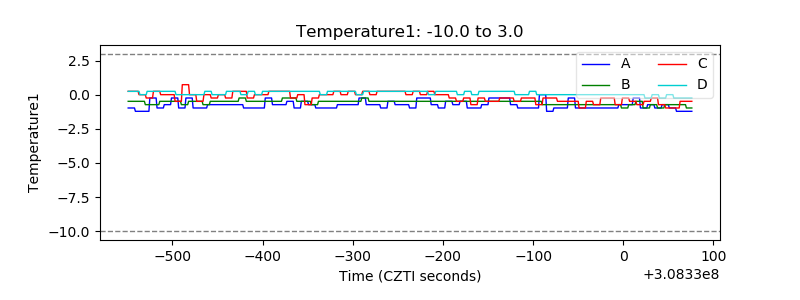 |
| Veto HV Monitor | 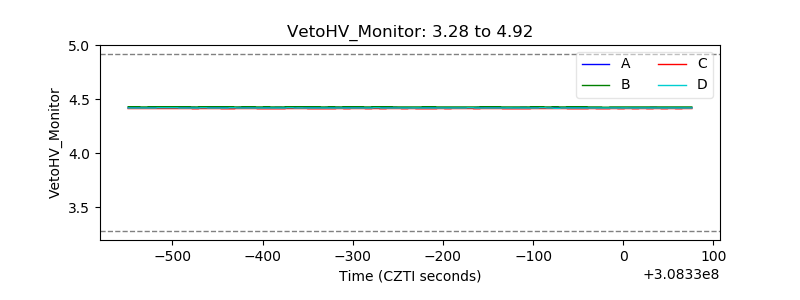 |
| Veto LLD | 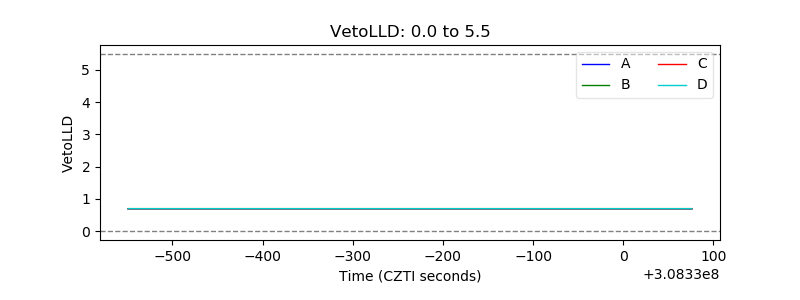 |
| Alpha Counter | 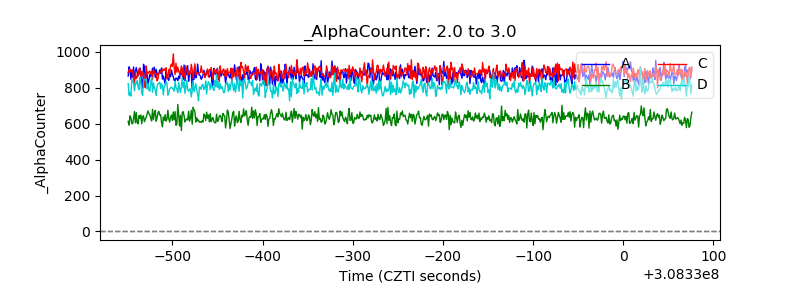 |
| _CPM_Rate | 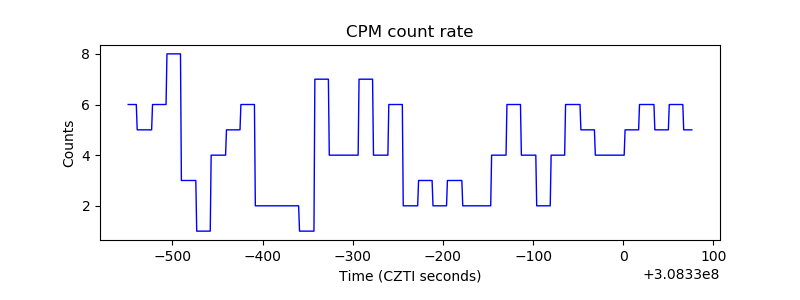 |
| CZT Counter | 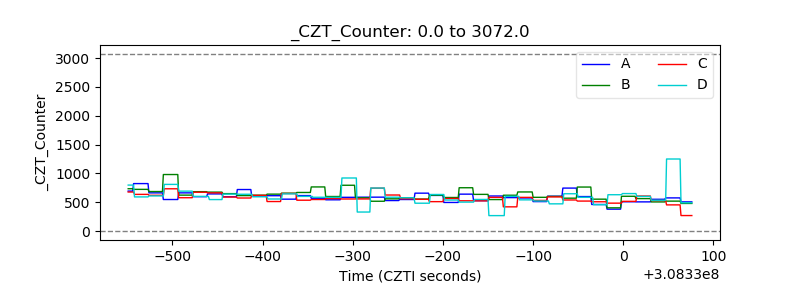 |
| +2.5 Volts monitor |  |
| +5 Volts monitor |  |
| _ROLL_ROT | 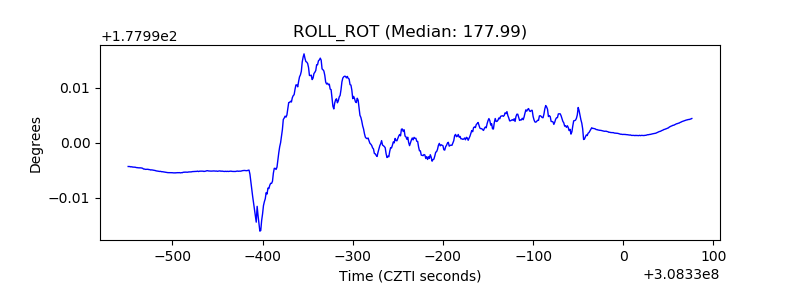 |
| _Roll_DEC | 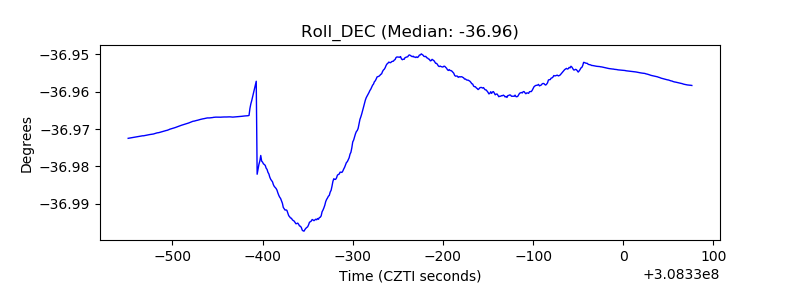 |
| _Roll_RA | 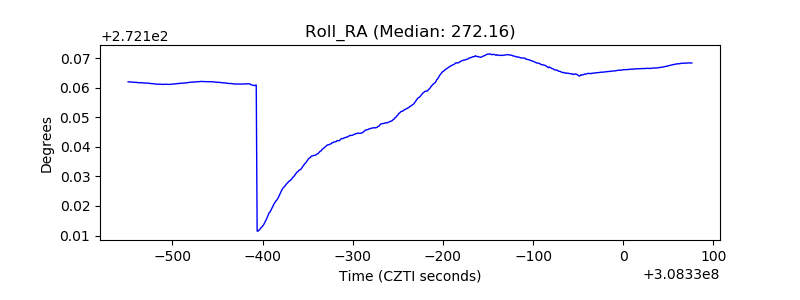 |
| Veto Counter | 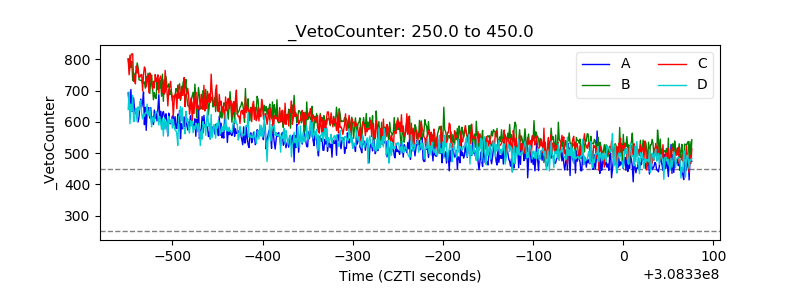 |