| Param | Original file | Final file |
|---|---|---|
| Filename | modeM0/AS1A07_006T02_9000003228cztM0_level2.fits | modeM0/AS1A07_006T02_9000003228cztM0_level2_quad_clean.evt |
| Size (bytes) | 602,377,920 | 498,064,320 |
| Size | 574.5 MB | 475.0 MB |
| Events in quadrant A | 3,719,778 | 2,835,330 |
| Events in quadrant B | 3,567,560 | 2,852,560 |
| Events in quadrant C | 3,650,328 | 2,747,075 |
| Events in quadrant D | 3,094,636 | 2,438,067 |
| Mode M0 | |||
|---|---|---|---|
| Quadrant | BADHDUFLAG | Total packets | Discarded packets |
| A | 0 | 129548 | 0 |
| B | 0 | 133856 | 0 |
| C | 0 | 126728 | 0 |
| D | 0 | 167867 | 0 |
| Mode M9 | |||
|---|---|---|---|
| Quadrant | BADHDUFLAG | Total packets | Discarded packets |
| A | 0 | 95 | 0 |
| B | 0 | 95 | 0 |
| C | 0 | 95 | 0 |
| D | 0 | 95 | 0 |
| Mode SS | |||
|---|---|---|---|
| Quadrant | BADHDUFLAG | Total packets | Discarded packets |
| A | 0 | 1246 | 0 |
| B | 0 | 1246 | 0 |
| C | 0 | 1246 | 0 |
| D | 0 | 1246 | 0 |
| Quadrant | Total seconds | Saturated seconds | Saturation percentage |
|---|---|---|---|
| A | 61380 | 790 | 1.287064% |
| B | 61380 | 1272 | 2.072336% |
| C | 61380 | 1059 | 1.725318% |
| D | 61380 | 3773 | 6.146953% |
Noise dominated data is calculated using 1-second bins in cleaned event files. If a bin has >2000 counts, and if more than 50% of those come from <1% of pixels, then it is considered to be noise-dominated and hence unusable.
| Quadrant | # 1 sec bins | Bins with >0 counts | Bins with >2000 counts | High rate bins dominated by noise | Noise dominated (total time) | Noise dominated (detector-on time) | Marked lightcurve |
|---|---|---|---|---|---|---|---|
| A | 70781 | 61379 | 0 | 0 | 0.00% | 0.00% | 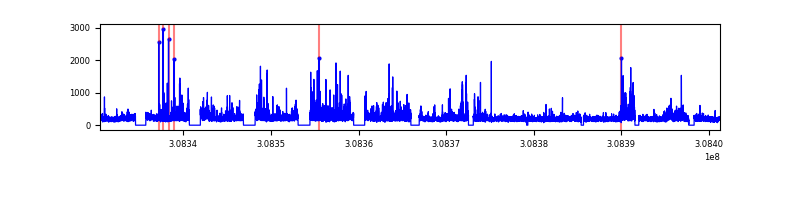 |
| B | 70781 | 61365 | 0 | 0 | 0.00% | 0.00% |  |
| C | 70781 | 61377 | 0 | 0 | 0.00% | 0.00% |  |
| D | 70781 | 61369 | 0 | 0 | 0.00% | 0.00% |  |
Top three noisy pixels from each quadrant. If the there are fewer than three noisy pixels in the level2.evt file, extra rows are filled as -1
| Pixel properties | Quadrant properties | ||||||
|---|---|---|---|---|---|---|---|
| Quadrant | DetID | PixID | Counts | Sigma | Mean | Median | Sigma |
| A | 0 | 29 | 3631 | 11.35 | 967 | 906 | 240.1 |
| A | 7 | 110 | 3036 | 8.87 | 967 | 906 | 240.1 |
| A | 0 | 30 | 2744 | 7.65 | 967 | 906 | 240.1 |
| B | 2 | 9 | 2816 | 10.25 | 945 | 904 | 186.5 |
| B | 2 | 8 | 2336 | 7.68 | 945 | 904 | 186.5 |
| B | 5 | 232 | 2330 | 7.65 | 945 | 904 | 186.5 |
| C | 1 | 80 | 2732 | 7.41 | 961 | 896 | 247.9 |
| C | 1 | 81 | 2697 | 7.27 | 961 | 896 | 247.9 |
| C | 12 | 241 | 2607 | 6.9 | 961 | 896 | 247.9 |
| D | 3 | 14 | 2289 | 6.24 | 884 | 807 | 237.4 |
| D | 6 | 231 | 2254 | 6.1 | 884 | 807 | 237.4 |
| D | 15 | 46 | 2240 | 6.04 | 884 | 807 | 237.4 |
Histogram calculated using DETX and DETY for each event in the final _common_clean file
| Quadrant A |  |
 |
Quadrant B |
|---|---|---|---|
| Quadrant D | 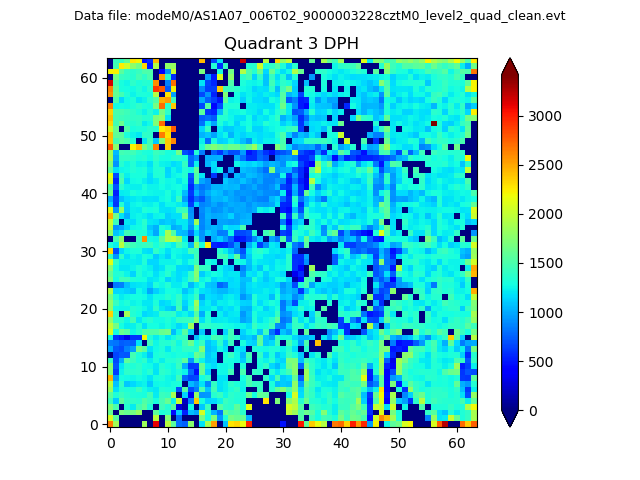 |
 |
Quadrant C |
| Plot type | Count rate plots | Images |
|---|---|---|
| Comparison with Poisson distribution Blue bars denote a histogram of data divided into 1 sec bins. Red curve is a Poisson curve with rate = median count rate of data. |
 |
 |
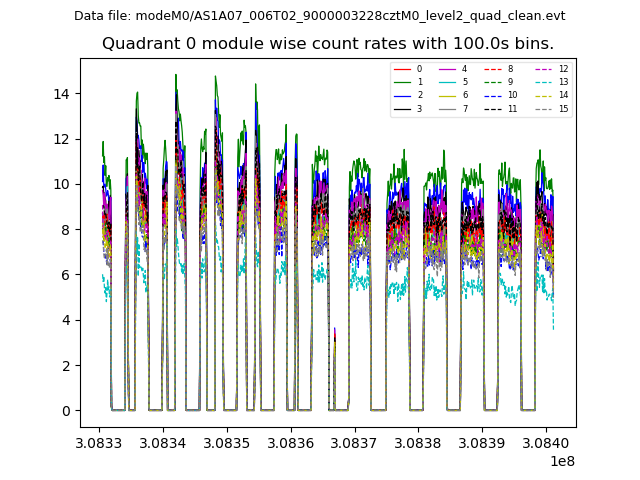
| Quadrant-wise count rates Data is divided into 100 sec bins |
 |
|
| Module-wise count rates for Quadrant A Data is divided into 100 sec bins |
 |
 |
| Module-wise count rates for Quadrant B Data is divided into 100 sec bins |
 |
 |
| Module-wise count rates for Quadrant C Data is divided into 100 sec bins |
 |
 |
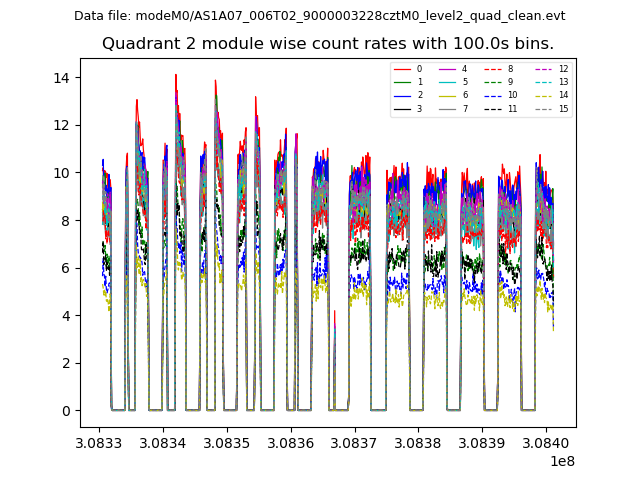
| Module-wise count rates for Quadrant D Data is divided into 100 sec bins |
 |
 |
| Parameter | Plot |
|---|---|
| CZT HV Monitor |  |
| D_VDD | 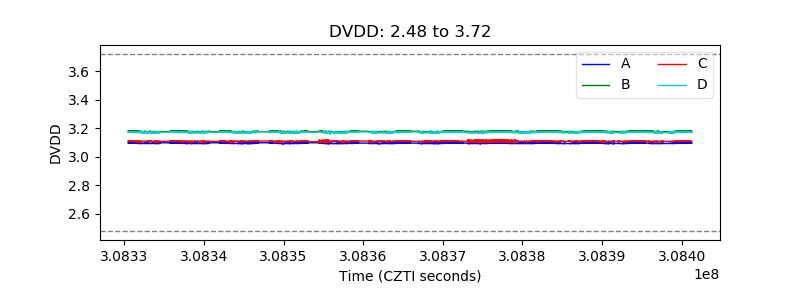 |
| Temperature 1 |  |
| Veto HV Monitor |  |
| Veto LLD | 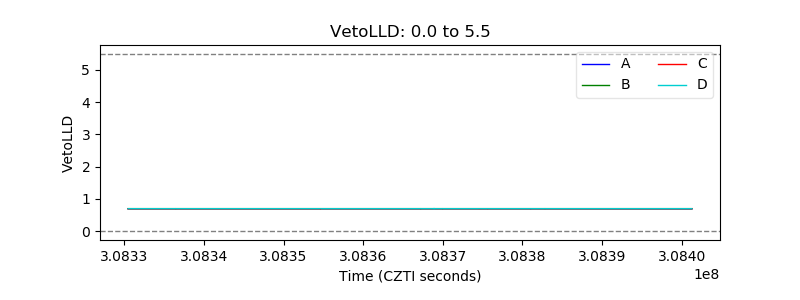 |
| Alpha Counter | 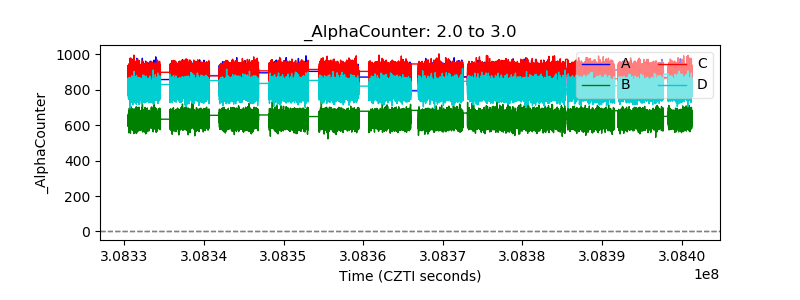 |
| _CPM_Rate |  |
| CZT Counter | 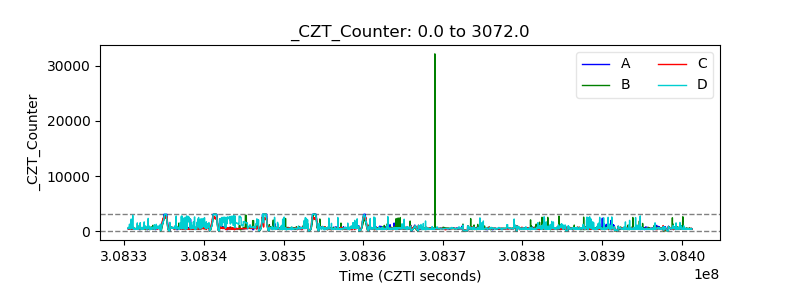 |
| +2.5 Volts monitor |  |
| +5 Volts monitor |  |
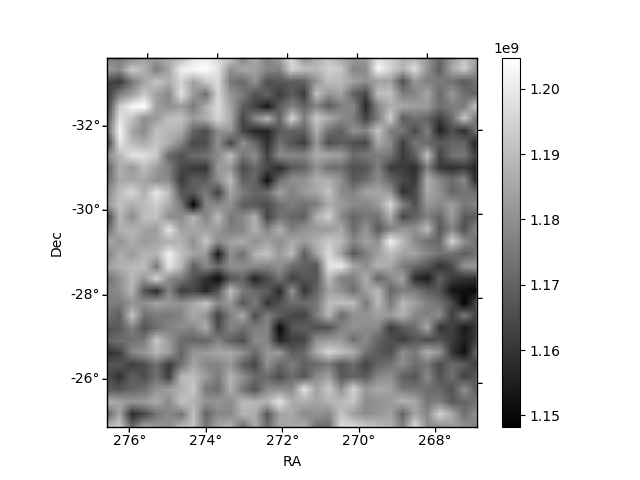
| _ROLL_ROT | 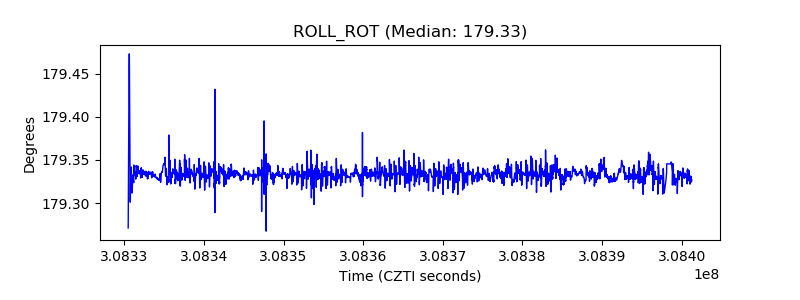 |
| _Roll_DEC |  |
| _Roll_RA |  |
| Veto Counter | 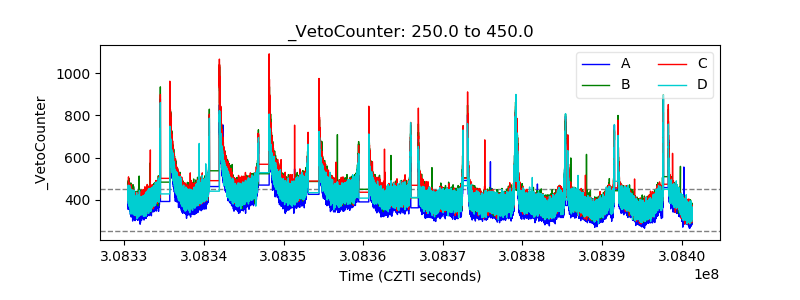 |