| Param | Original file | Final file |
|---|---|---|
| Filename | modeM0/AS1A07_006T02_9000003228_21794cztM0_level2.evt | modeM0/AS1A07_006T02_9000003228_21794cztM0_level2_quad_clean.evt |
| Size (bytes) | 15,667,200 | 4,703,040 |
| Size | 14.9 MB | 4.5 MB |
| Events in quadrant A | 103,030 | 30,223 |
| Events in quadrant B | 116,406 | 30,387 |
| Events in quadrant C | 103,504 | 29,262 |
| Events in quadrant D | 132,802 | 28,044 |
| Mode M0 | |||
|---|---|---|---|
| Quadrant | BADHDUFLAG | Total packets | Discarded packets |
| A | 0 | 446 | 0 |
| B | 0 | 471 | 0 |
| C | 0 | 452 | 0 |
| D | 0 | 536 | 0 |
| Mode SS | |||
|---|---|---|---|
| Quadrant | BADHDUFLAG | Total packets | Discarded packets |
| A | 0 | 4 | 0 |
| B | 0 | 4 | 0 |
| C | 0 | 4 | 0 |
| D | 0 | 4 | 0 |
| Quadrant | Total seconds | Saturated seconds | Saturation percentage |
|---|---|---|---|
| A | 223 | 0 | 0.000000% |
| B | 223 | 0 | 0.000000% |
| C | 223 | 0 | 0.000000% |
| D | 223 | 0 | 0.000000% |
Noise dominated data is calculated using 1-second bins in cleaned event files. If a bin has >2000 counts, and if more than 50% of those come from <1% of pixels, then it is considered to be noise-dominated and hence unusable.
| Quadrant | # 1 sec bins | Bins with >0 counts | Bins with >2000 counts | High rate bins dominated by noise | Noise dominated (total time) | Noise dominated (detector-on time) | Marked lightcurve |
|---|---|---|---|---|---|---|---|
| A | 223 | 223 | 0 | 0 | 0.00% | 0.00% | 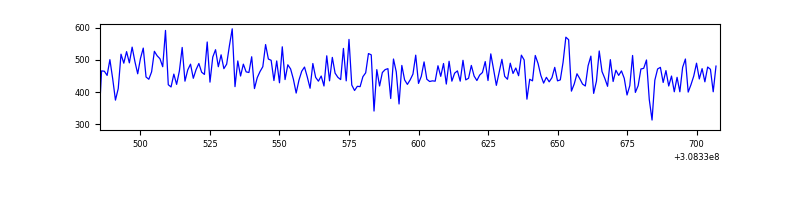 |
| B | 223 | 223 | 0 | 0 | 0.00% | 0.00% | 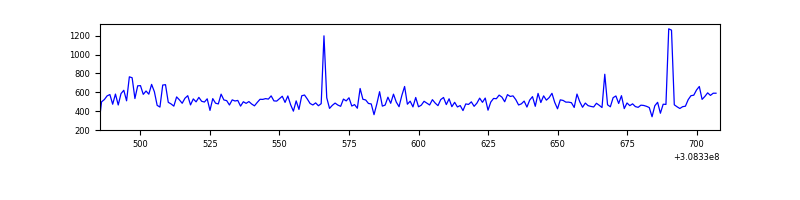 |
| C | 223 | 223 | 0 | 0 | 0.00% | 0.00% | 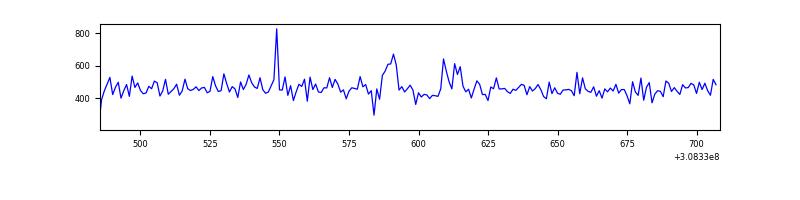 |
| D | 223 | 223 | 1 | 1 | 0.45% | 0.45% | 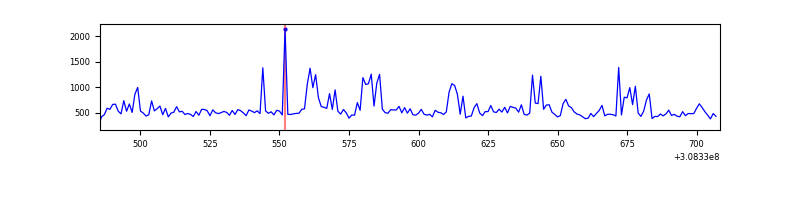 |
Top three noisy pixels from each quadrant. If the there are fewer than three noisy pixels in the level2.evt file, extra rows are filled as -1
| Pixel properties | Quadrant properties | ||||||
|---|---|---|---|---|---|---|---|
| Quadrant | DetID | PixID | Counts | Sigma | Mean | Median | Sigma |
| A | 13 | 254 | 389 | 48.59 | 26 | 26 | 7.5 |
| A | 2 | 79 | 259 | 31.19 | 26 | 26 | 7.5 |
| A | 0 | 226 | 245 | 29.31 | 26 | 26 | 7.5 |
| B | 0 | 190 | 3568 | 490.52 | 26 | 26 | 7.2 |
| B | 0 | 189 | 2963 | 406.74 | 26 | 26 | 7.2 |
| B | 3 | 64 | 2112 | 288.88 | 26 | 26 | 7.2 |
| C | 14 | 238 | 3808 | 486.26 | 25 | 25 | 7.8 |
| C | 10 | 22 | 1478 | 186.76 | 25 | 25 | 7.8 |
| C | 13 | 61 | 187 | 20.82 | 25 | 25 | 7.8 |
| D | 1 | 52 | 17639 | 2168.22 | 25 | 24 | 8.1 |
| D | 7 | 238 | 14552 | 1788.24 | 25 | 24 | 8.1 |
| D | 2 | 153 | 1723 | 209.13 | 25 | 24 | 8.1 |
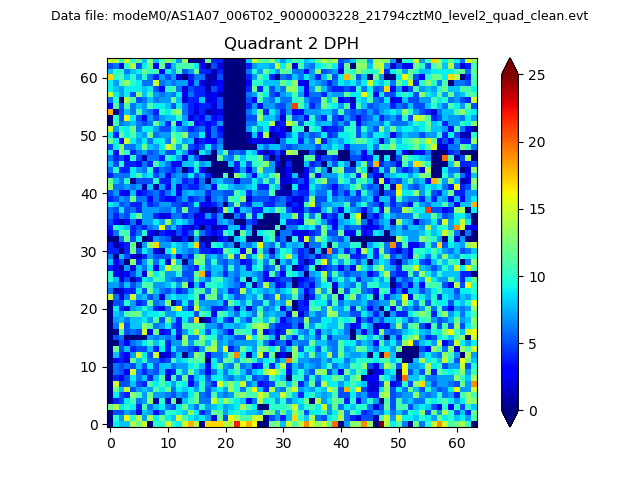
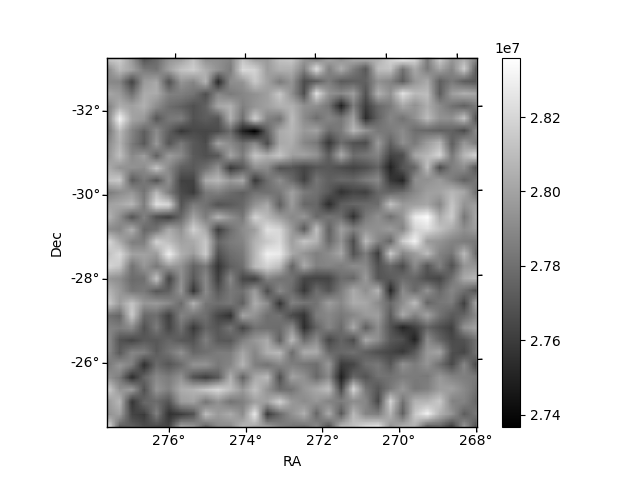
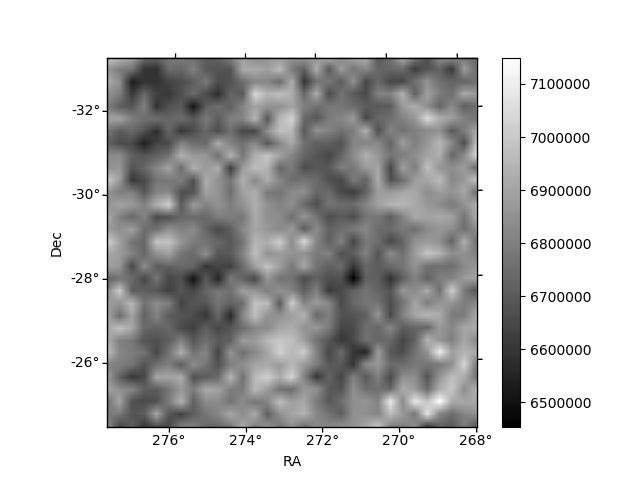
Histogram calculated using DETX and DETY for each event in the final _common_clean file
| Quadrant A | 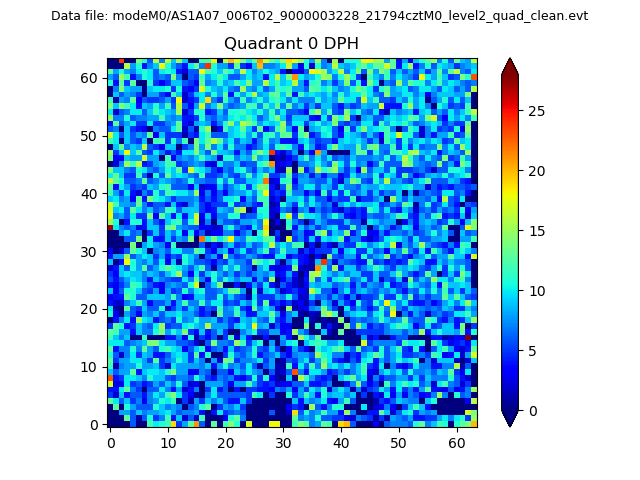 |
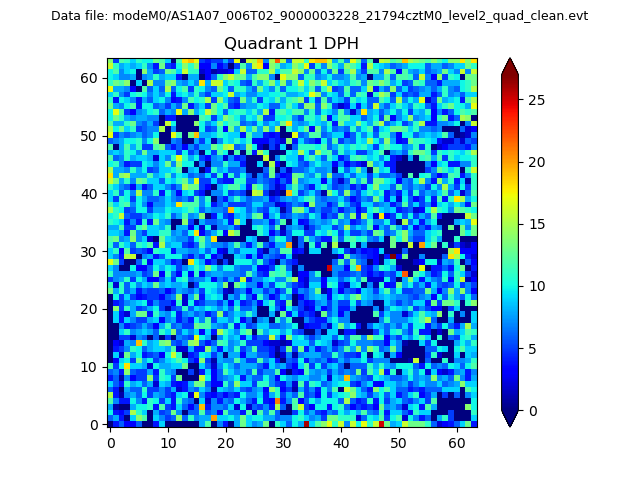 |
Quadrant B |
|---|---|---|---|
| Quadrant D | 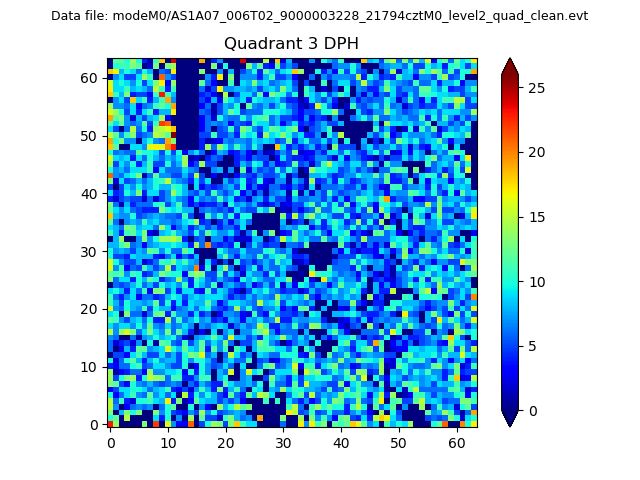 |
 |
Quadrant C |
| Plot type | Count rate plots | Images |
|---|---|---|
| Comparison with Poisson distribution Blue bars denote a histogram of data divided into 1 sec bins. Red curve is a Poisson curve with rate = median count rate of data. |
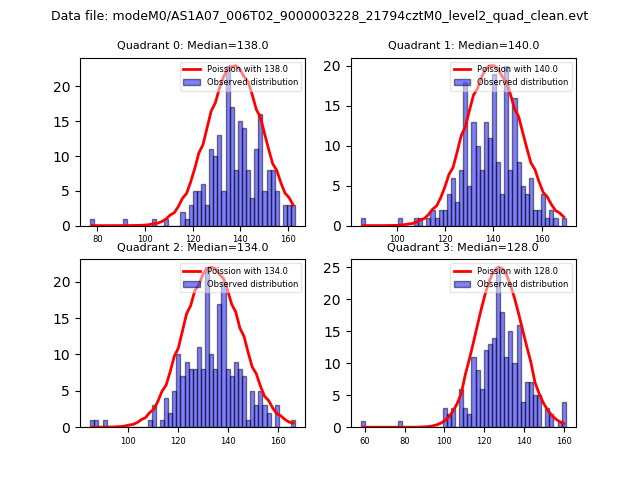 |
 |
| Quadrant-wise count rates Data is divided into 100 sec bins |
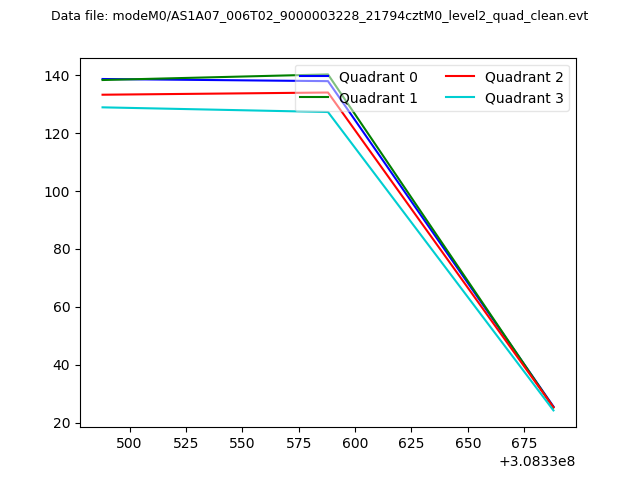 |
|
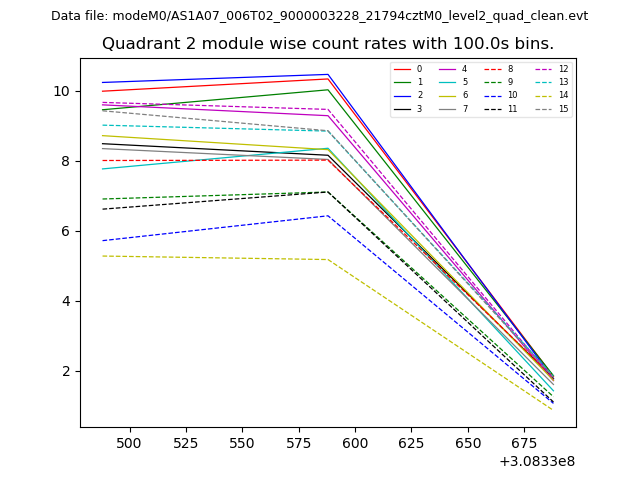
| Module-wise count rates for Quadrant A Data is divided into 100 sec bins |
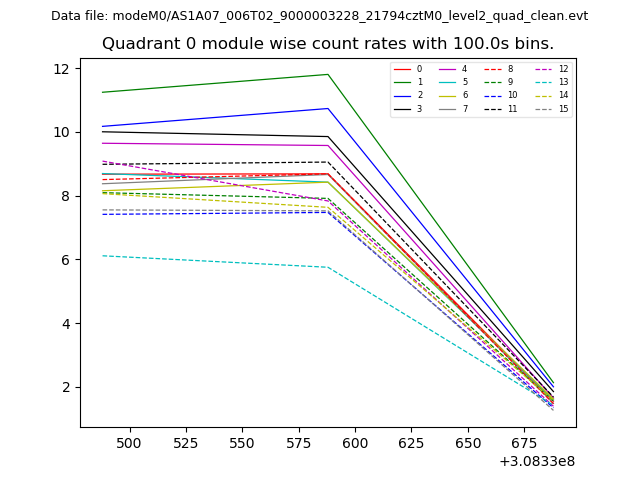 |
 |
| Module-wise count rates for Quadrant B Data is divided into 100 sec bins |
 |
 |
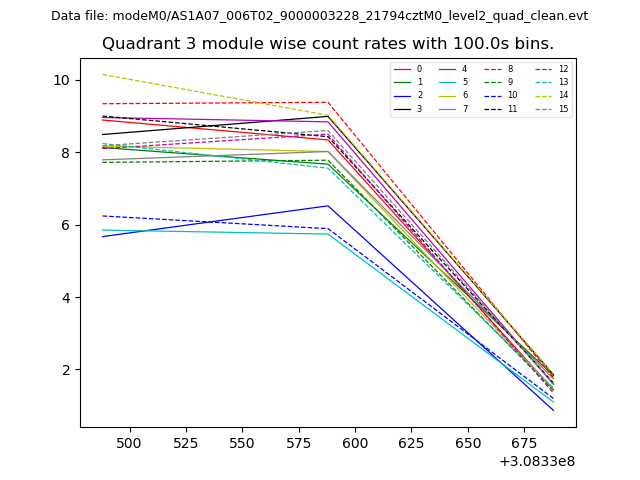
| Module-wise count rates for Quadrant C Data is divided into 100 sec bins |
 |
 |
| Module-wise count rates for Quadrant D Data is divided into 100 sec bins |
 |
 |
| Parameter | Plot |
|---|---|
| CZT HV Monitor |  |
| D_VDD | 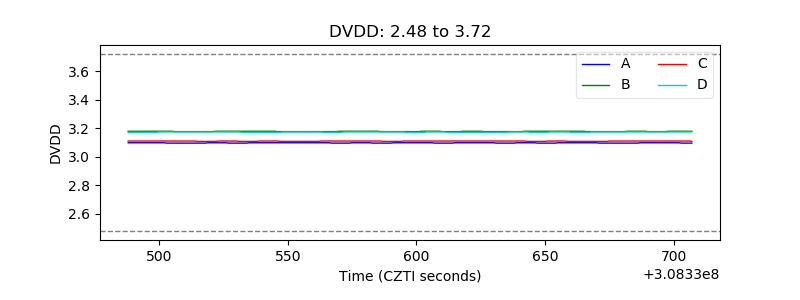 |
| Temperature 1 | 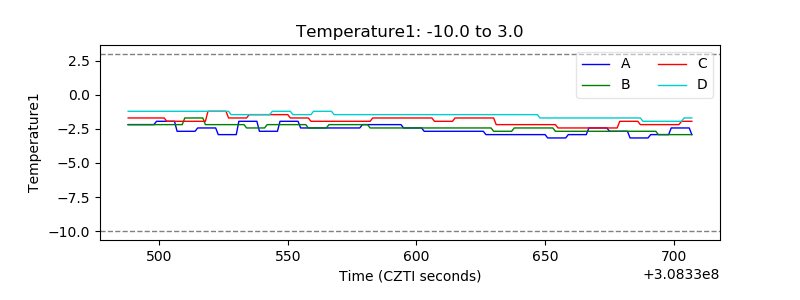 |
| Veto HV Monitor | 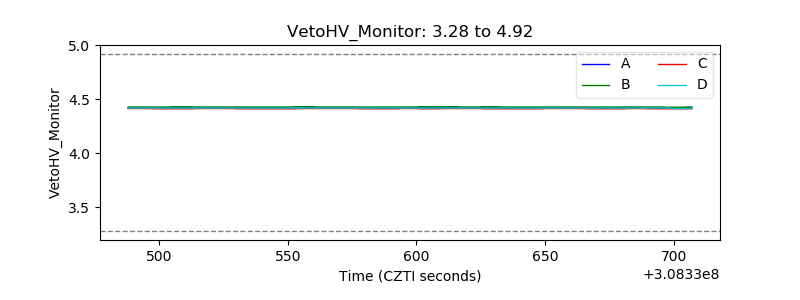 |
| Veto LLD | 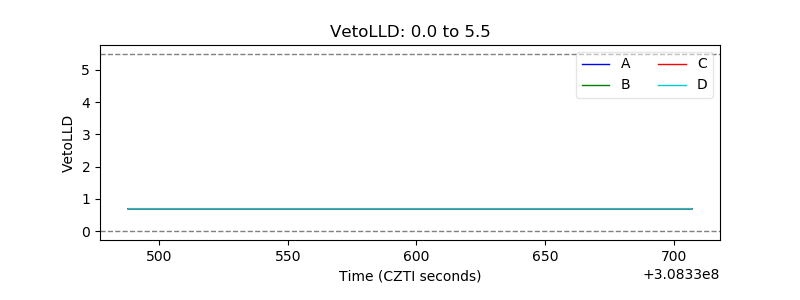 |
| Alpha Counter | 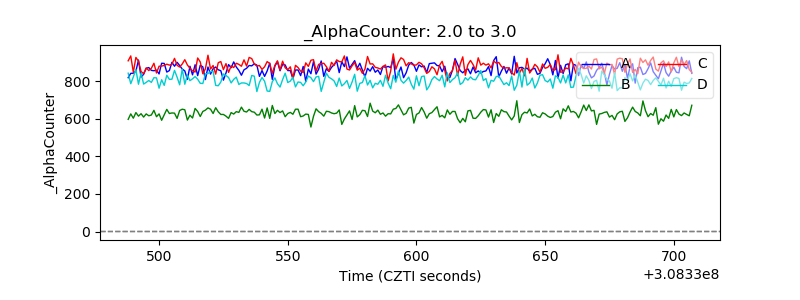 |
| _CPM_Rate | 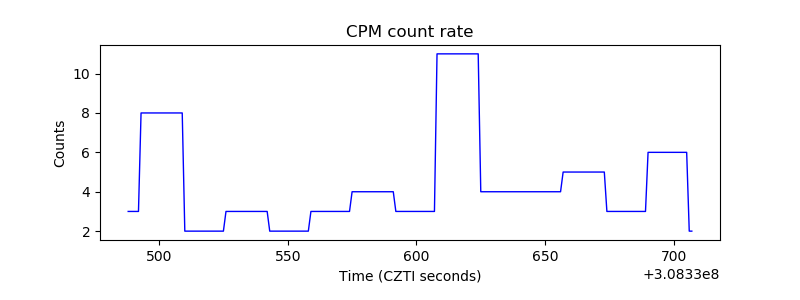 |
| CZT Counter |  |
| +2.5 Volts monitor |  |
| +5 Volts monitor |  |
| _ROLL_ROT | 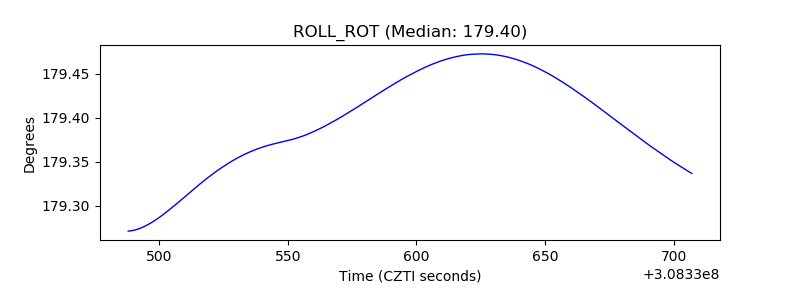 |
| _Roll_DEC | 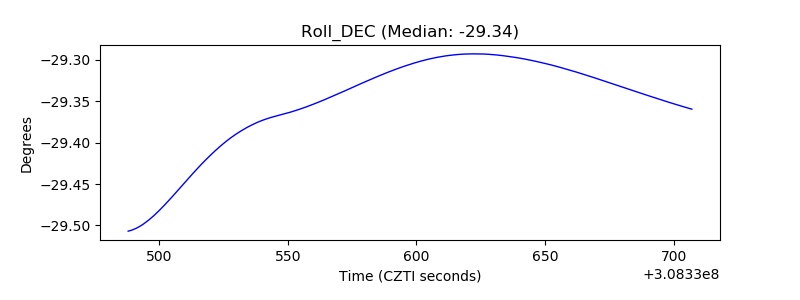 |
| _Roll_RA | 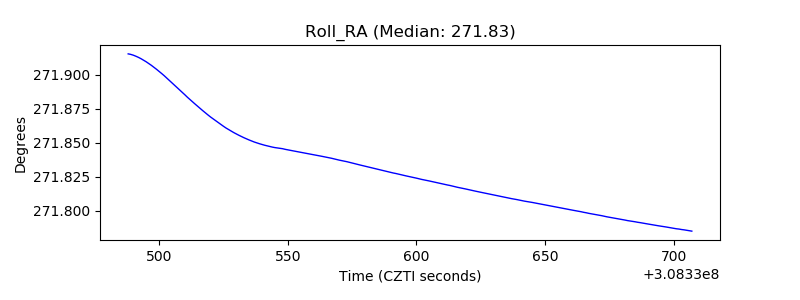 |
| Veto Counter | 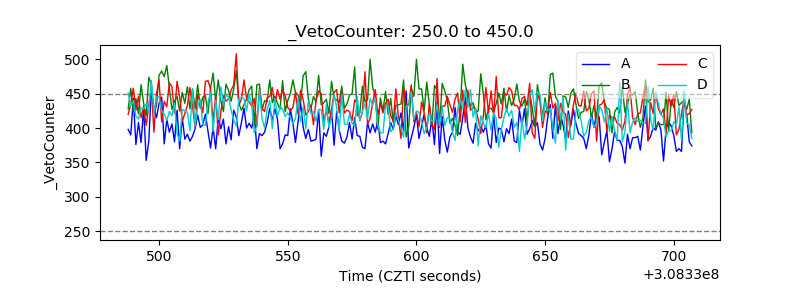 |