| Param | Original file | Final file |
|---|---|---|
| Filename | modeM0/AS1A07_006T02_9000003228_21799cztM0_level2.evt | modeM0/AS1A07_006T02_9000003228_21799cztM0_level2_quad_clean.evt |
| Size (bytes) | 448,568,640 | 84,853,440 |
| Size | 427.8 MB | 80.9 MB |
| Events in quadrant A | 3,218,133 | 543,326 |
| Events in quadrant B | 3,409,972 | 562,412 |
| Events in quadrant C | 3,131,039 | 533,730 |
| Events in quadrant D | 3,411,265 | 503,998 |
| Mode M0 | |||
|---|---|---|---|
| Quadrant | BADHDUFLAG | Total packets | Discarded packets |
| A | 0 | 13233 | 4 |
| B | 0 | 13753 | 2 |
| C | 0 | 12791 | 2 |
| D | 0 | 13979 | 2 |
| Mode M9 | |||
|---|---|---|---|
| Quadrant | BADHDUFLAG | Total packets | Discarded packets |
| A | 0 | 23 | 0 |
| B | 0 | 24 | 0 |
| C | 0 | 24 | 0 |
| D | 0 | 24 | 0 |
| Mode SS | |||
|---|---|---|---|
| Quadrant | BADHDUFLAG | Total packets | Discarded packets |
| A | 0 | 124 | 0 |
| B | 0 | 124 | 0 |
| C | 0 | 124 | 0 |
| D | 0 | 124 | 0 |
| Quadrant | Total seconds | Saturated seconds | Saturation percentage |
|---|---|---|---|
| A | 6103 | 19 | 0.311322% |
| B | 6103 | 55 | 0.901196% |
| C | 6103 | 37 | 0.606259% |
| D | 6103 | 116 | 1.900705% |
Noise dominated data is calculated using 1-second bins in cleaned event files. If a bin has >2000 counts, and if more than 50% of those come from <1% of pixels, then it is considered to be noise-dominated and hence unusable.
| Quadrant | # 1 sec bins | Bins with >0 counts | Bins with >2000 counts | High rate bins dominated by noise | Noise dominated (total time) | Noise dominated (detector-on time) | Marked lightcurve |
|---|---|---|---|---|---|---|---|
| A | 7468 | 6104 | 3 | 3 | 0.04% | 0.05% | 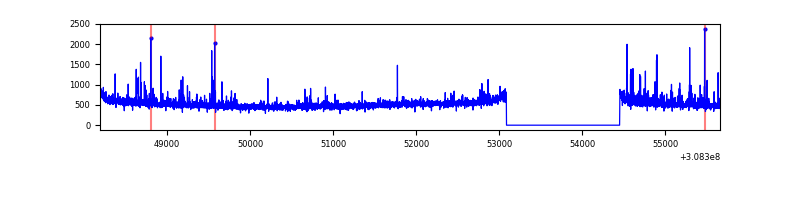 |
| B | 7468 | 6104 | 17 | 17 | 0.23% | 0.28% | 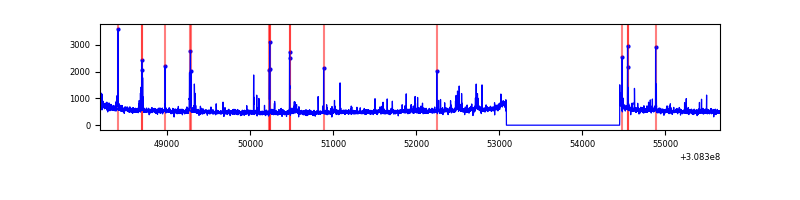 |
| C | 7468 | 6104 | 0 | 0 | 0.00% | 0.00% | 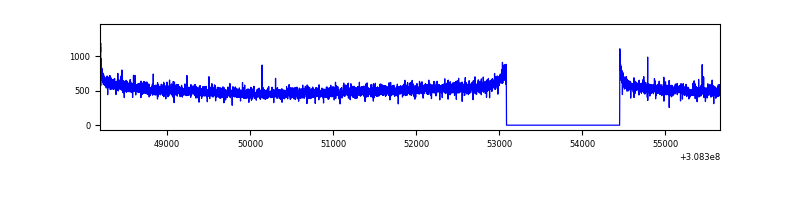 |
| D | 7468 | 6104 | 70 | 70 | 0.94% | 1.15% | 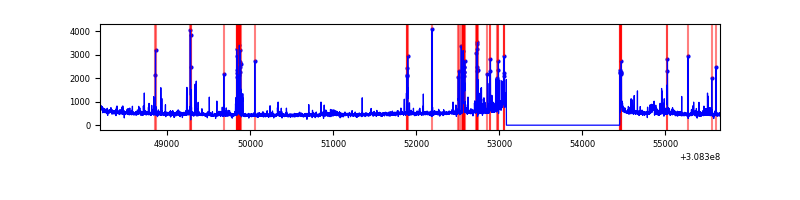 |
Top three noisy pixels from each quadrant. If the there are fewer than three noisy pixels in the level2.evt file, extra rows are filled as -1
| Pixel properties | Quadrant properties | ||||||
|---|---|---|---|---|---|---|---|
| Quadrant | DetID | PixID | Counts | Sigma | Mean | Median | Sigma |
| A | 6 | 16 | 136180 | 847.55 | 799 | 784 | 159.7 |
| A | 13 | 254 | 11935 | 69.8 | 799 | 784 | 159.7 |
| A | 0 | 226 | 6994 | 38.87 | 799 | 784 | 159.7 |
| B | 3 | 64 | 106453 | 696.79 | 807 | 790 | 151.6 |
| B | 4 | 216 | 54870 | 356.63 | 807 | 790 | 151.6 |
| B | 0 | 197 | 28025 | 179.6 | 807 | 790 | 151.6 |
| C | 14 | 238 | 122637 | 678.61 | 769 | 775 | 179.6 |
| C | 0 | 10 | 6006 | 29.13 | 769 | 775 | 179.6 |
| C | 13 | 61 | 5394 | 25.72 | 769 | 775 | 179.6 |
| D | 13 | 153 | 163805 | 883.4 | 762 | 741 | 184.6 |
| D | 7 | 238 | 131328 | 707.46 | 762 | 741 | 184.6 |
| D | 1 | 52 | 69467 | 372.32 | 762 | 741 | 184.6 |
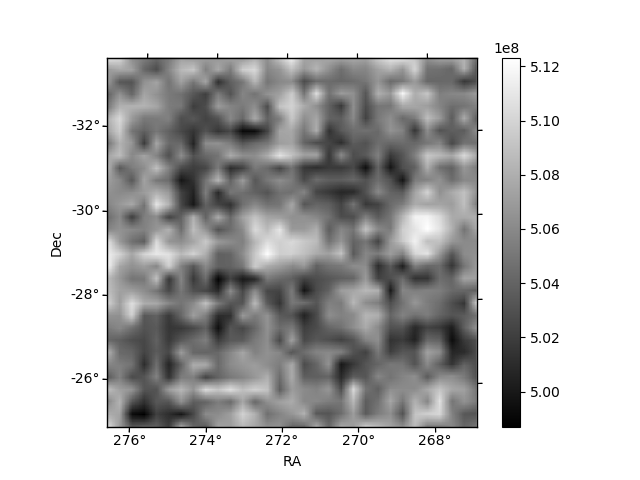
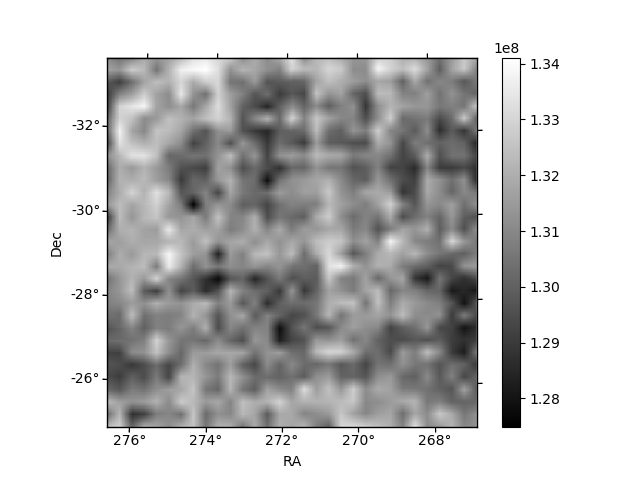
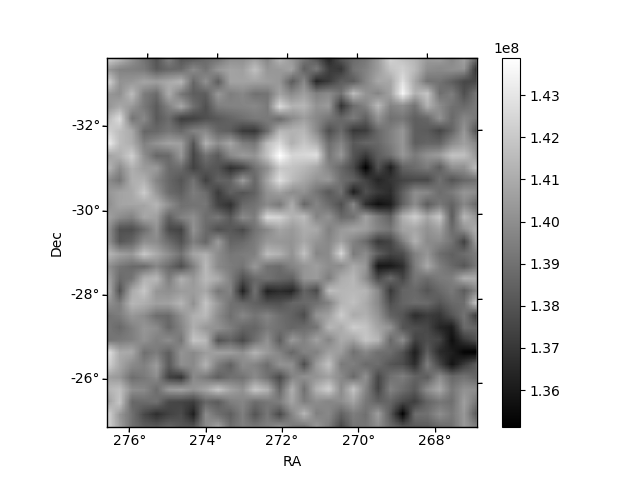
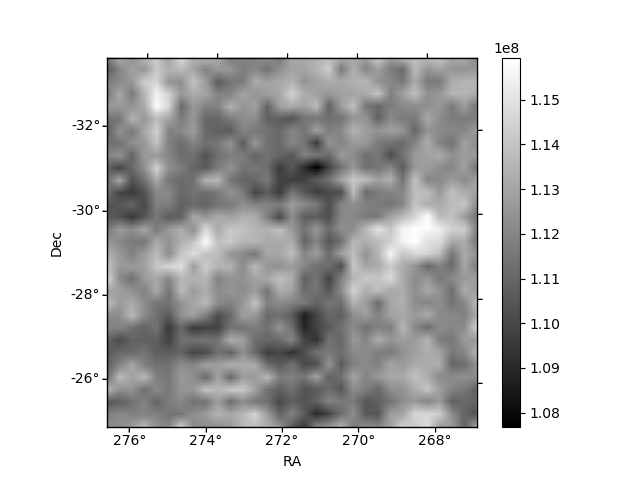
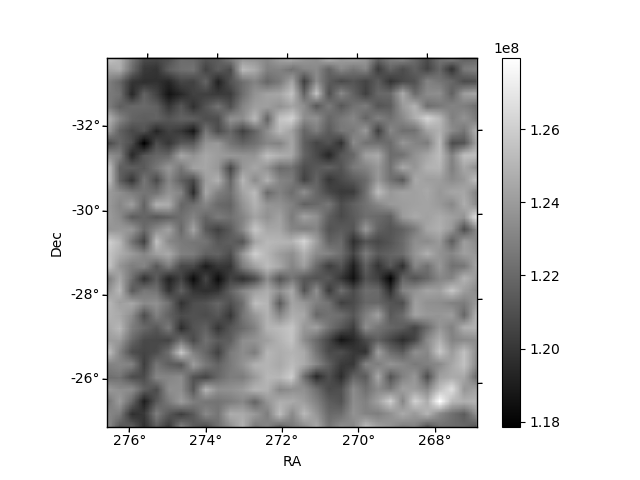
Histogram calculated using DETX and DETY for each event in the final _common_clean file
| Quadrant A | 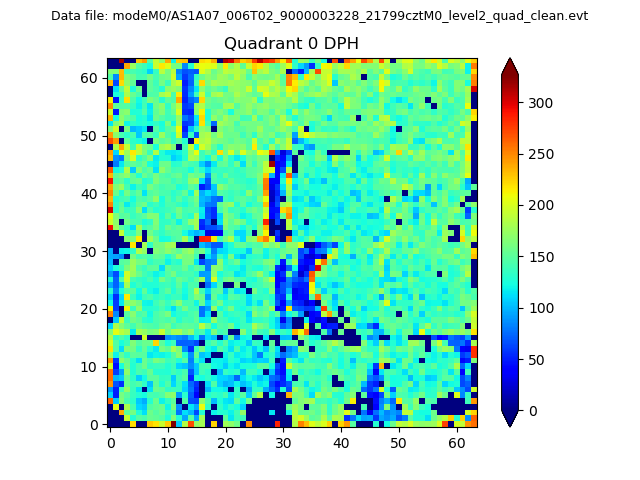 |
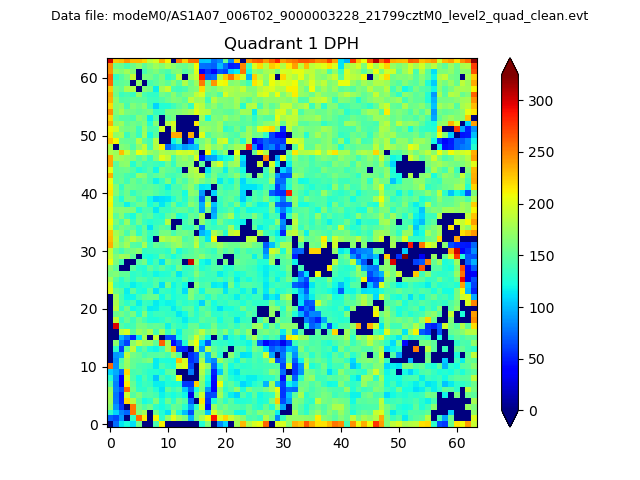 |
Quadrant B |
|---|---|---|---|
| Quadrant D |  |
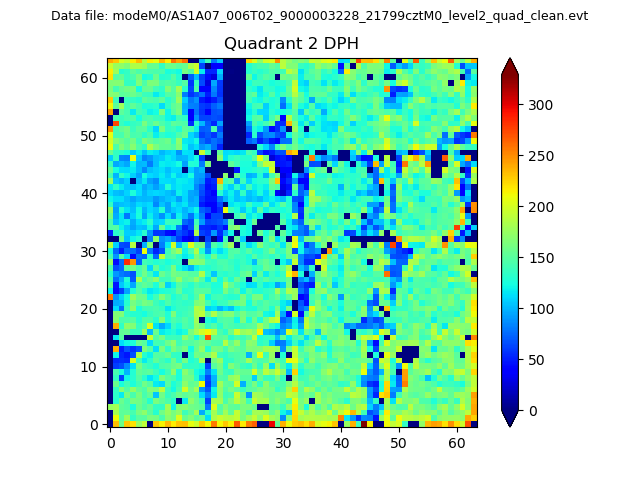 |
Quadrant C |
| Plot type | Count rate plots | Images |
|---|---|---|
| Comparison with Poisson distribution Blue bars denote a histogram of data divided into 1 sec bins. Red curve is a Poisson curve with rate = median count rate of data. |
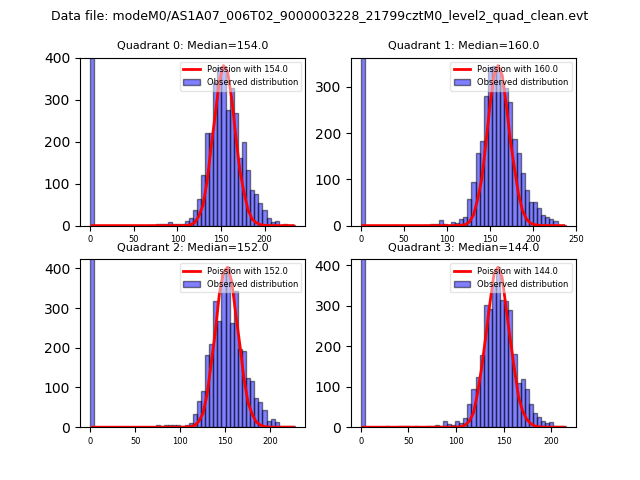 |
 |
| Quadrant-wise count rates Data is divided into 100 sec bins |
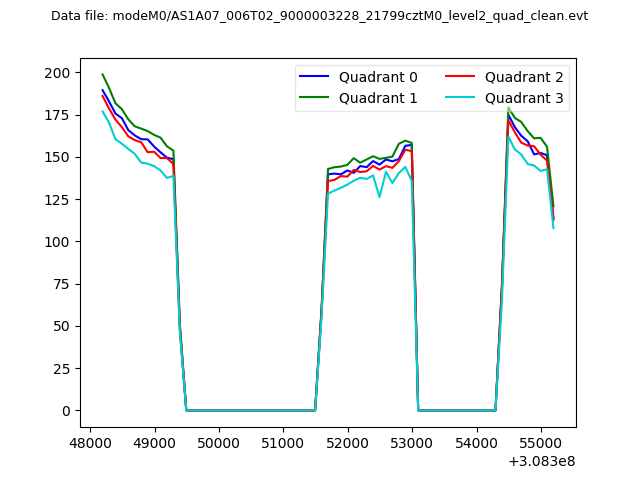 |
|
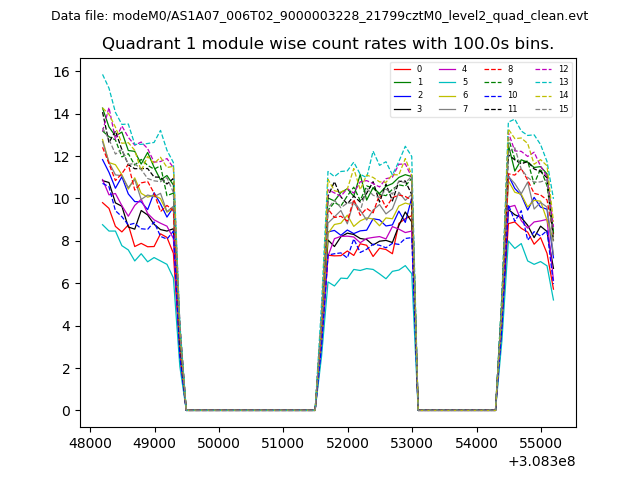
| Module-wise count rates for Quadrant A Data is divided into 100 sec bins |
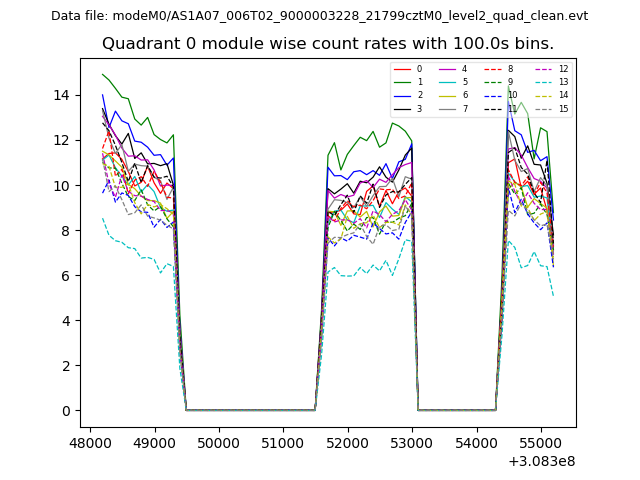 |
 |
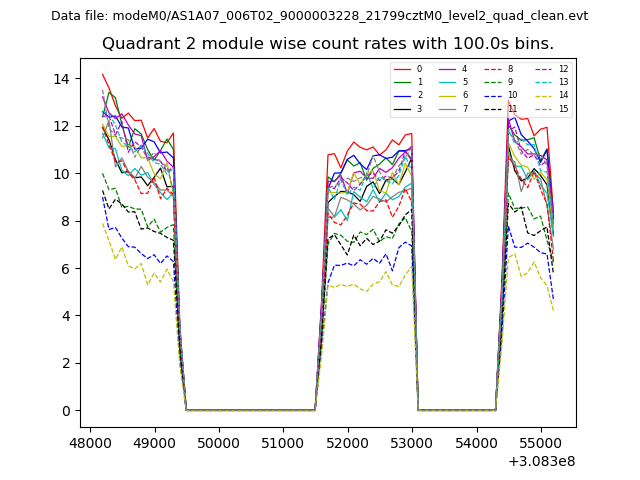
| Module-wise count rates for Quadrant B Data is divided into 100 sec bins |
 |
 |
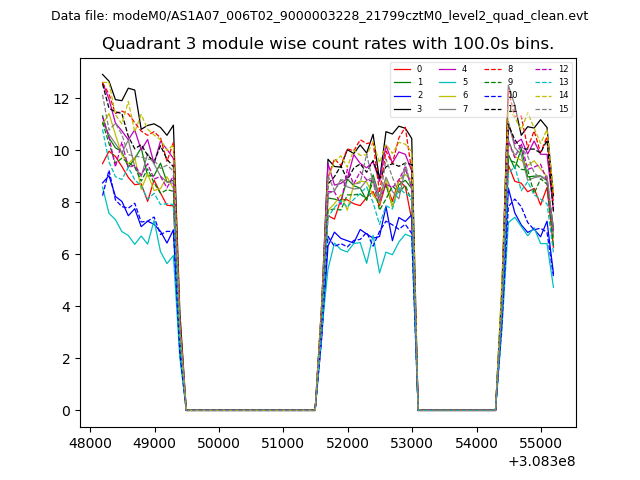
| Module-wise count rates for Quadrant C Data is divided into 100 sec bins |
 |
 |
| Module-wise count rates for Quadrant D Data is divided into 100 sec bins |
 |
 |
| Parameter | Plot |
|---|---|
| CZT HV Monitor | 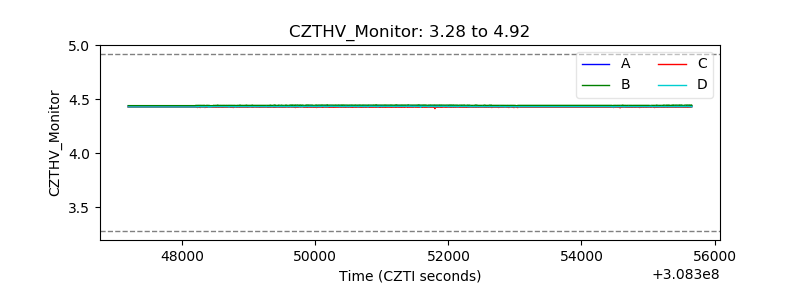 |
| D_VDD | 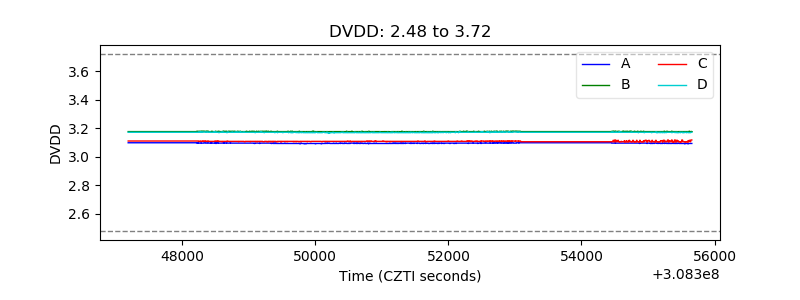 |
| Temperature 1 | 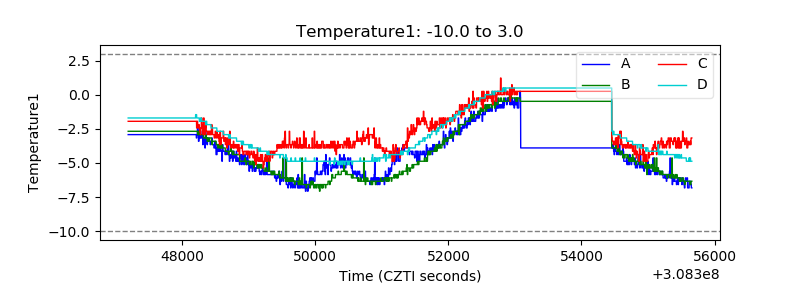 |
| Veto HV Monitor | 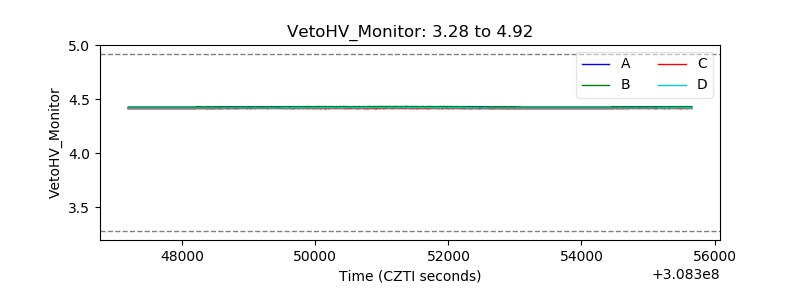 |
| Veto LLD | 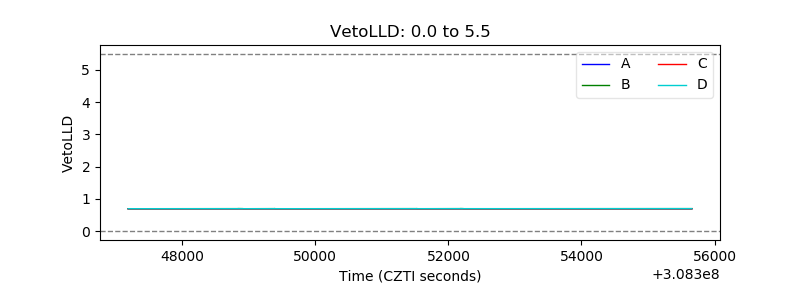 |
| Alpha Counter | 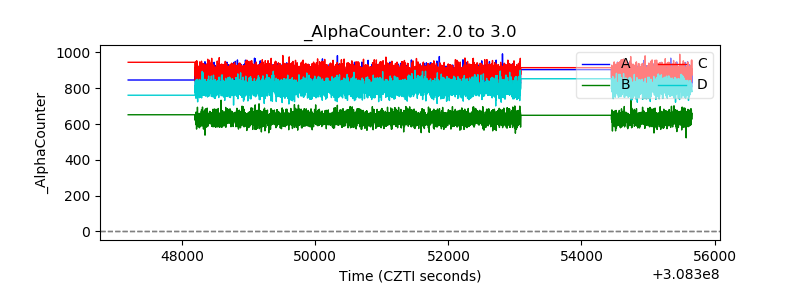 |
| _CPM_Rate | 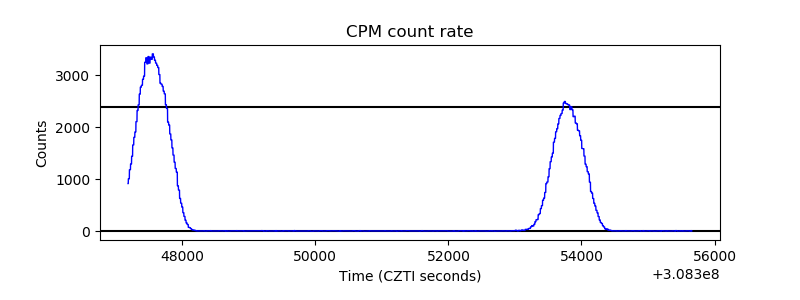 |
| CZT Counter | 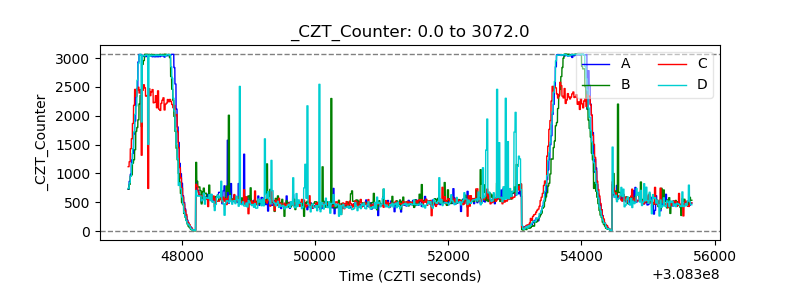 |
| +2.5 Volts monitor |  |
| +5 Volts monitor |  |
| _ROLL_ROT |  |
| _Roll_DEC | 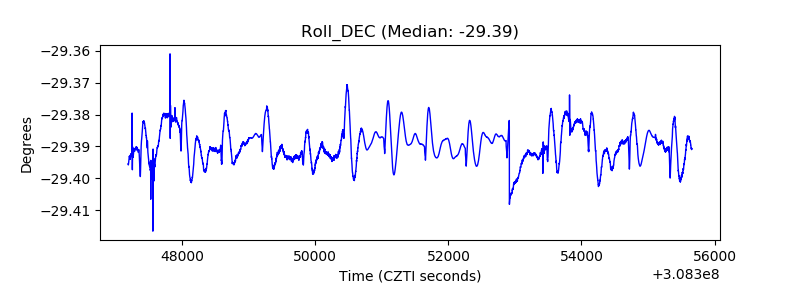 |
| _Roll_RA | 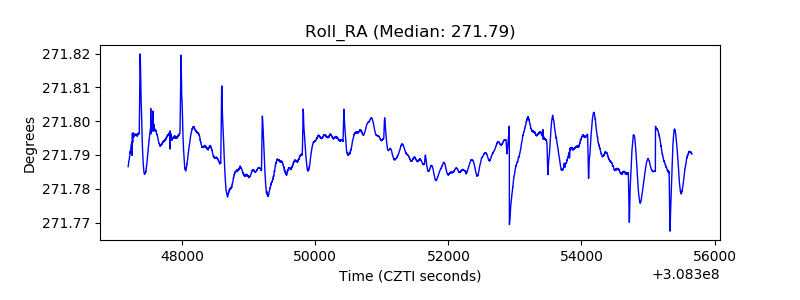 |
| Veto Counter | 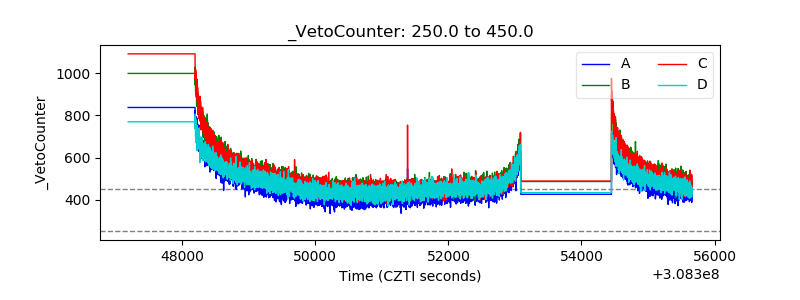 |