| Param | Original file | Final file |
|---|---|---|
| Filename | modeM0/AS1A07_006T02_9000003228_21800cztM0_level2.evt | modeM0/AS1A07_006T02_9000003228_21800cztM0_level2_quad_clean.evt |
| Size (bytes) | 465,920,640 | 76,348,800 |
| Size | 444.3 MB | 72.8 MB |
| Events in quadrant A | 3,378,067 | 468,478 |
| Events in quadrant B | 3,436,021 | 483,357 |
| Events in quadrant C | 3,280,696 | 463,507 |
| Events in quadrant D | 3,570,254 | 439,275 |
| Mode M0 | |||
|---|---|---|---|
| Quadrant | BADHDUFLAG | Total packets | Discarded packets |
| A | 0 | 14023 | 2 |
| B | 0 | 14049 | 2 |
| C | 0 | 13546 | 2 |
| D | 0 | 14849 | 2 |
| Mode M9 | |||
|---|---|---|---|
| Quadrant | BADHDUFLAG | Total packets | Discarded packets |
| A | 0 | 18 | 0 |
| B | 0 | 19 | 0 |
| C | 0 | 19 | 0 |
| D | 0 | 19 | 0 |
| Mode SS | |||
|---|---|---|---|
| Quadrant | BADHDUFLAG | Total packets | Discarded packets |
| A | 0 | 132 | 0 |
| B | 0 | 132 | 0 |
| C | 0 | 132 | 0 |
| D | 0 | 132 | 0 |
| Quadrant | Total seconds | Saturated seconds | Saturation percentage |
|---|---|---|---|
| A | 6559 | 18 | 0.274432% |
| B | 6559 | 39 | 0.594603% |
| C | 6559 | 44 | 0.670834% |
| D | 6559 | 102 | 1.555115% |
Noise dominated data is calculated using 1-second bins in cleaned event files. If a bin has >2000 counts, and if more than 50% of those come from <1% of pixels, then it is considered to be noise-dominated and hence unusable.
| Quadrant | # 1 sec bins | Bins with >0 counts | Bins with >2000 counts | High rate bins dominated by noise | Noise dominated (total time) | Noise dominated (detector-on time) | Marked lightcurve |
|---|---|---|---|---|---|---|---|
| A | 7829 | 6560 | 2 | 2 | 0.03% | 0.03% | 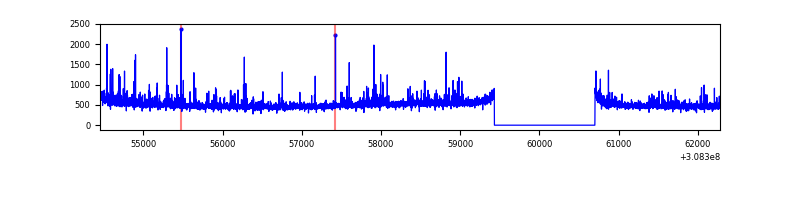 |
| B | 7829 | 6560 | 13 | 13 | 0.17% | 0.20% | 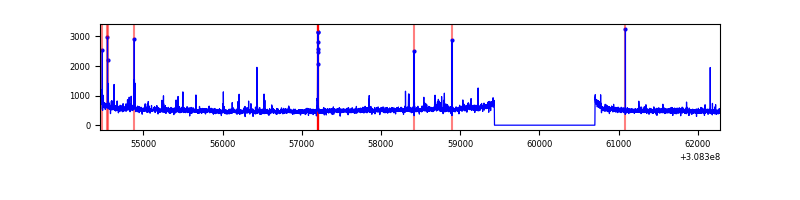 |
| C | 7829 | 6560 | 0 | 0 | 0.00% | 0.00% | 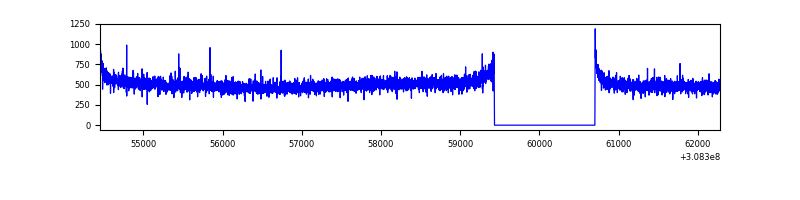 |
| D | 7829 | 6560 | 65 | 65 | 0.83% | 0.99% |  |
Top three noisy pixels from each quadrant. If the there are fewer than three noisy pixels in the level2.evt file, extra rows are filled as -1
| Pixel properties | Quadrant properties | ||||||
|---|---|---|---|---|---|---|---|
| Quadrant | DetID | PixID | Counts | Sigma | Mean | Median | Sigma |
| A | 6 | 16 | 169020 | 1011.49 | 830 | 815 | 166.3 |
| A | 13 | 254 | 12239 | 68.7 | 830 | 815 | 166.3 |
| A | 0 | 226 | 7271 | 38.82 | 830 | 815 | 166.3 |
| B | 3 | 64 | 75844 | 476.81 | 841 | 822 | 157.3 |
| B | 12 | 111 | 18096 | 109.79 | 841 | 822 | 157.3 |
| B | 11 | 111 | 15911 | 95.9 | 841 | 822 | 157.3 |
| C | 14 | 238 | 127983 | 677.55 | 806 | 813 | 187.7 |
| C | 13 | 61 | 5649 | 25.77 | 806 | 813 | 187.7 |
| C | 0 | 10 | 4441 | 19.33 | 806 | 813 | 187.7 |
| D | 1 | 52 | 204502 | 1039.16 | 802 | 781 | 196.0 |
| D | 13 | 153 | 153064 | 776.78 | 802 | 781 | 196.0 |
| D | 13 | 104 | 66347 | 334.45 | 802 | 781 | 196.0 |
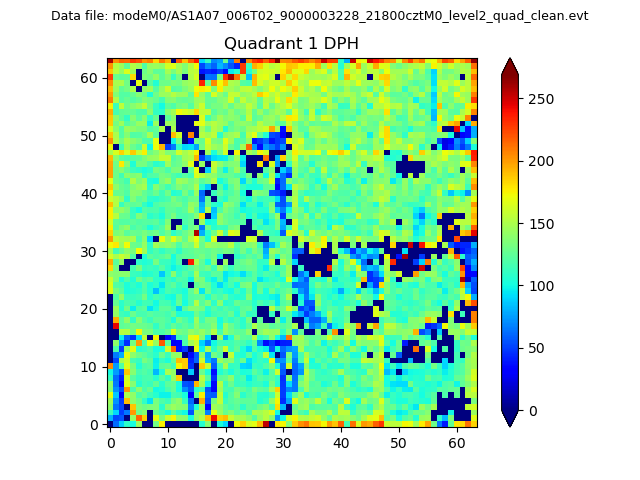
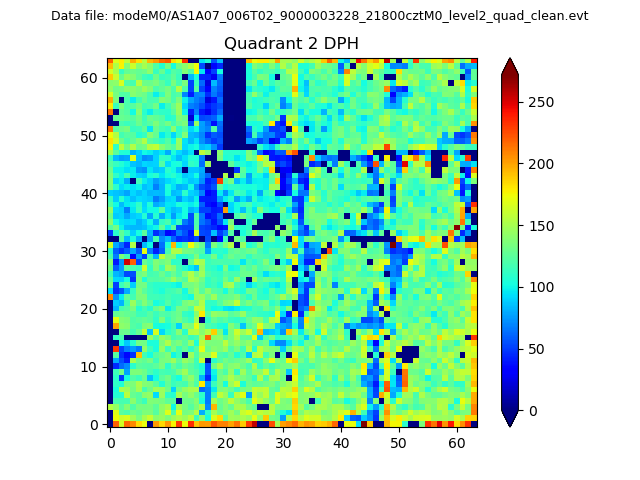
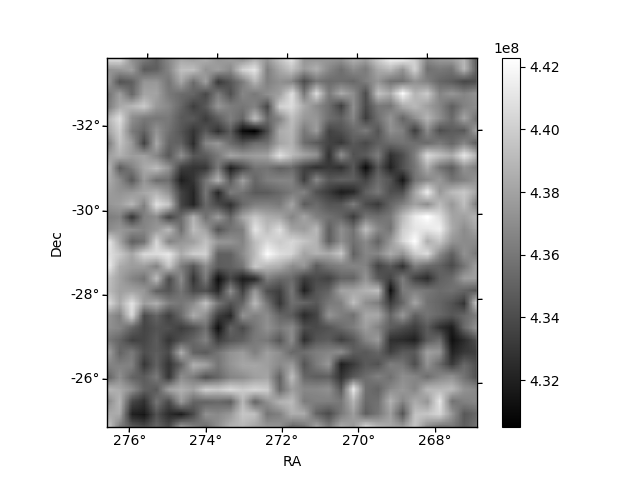
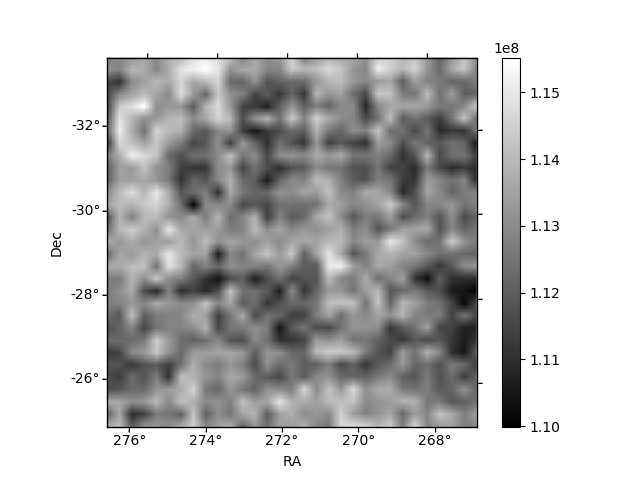
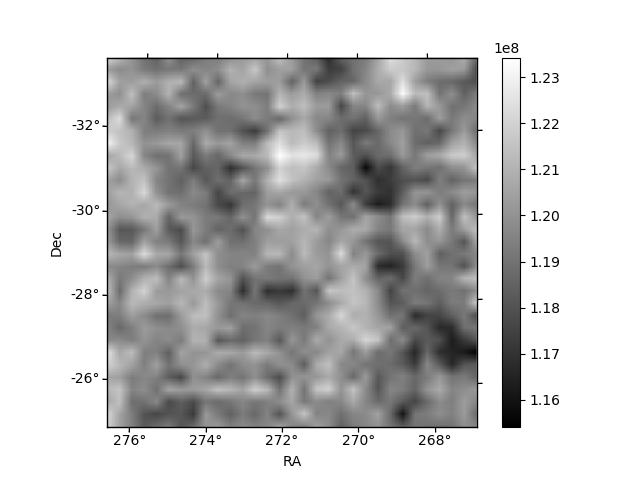
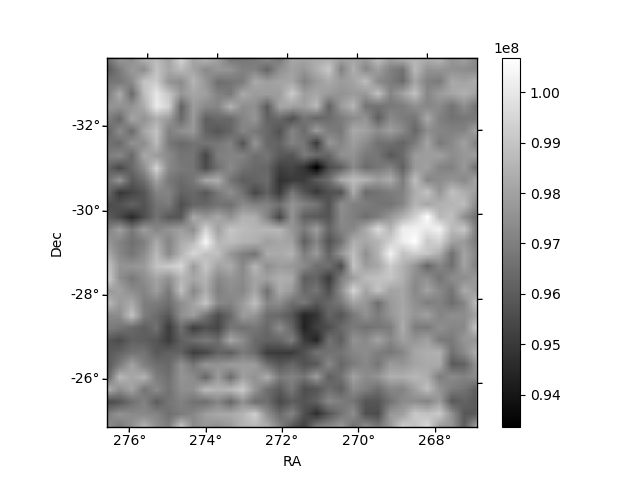
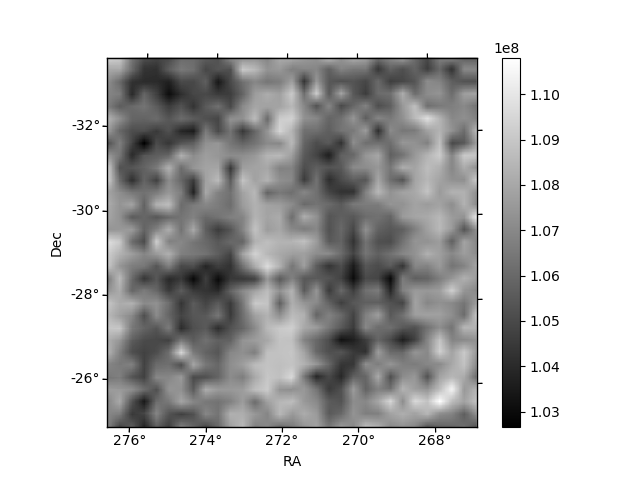
Histogram calculated using DETX and DETY for each event in the final _common_clean file
| Quadrant A | 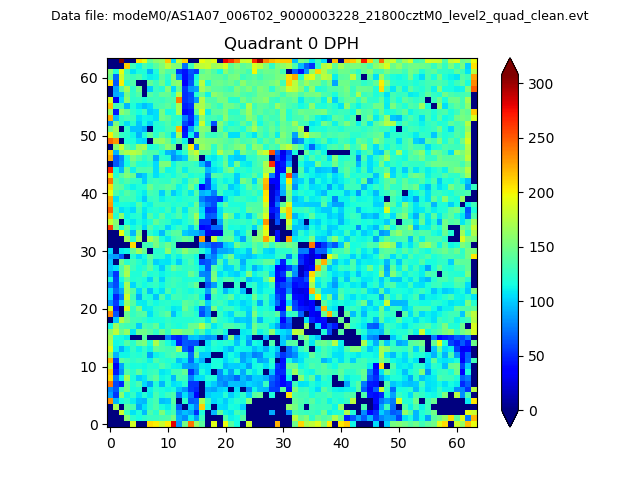 |
 |
Quadrant B |
|---|---|---|---|
| Quadrant D | 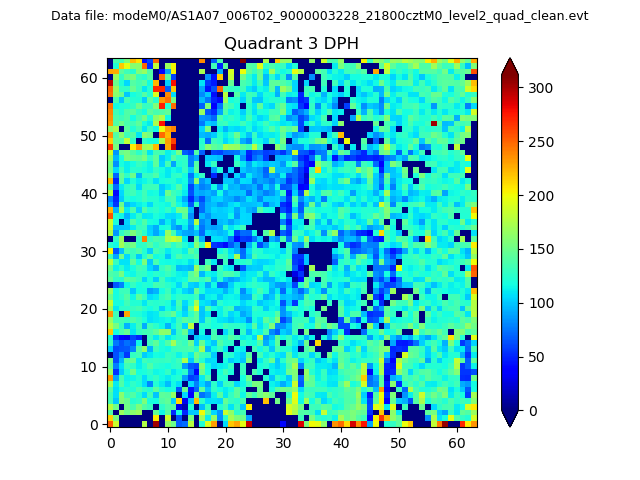 |
 |
Quadrant C |
| Plot type | Count rate plots | Images |
|---|---|---|
| Comparison with Poisson distribution Blue bars denote a histogram of data divided into 1 sec bins. Red curve is a Poisson curve with rate = median count rate of data. |
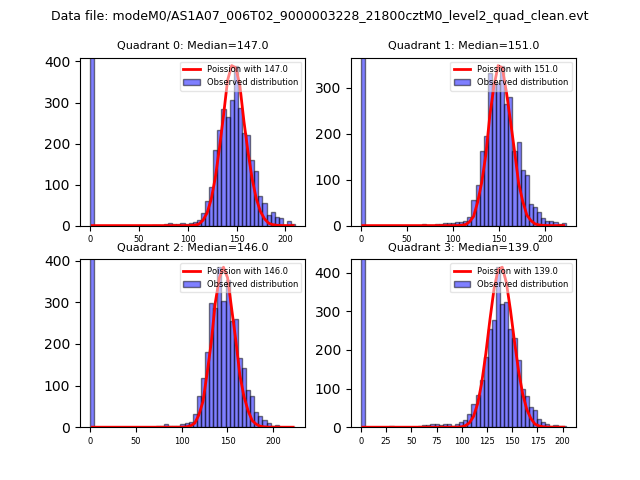 |
 |
| Quadrant-wise count rates Data is divided into 100 sec bins |
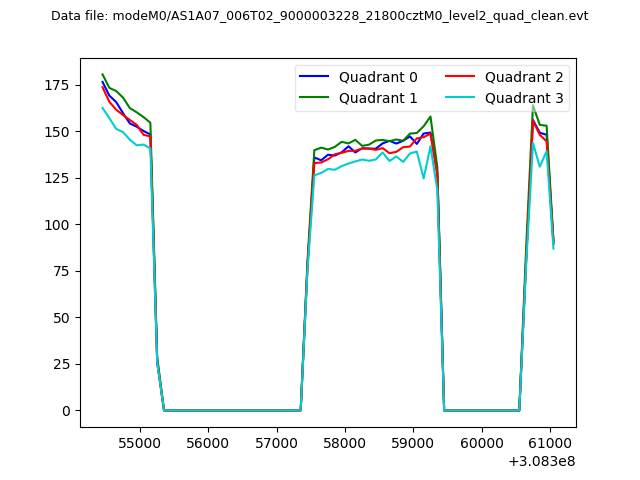 |
|
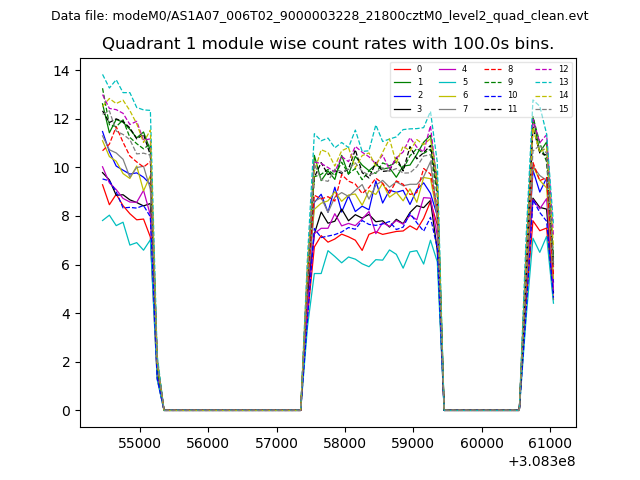
| Module-wise count rates for Quadrant A Data is divided into 100 sec bins |
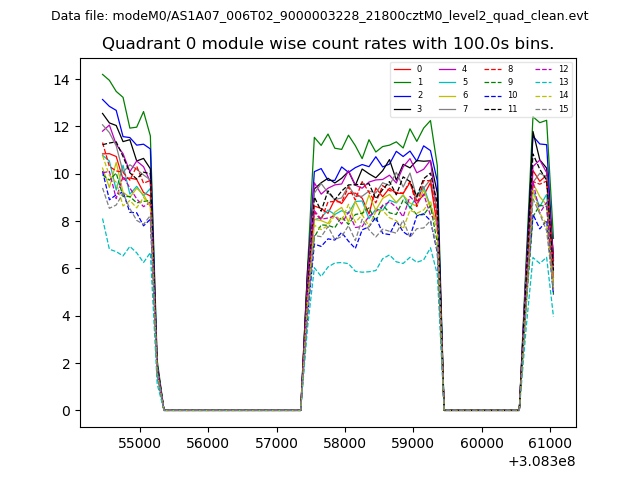 |
 |
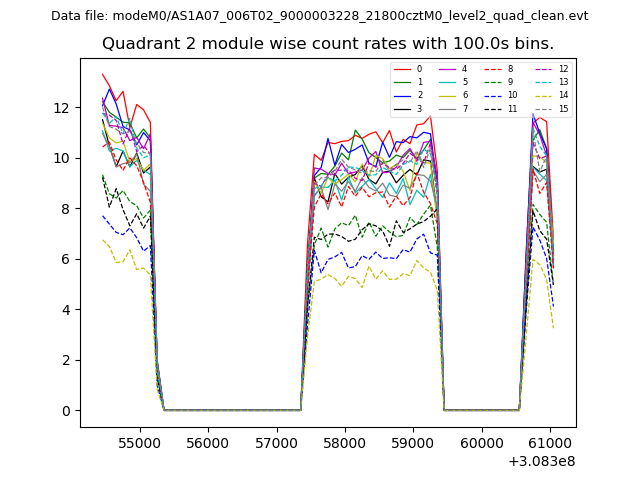
| Module-wise count rates for Quadrant B Data is divided into 100 sec bins |
 |
 |
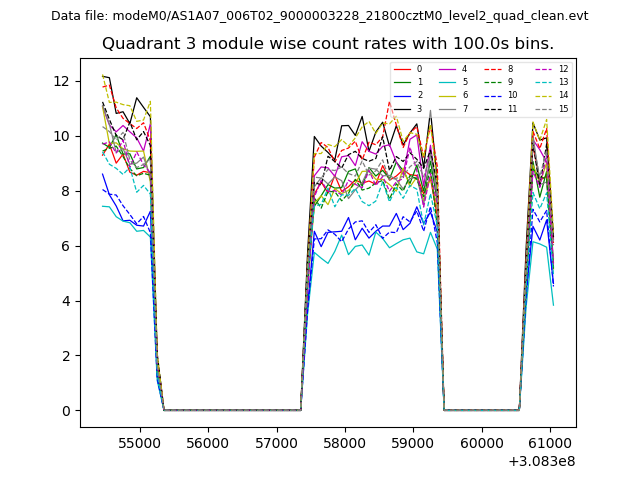
| Module-wise count rates for Quadrant C Data is divided into 100 sec bins |
 |
 |
| Module-wise count rates for Quadrant D Data is divided into 100 sec bins |
 |
 |
| Parameter | Plot |
|---|---|
| CZT HV Monitor | 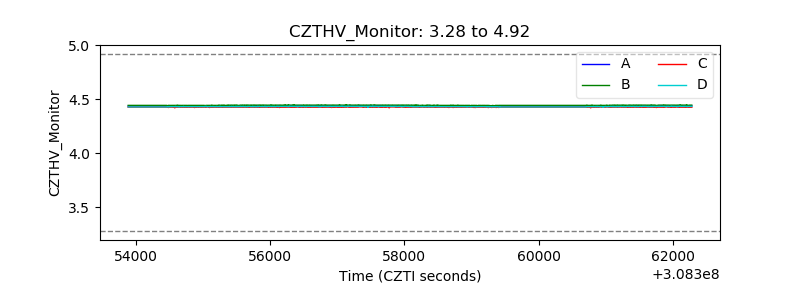 |
| D_VDD | 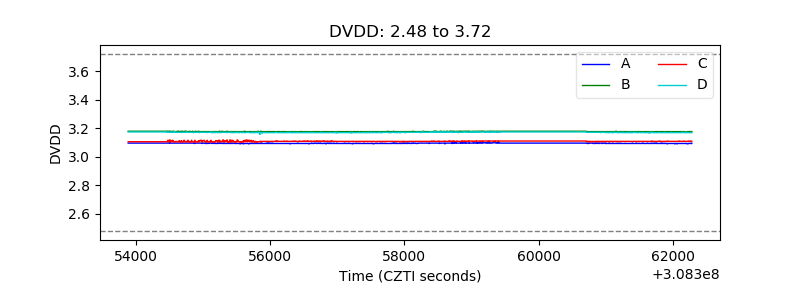 |
| Temperature 1 | 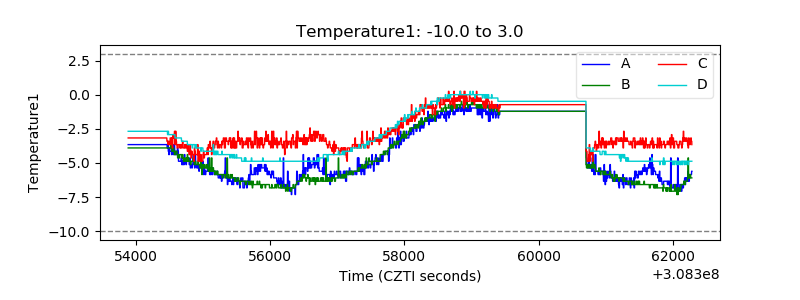 |
| Veto HV Monitor | 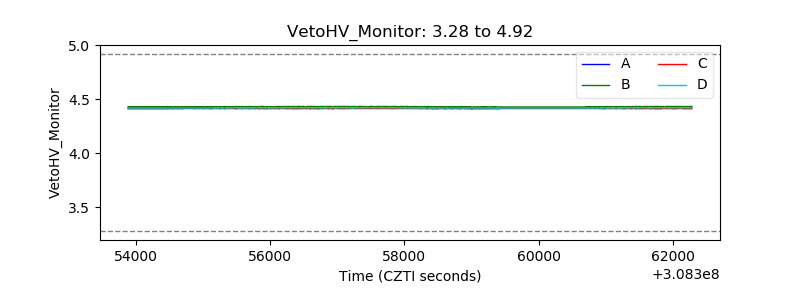 |
| Veto LLD | 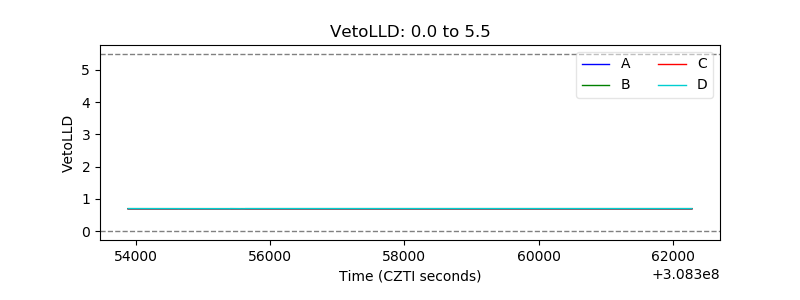 |
| Alpha Counter | 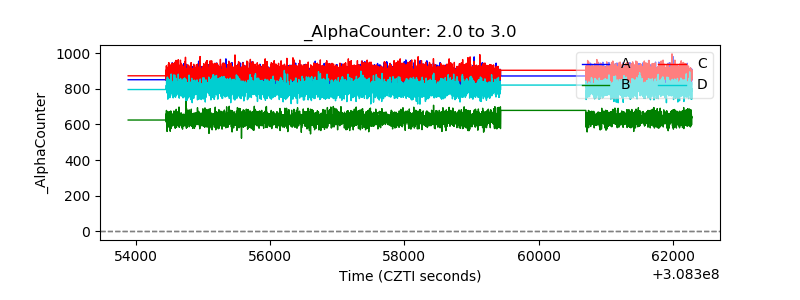 |
| _CPM_Rate | 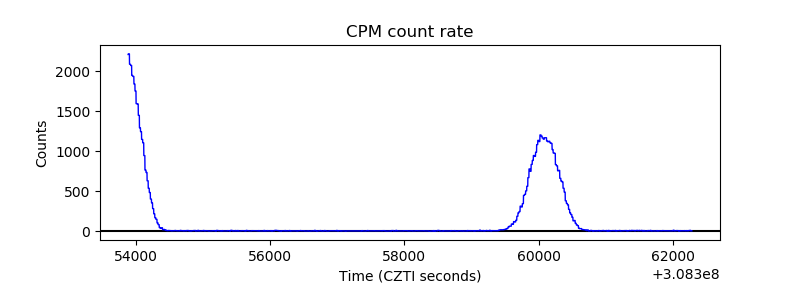 |
| CZT Counter | 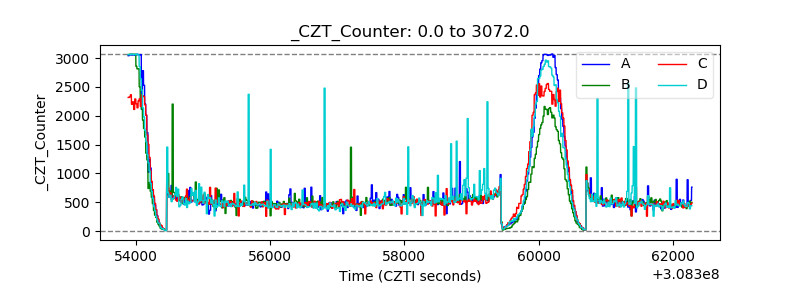 |
| +2.5 Volts monitor | 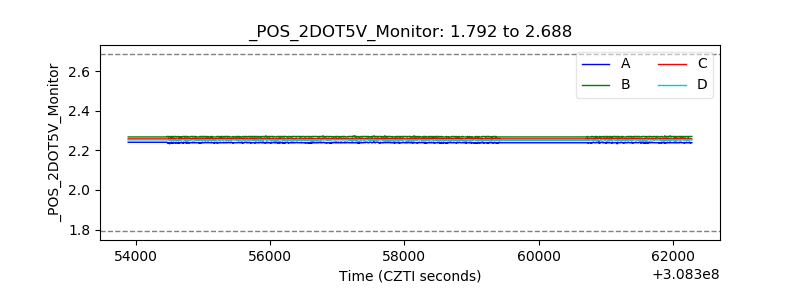 |
| +5 Volts monitor |  |
| _ROLL_ROT | 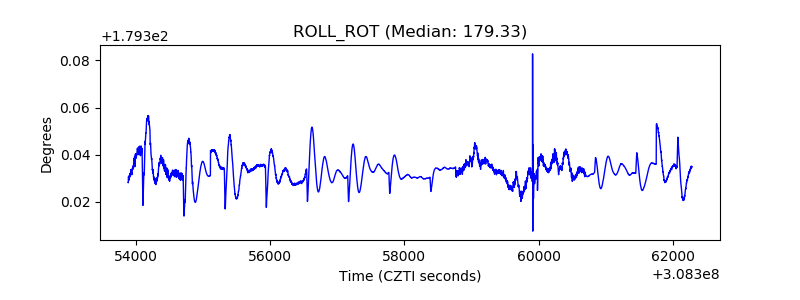 |
| _Roll_DEC | 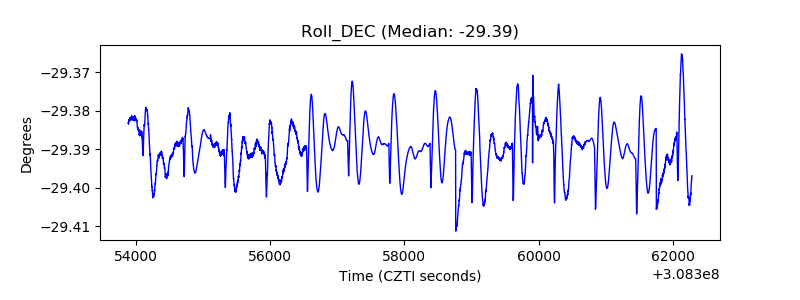 |
| _Roll_RA | 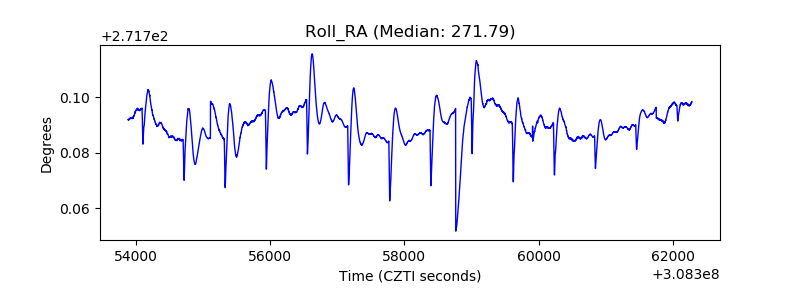 |
| Veto Counter | 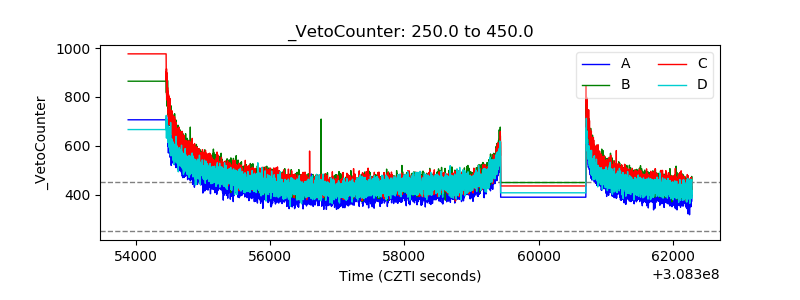 |