| Param | Original file | Final file |
|---|---|---|
| Filename | modeM0/AS1A07_006T02_9000003228_21801cztM0_level2.evt | modeM0/AS1A07_006T02_9000003228_21801cztM0_level2_quad_clean.evt |
| Size (bytes) | 471,107,520 | 69,923,520 |
| Size | 449.3 MB | 66.7 MB |
| Events in quadrant A | 3,339,304 | 417,438 |
| Events in quadrant B | 3,627,966 | 423,993 |
| Events in quadrant C | 3,263,822 | 411,604 |
| Events in quadrant D | 3,580,463 | 396,050 |
| Mode M0 | |||
|---|---|---|---|
| Quadrant | BADHDUFLAG | Total packets | Discarded packets |
| A | 0 | 14032 | 2 |
| B | 0 | 14779 | 2 |
| C | 0 | 13732 | 2 |
| D | 0 | 15006 | 2 |
| Mode M9 | |||
|---|---|---|---|
| Quadrant | BADHDUFLAG | Total packets | Discarded packets |
| A | 0 | 10 | 0 |
| B | 0 | 10 | 0 |
| C | 0 | 10 | 0 |
| D | 0 | 10 | 0 |
| Mode SS | |||
|---|---|---|---|
| Quadrant | BADHDUFLAG | Total packets | Discarded packets |
| A | 0 | 136 | 0 |
| B | 0 | 136 | 0 |
| C | 0 | 136 | 0 |
| D | 0 | 136 | 0 |
| Quadrant | Total seconds | Saturated seconds | Saturation percentage |
|---|---|---|---|
| A | 6713 | 38 | 0.566066% |
| B | 6713 | 119 | 1.772680% |
| C | 6713 | 83 | 1.236407% |
| D | 6714 | 112 | 1.668156% |
Noise dominated data is calculated using 1-second bins in cleaned event files. If a bin has >2000 counts, and if more than 50% of those come from <1% of pixels, then it is considered to be noise-dominated and hence unusable.
| Quadrant | # 1 sec bins | Bins with >0 counts | Bins with >2000 counts | High rate bins dominated by noise | Noise dominated (total time) | Noise dominated (detector-on time) | Marked lightcurve |
|---|---|---|---|---|---|---|---|
| A | 7673 | 6714 | 1 | 1 | 0.01% | 0.01% | 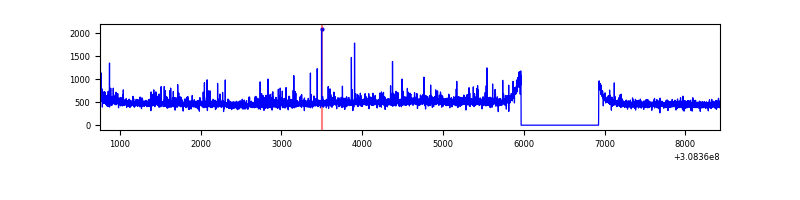 |
| B | 7673 | 6714 | 49 | 49 | 0.64% | 0.73% | 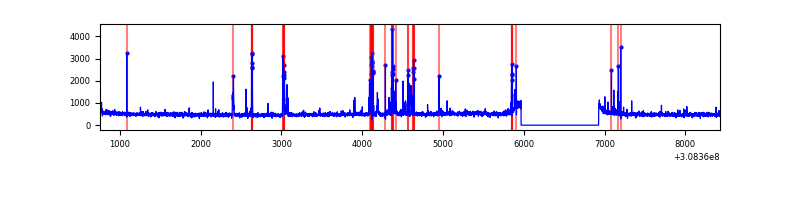 |
| C | 7673 | 6713 | 0 | 0 | 0.00% | 0.00% | 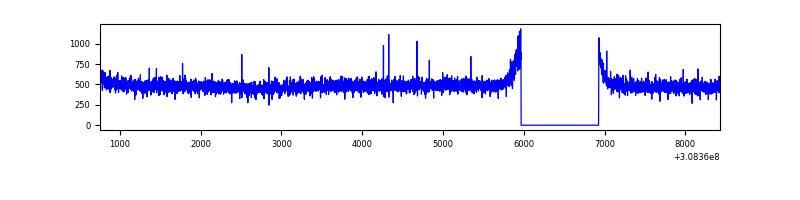 |
| D | 7674 | 6715 | 66 | 66 | 0.86% | 0.98% | 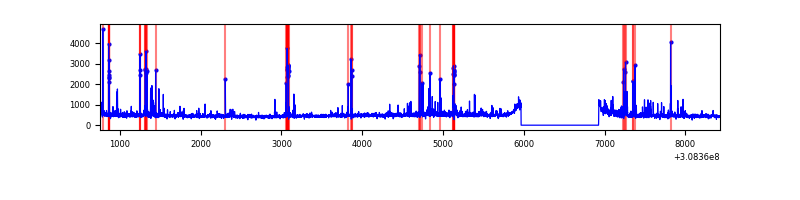 |
Top three noisy pixels from each quadrant. If the there are fewer than three noisy pixels in the level2.evt file, extra rows are filled as -1
| Pixel properties | Quadrant properties | ||||||
|---|---|---|---|---|---|---|---|
| Quadrant | DetID | PixID | Counts | Sigma | Mean | Median | Sigma |
| A | 6 | 16 | 126966 | 755.63 | 832 | 814 | 166.9 |
| A | 13 | 254 | 12498 | 69.98 | 832 | 814 | 166.9 |
| A | 0 | 226 | 7251 | 38.55 | 832 | 814 | 166.9 |
| B | 3 | 64 | 262395 | 1647.54 | 837 | 820 | 158.8 |
| B | 0 | 190 | 39955 | 246.49 | 837 | 820 | 158.8 |
| B | 0 | 197 | 22496 | 136.53 | 837 | 820 | 158.8 |
| C | 14 | 238 | 125913 | 662.99 | 805 | 813 | 188.7 |
| C | 13 | 61 | 5555 | 25.13 | 805 | 813 | 188.7 |
| C | 0 | 207 | 2307 | 7.92 | 805 | 813 | 188.7 |
| D | 13 | 153 | 173769 | 880.82 | 805 | 783 | 196.4 |
| D | 1 | 52 | 129530 | 655.56 | 805 | 783 | 196.4 |
| D | 13 | 104 | 84785 | 427.72 | 805 | 783 | 196.4 |
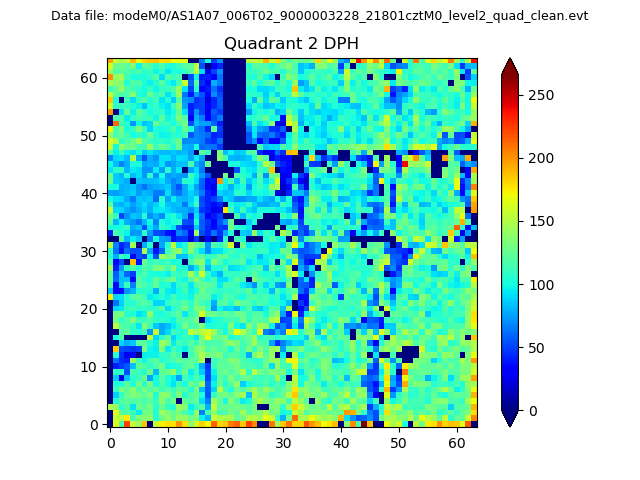
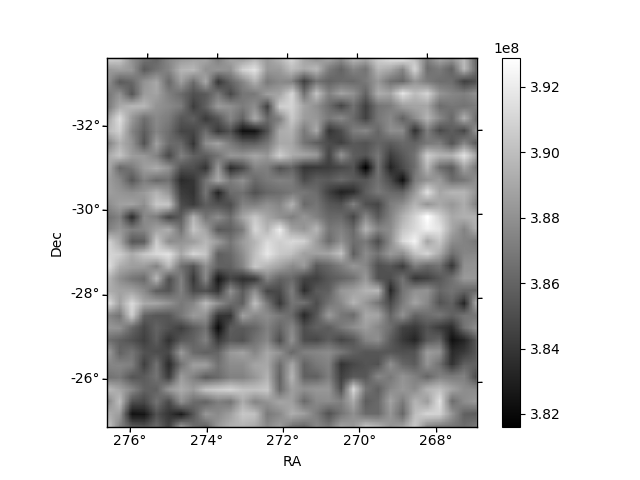
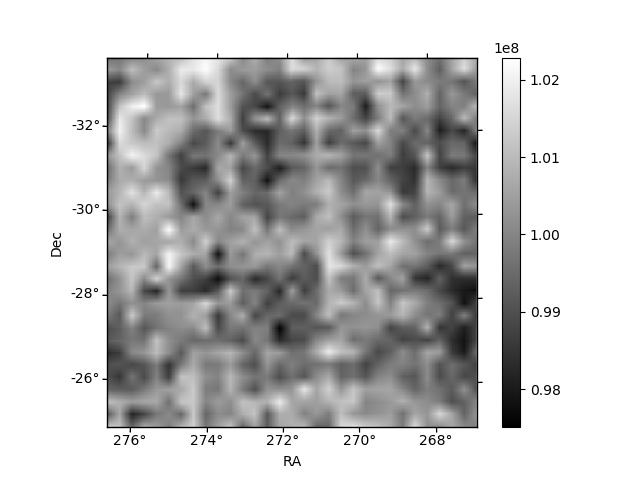
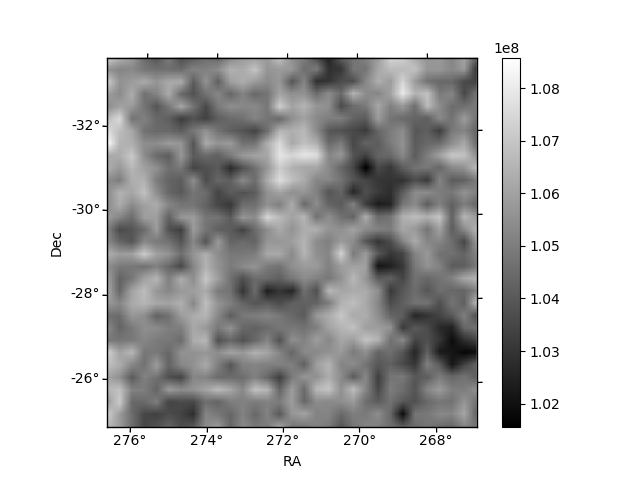
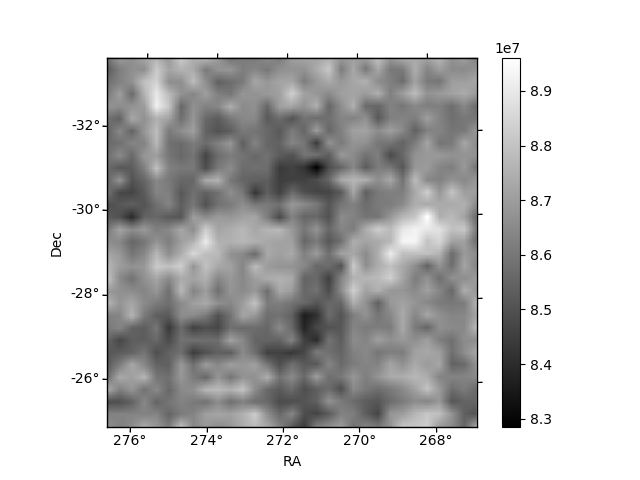
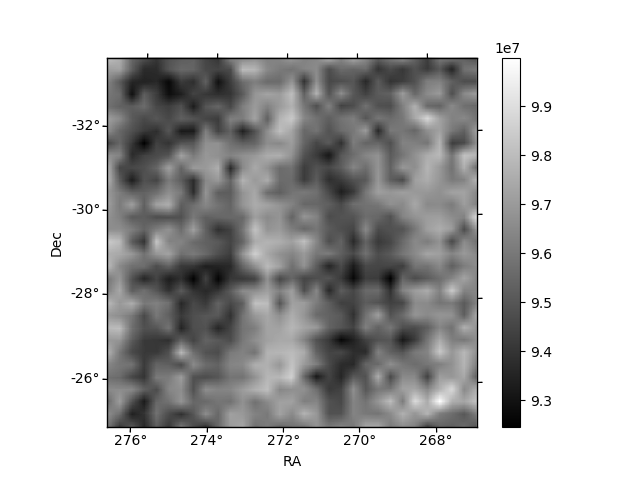
Histogram calculated using DETX and DETY for each event in the final _common_clean file
| Quadrant A | 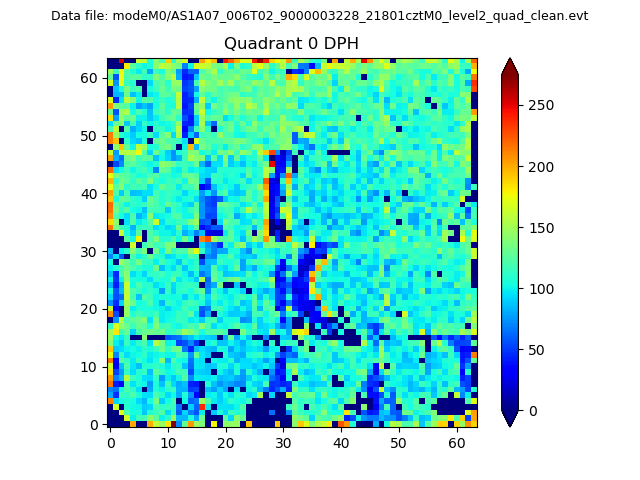 |
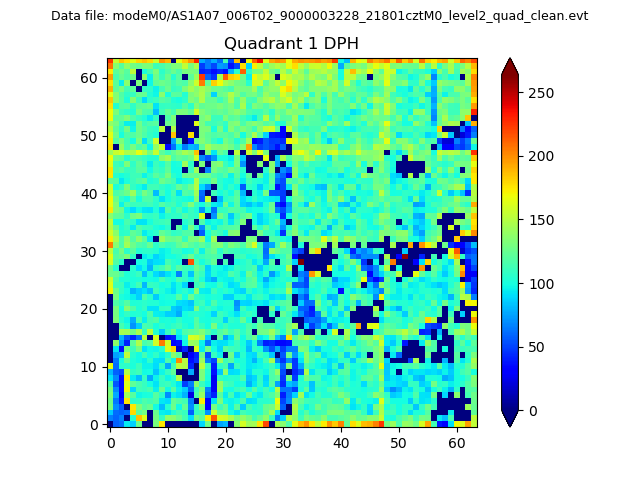 |
Quadrant B |
|---|---|---|---|
| Quadrant D | 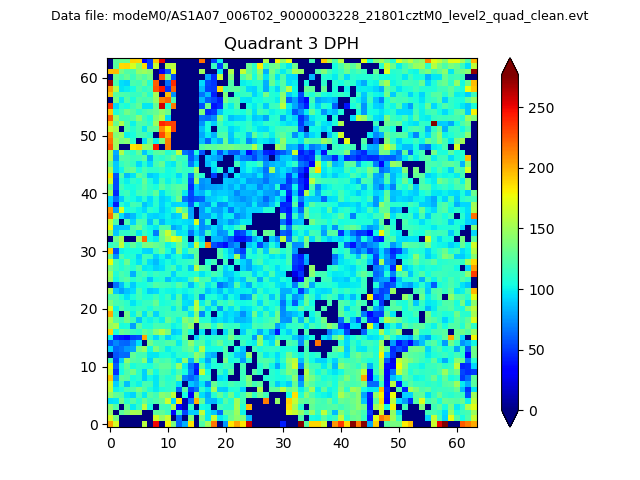 |
 |
Quadrant C |
| Plot type | Count rate plots | Images |
|---|---|---|
| Comparison with Poisson distribution Blue bars denote a histogram of data divided into 1 sec bins. Red curve is a Poisson curve with rate = median count rate of data. |
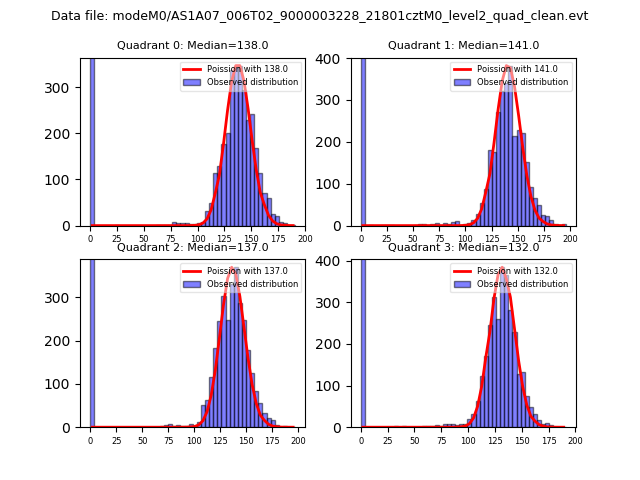 |
 |
| Quadrant-wise count rates Data is divided into 100 sec bins |
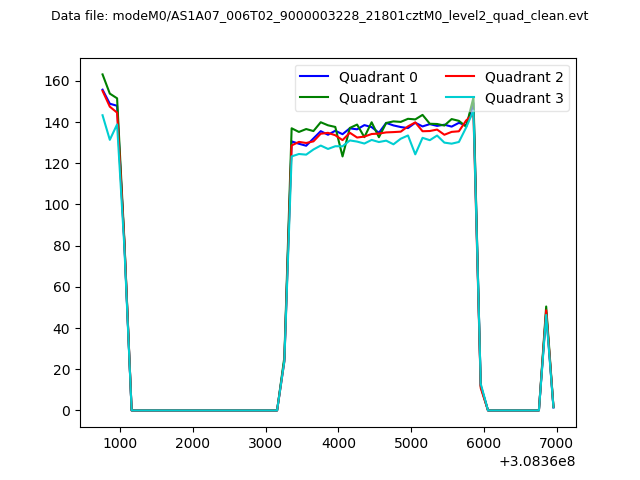 |
|
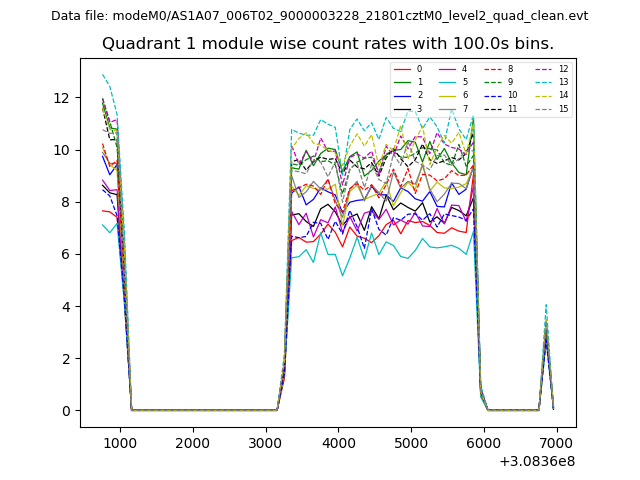
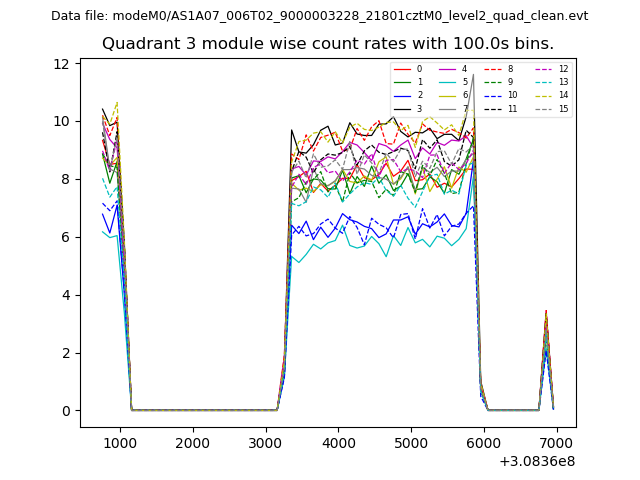
| Module-wise count rates for Quadrant A Data is divided into 100 sec bins |
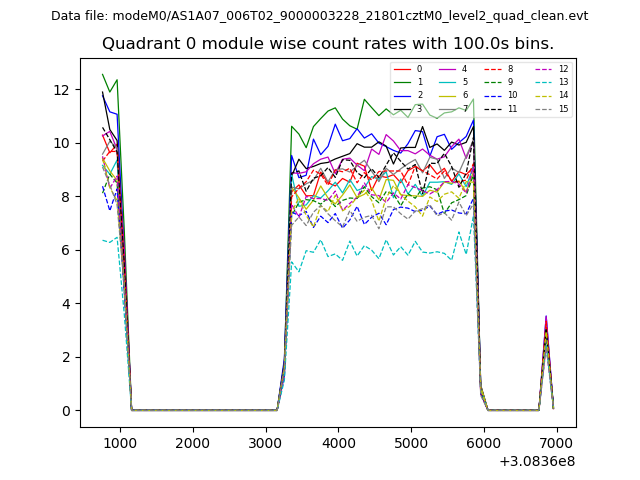 |
 |
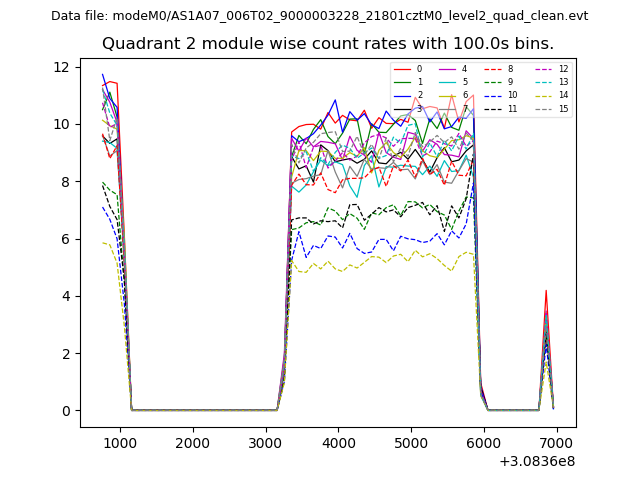
| Module-wise count rates for Quadrant B Data is divided into 100 sec bins |
 |
 |
| Module-wise count rates for Quadrant C Data is divided into 100 sec bins |
 |
 |
| Module-wise count rates for Quadrant D Data is divided into 100 sec bins |
 |
 |
| Parameter | Plot |
|---|---|
| CZT HV Monitor | 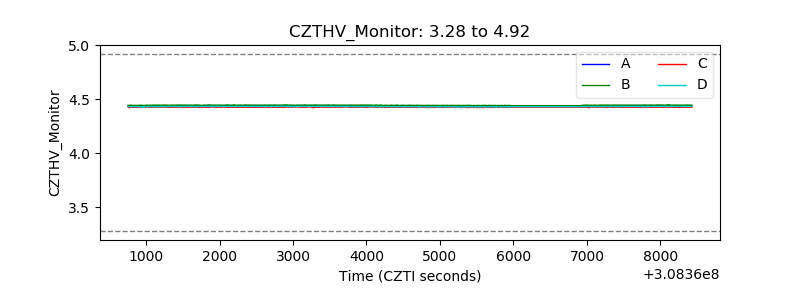 |
| D_VDD | 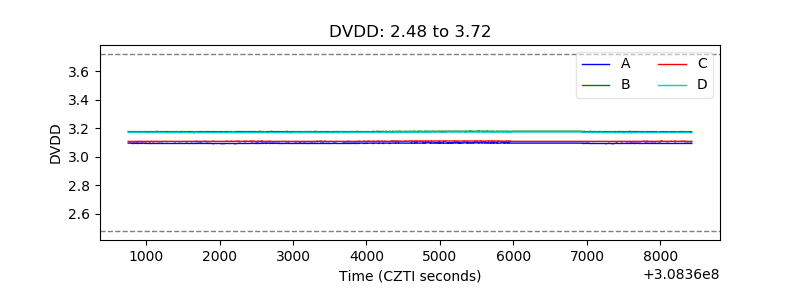 |
| Temperature 1 | 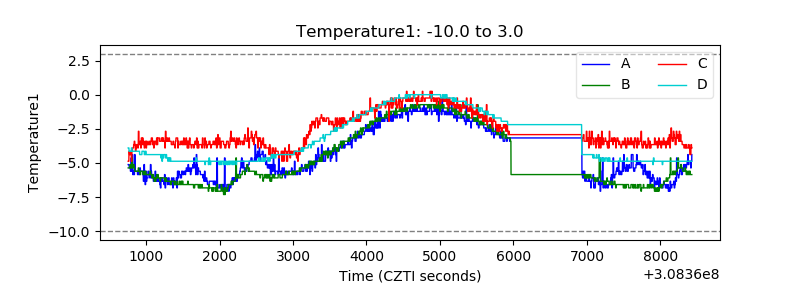 |
| Veto HV Monitor | 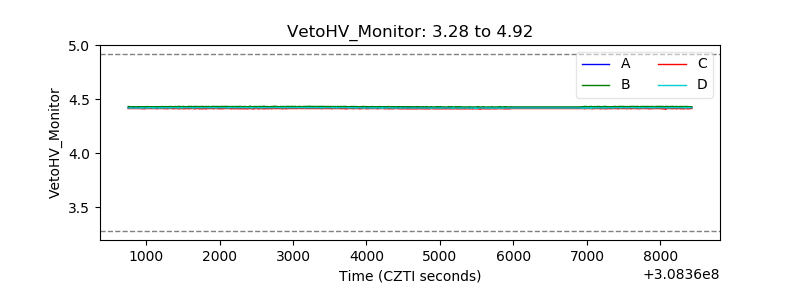 |
| Veto LLD | 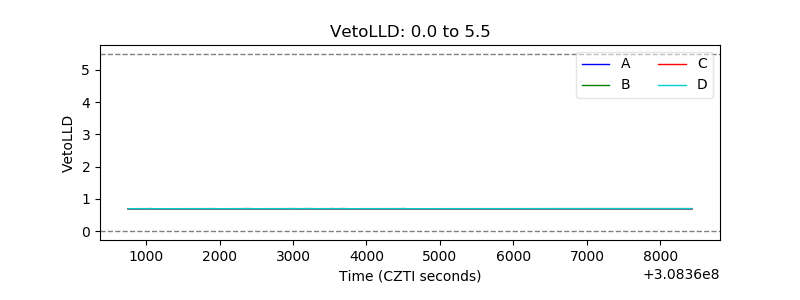 |
| Alpha Counter | 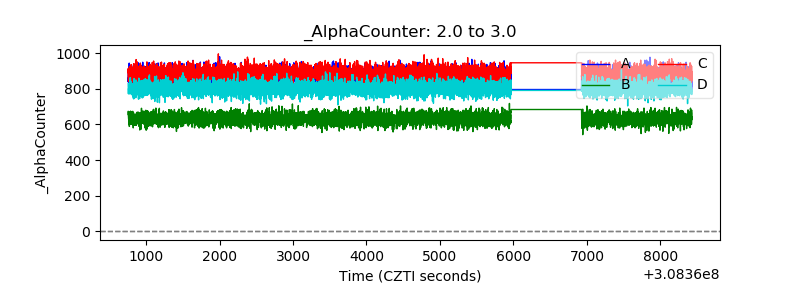 |
| _CPM_Rate | 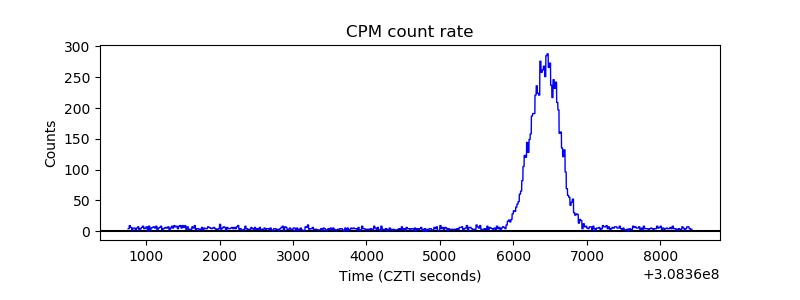 |
| CZT Counter | 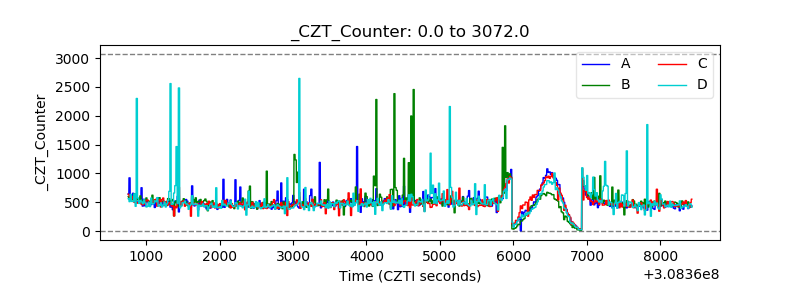 |
| +2.5 Volts monitor | 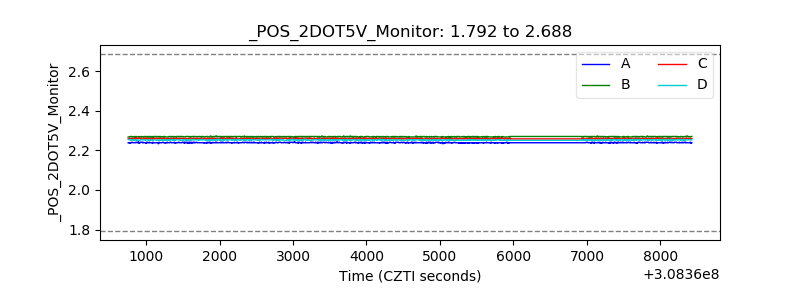 |
| +5 Volts monitor | 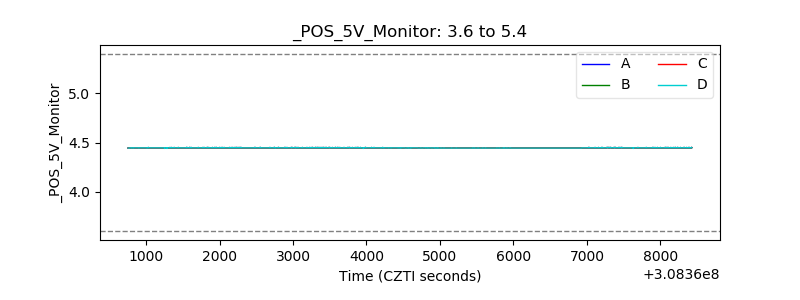 |
| _ROLL_ROT | 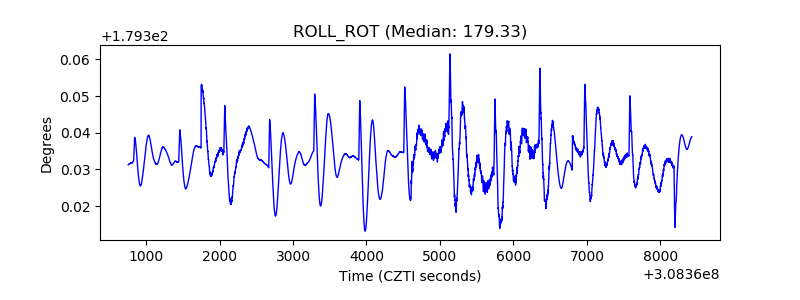 |
| _Roll_DEC | 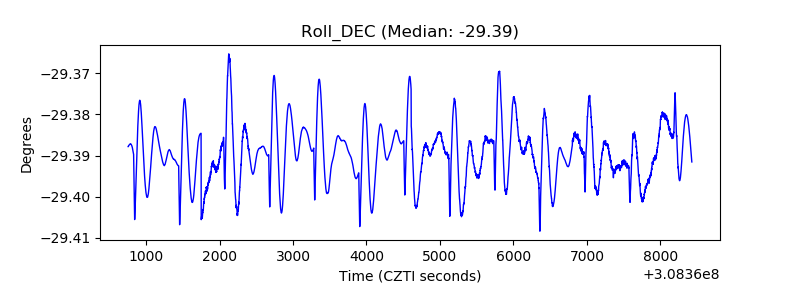 |
| _Roll_RA | 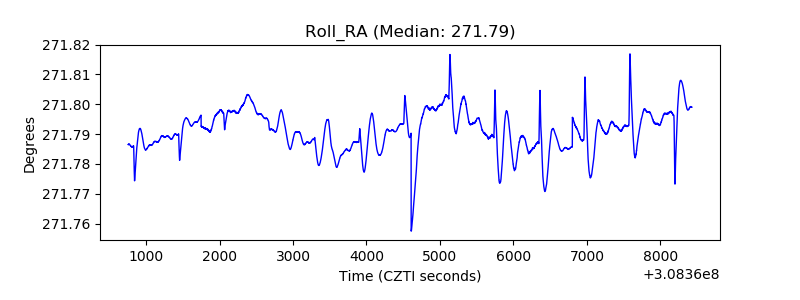 |
| Veto Counter | 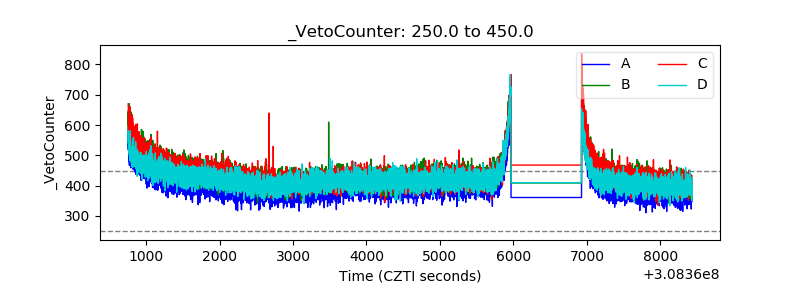 |