| Param | Original file | Final file |
|---|---|---|
| Filename | modeM0/AS1A07_006T02_9000003228_21802cztM0_level2.evt | modeM0/AS1A07_006T02_9000003228_21802cztM0_level2_quad_clean.evt |
| Size (bytes) | 494,576,640 | 76,357,440 |
| Size | 471.7 MB | 72.8 MB |
| Events in quadrant A | 3,529,408 | 457,222 |
| Events in quadrant B | 3,731,268 | 465,122 |
| Events in quadrant C | 3,493,304 | 451,185 |
| Events in quadrant D | 3,736,141 | 438,440 |
| Mode M0 | |||
|---|---|---|---|
| Quadrant | BADHDUFLAG | Total packets | Discarded packets |
| A | 0 | 15095 | 2 |
| B | 0 | 15490 | 2 |
| C | 0 | 14941 | 2 |
| D | 0 | 15932 | 2 |
| Mode M9 | |||
|---|---|---|---|
| Quadrant | BADHDUFLAG | Total packets | Discarded packets |
| A | 0 | 16 | 0 |
| B | 0 | 16 | 0 |
| C | 0 | 16 | 0 |
| D | 0 | 16 | 0 |
| Mode SS | |||
|---|---|---|---|
| Quadrant | BADHDUFLAG | Total packets | Discarded packets |
| A | 0 | 146 | 0 |
| B | 0 | 146 | 0 |
| C | 0 | 146 | 0 |
| D | 0 | 146 | 0 |
| Quadrant | Total seconds | Saturated seconds | Saturation percentage |
|---|---|---|---|
| A | 7188 | 121 | 1.683361% |
| B | 7188 | 182 | 2.531998% |
| C | 7188 | 183 | 2.545910% |
| D | 7188 | 135 | 1.878130% |
Noise dominated data is calculated using 1-second bins in cleaned event files. If a bin has >2000 counts, and if more than 50% of those come from <1% of pixels, then it is considered to be noise-dominated and hence unusable.
| Quadrant | # 1 sec bins | Bins with >0 counts | Bins with >2000 counts | High rate bins dominated by noise | Noise dominated (total time) | Noise dominated (detector-on time) | Marked lightcurve |
|---|---|---|---|---|---|---|---|
| A | 8698 | 7190 | 0 | 0 | 0.00% | 0.00% | 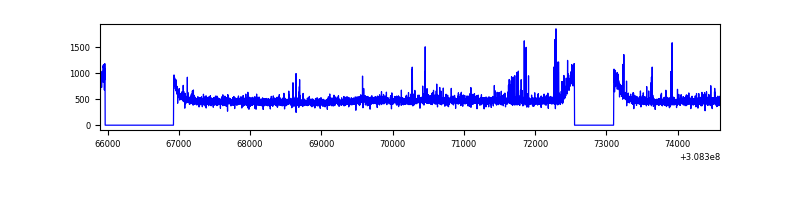 |
| B | 8698 | 7190 | 27 | 27 | 0.31% | 0.38% | 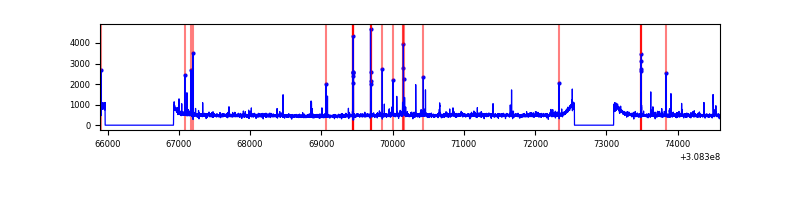 |
| C | 8698 | 7189 | 0 | 0 | 0.00% | 0.00% | 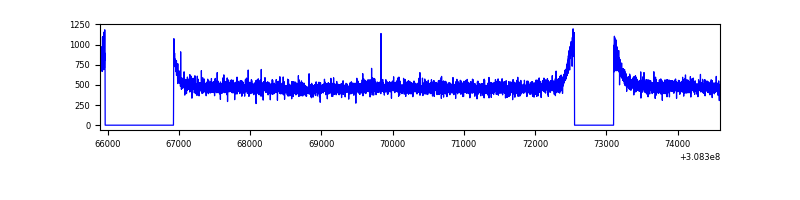 |
| D | 8698 | 7190 | 27 | 27 | 0.31% | 0.38% | 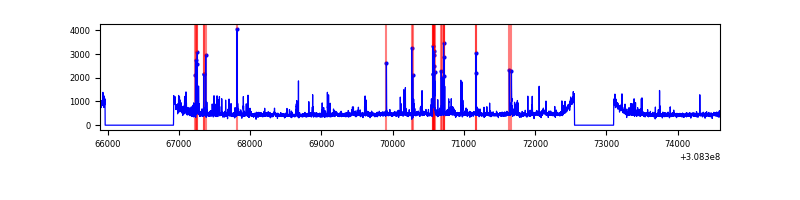 |
Top three noisy pixels from each quadrant. If the there are fewer than three noisy pixels in the level2.evt file, extra rows are filled as -1
| Pixel properties | Quadrant properties | ||||||
|---|---|---|---|---|---|---|---|
| Quadrant | DetID | PixID | Counts | Sigma | Mean | Median | Sigma |
| A | 6 | 16 | 88625 | 488.72 | 892 | 872 | 179.6 |
| A | 13 | 254 | 13603 | 70.9 | 892 | 872 | 179.6 |
| A | 0 | 226 | 7684 | 37.94 | 892 | 872 | 179.6 |
| B | 3 | 64 | 115906 | 665.44 | 896 | 875 | 172.9 |
| B | 12 | 111 | 20529 | 113.7 | 896 | 875 | 172.9 |
| B | 0 | 190 | 20408 | 113.0 | 896 | 875 | 172.9 |
| C | 14 | 238 | 132943 | 646.53 | 860 | 866 | 204.3 |
| C | 13 | 61 | 6025 | 25.25 | 860 | 866 | 204.3 |
| C | 8 | 128 | 4210 | 16.37 | 860 | 866 | 204.3 |
| D | 13 | 153 | 169628 | 784.41 | 870 | 842 | 215.2 |
| D | 1 | 52 | 126982 | 586.22 | 870 | 842 | 215.2 |
| D | 13 | 104 | 50905 | 232.66 | 870 | 842 | 215.2 |
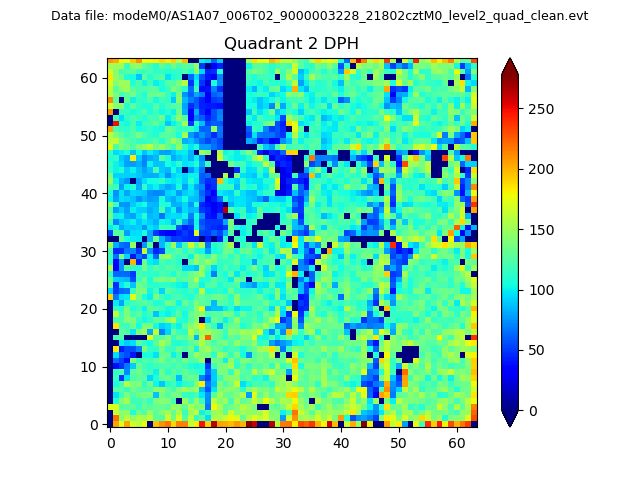
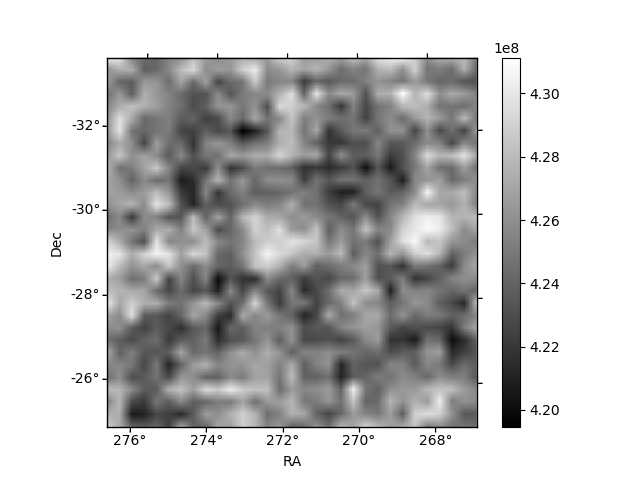
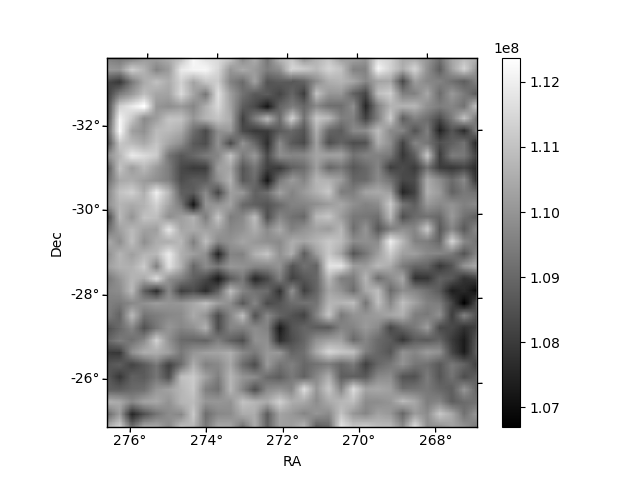
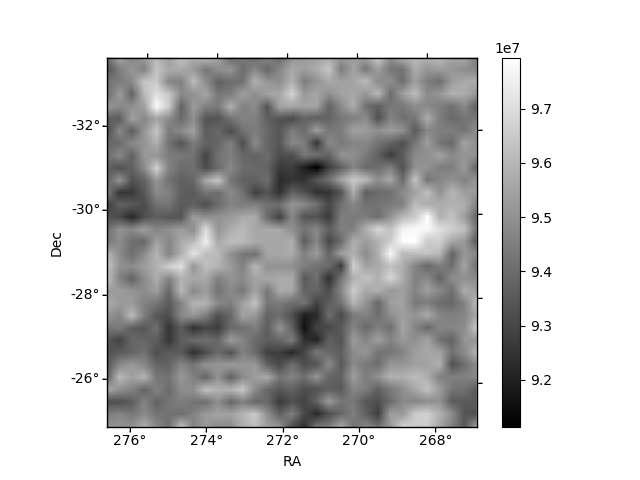
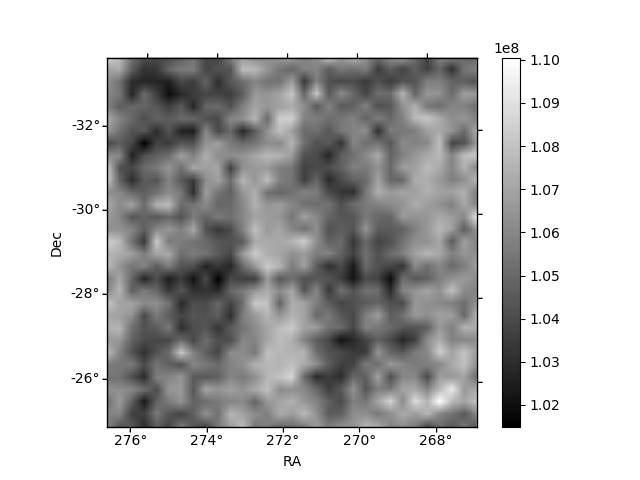
Histogram calculated using DETX and DETY for each event in the final _common_clean file
| Quadrant A | 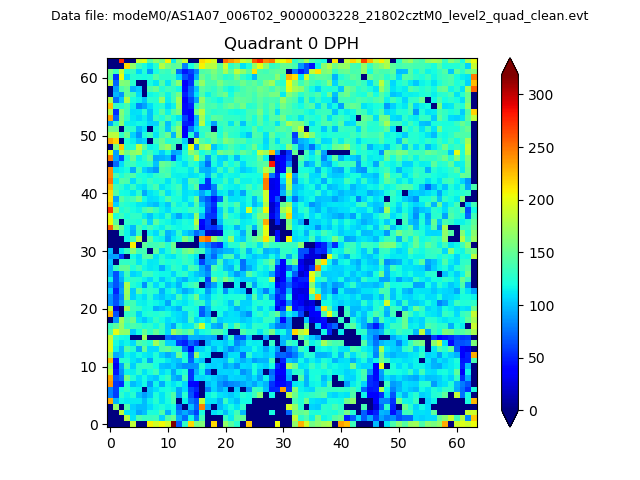 |
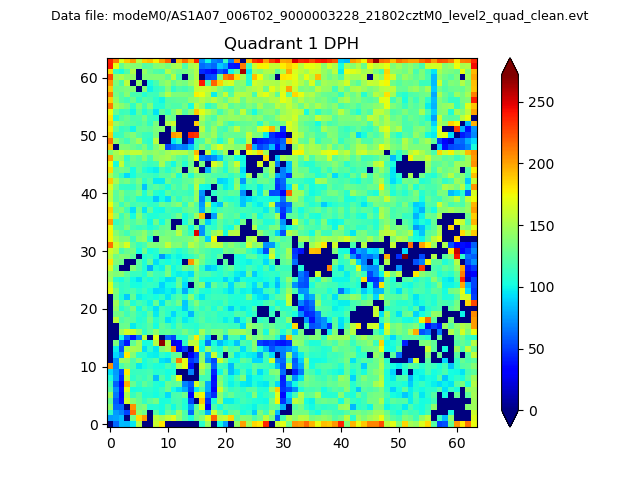 |
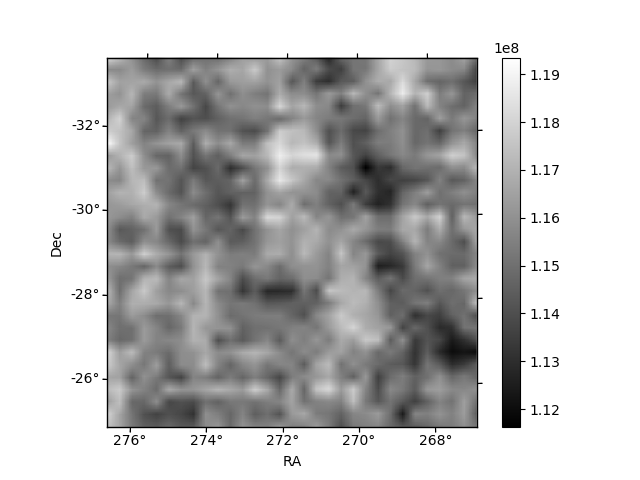
Quadrant B |
|---|---|---|---|
| Quadrant D | 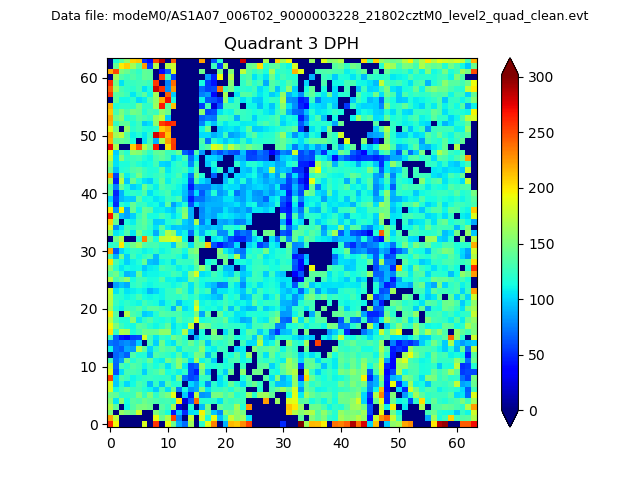 |
 |
Quadrant C |
| Plot type | Count rate plots | Images |
|---|---|---|
| Comparison with Poisson distribution Blue bars denote a histogram of data divided into 1 sec bins. Red curve is a Poisson curve with rate = median count rate of data. |
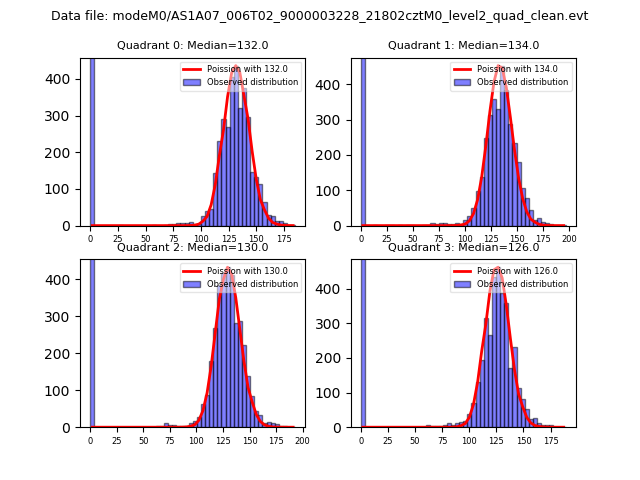 |
 |
| Quadrant-wise count rates Data is divided into 100 sec bins |
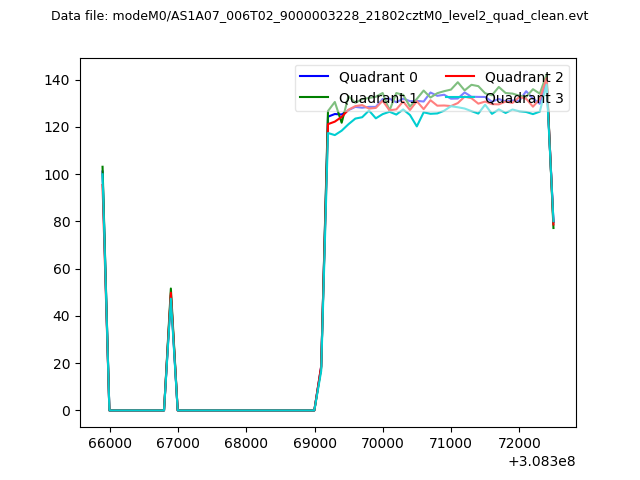 |
|
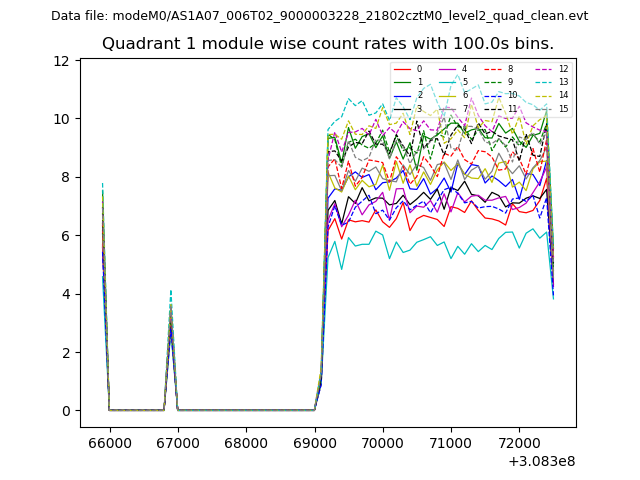
| Module-wise count rates for Quadrant A Data is divided into 100 sec bins |
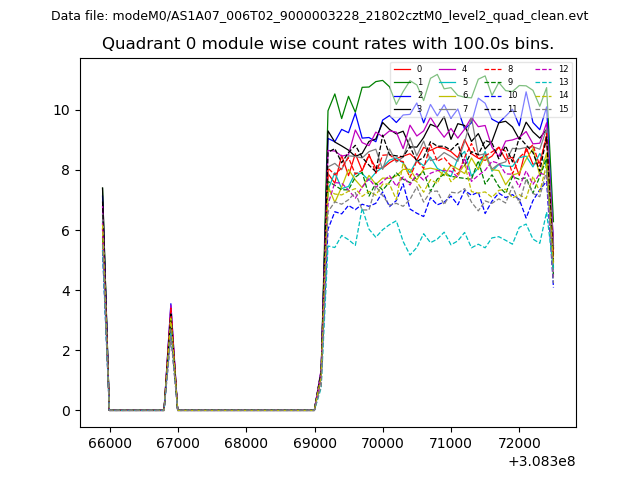 |
 |
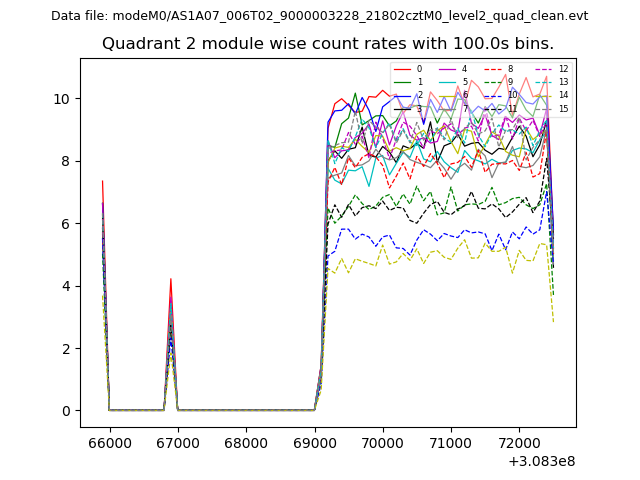
| Module-wise count rates for Quadrant B Data is divided into 100 sec bins |
 |
 |
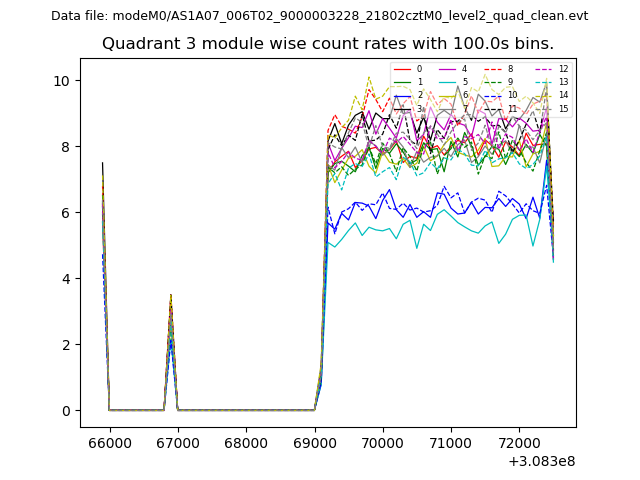
| Module-wise count rates for Quadrant C Data is divided into 100 sec bins |
 |
 |
| Module-wise count rates for Quadrant D Data is divided into 100 sec bins |
 |
 |
| Parameter | Plot |
|---|---|
| CZT HV Monitor | 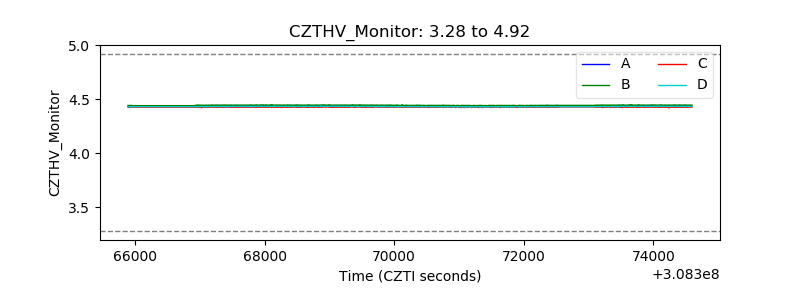 |
| D_VDD | 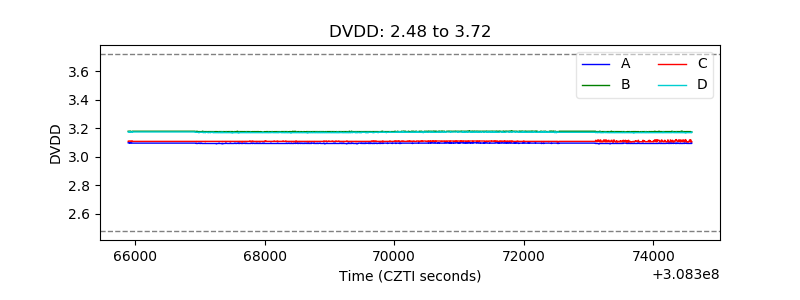 |
| Temperature 1 | 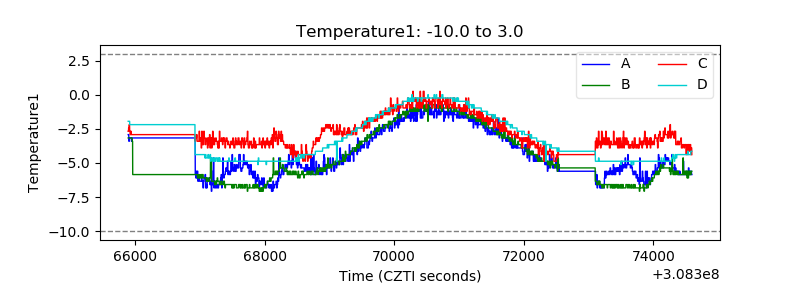 |
| Veto HV Monitor | 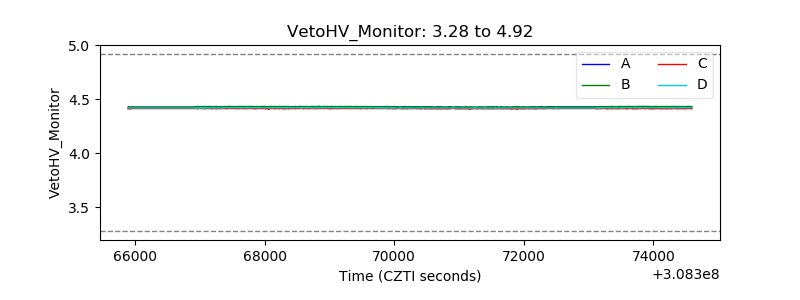 |
| Veto LLD | 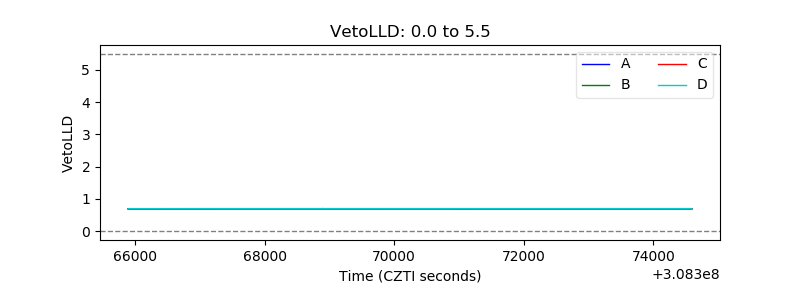 |
| Alpha Counter | 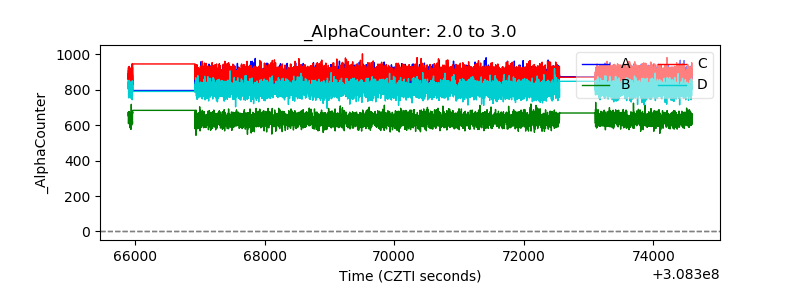 |
| _CPM_Rate | 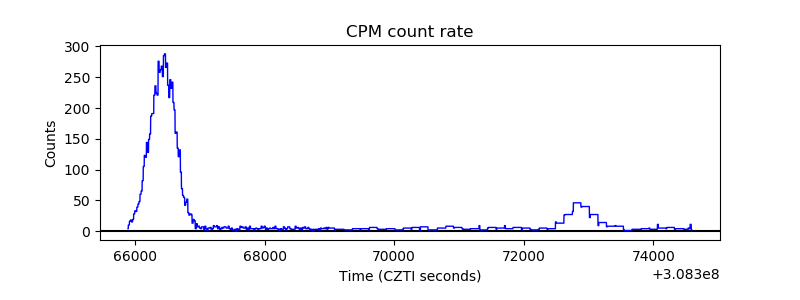 |
| CZT Counter | 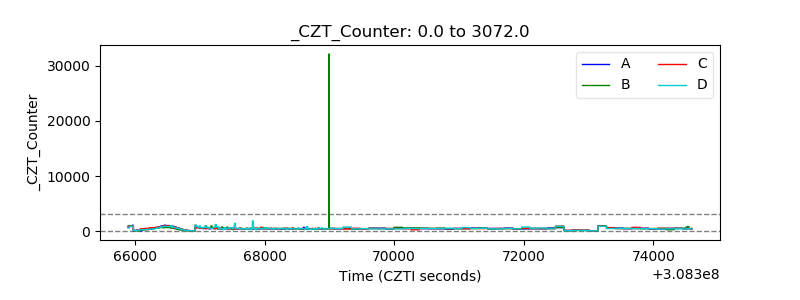 |
| +2.5 Volts monitor | 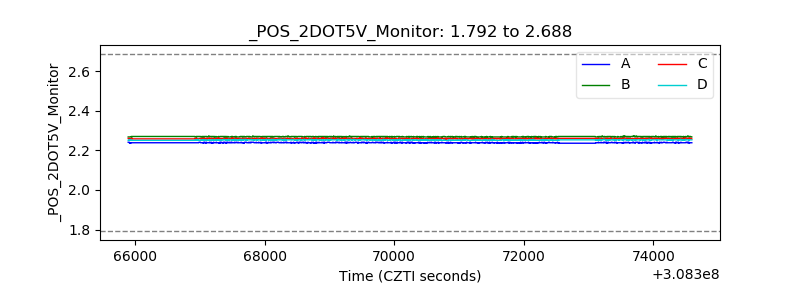 |
| +5 Volts monitor | 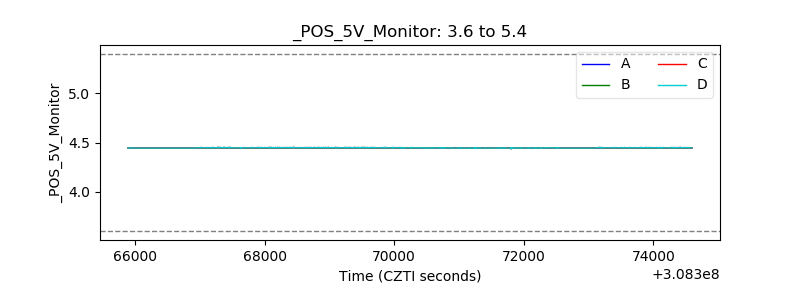 |
| _ROLL_ROT | 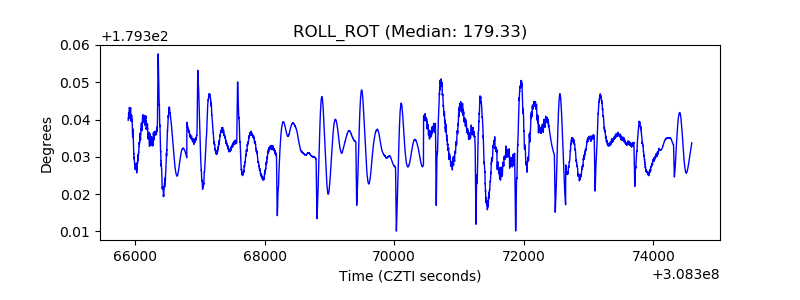 |
| _Roll_DEC | 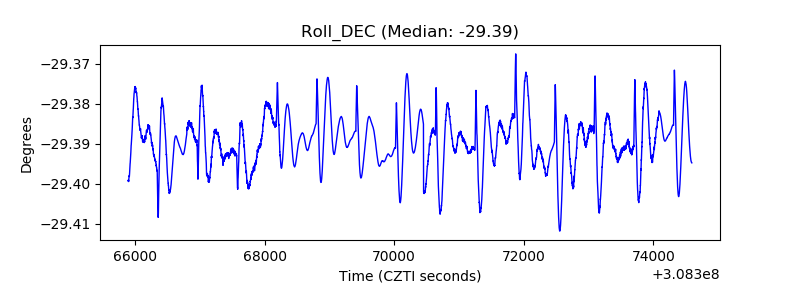 |
| _Roll_RA | 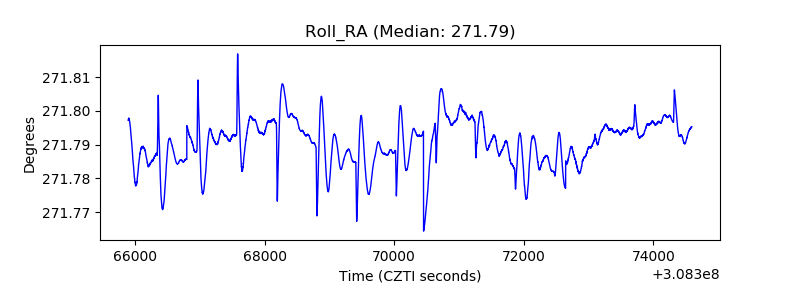 |
| Veto Counter | 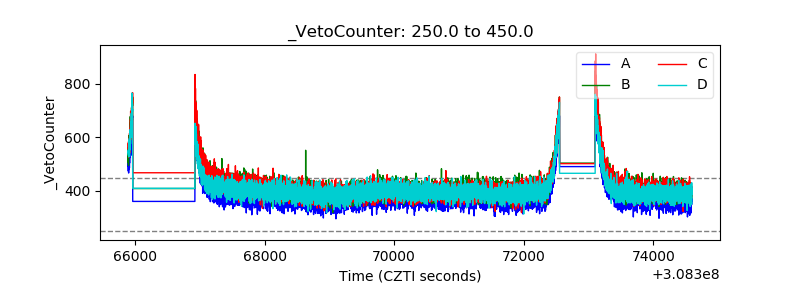 |