| Param | Original file | Final file |
|---|---|---|
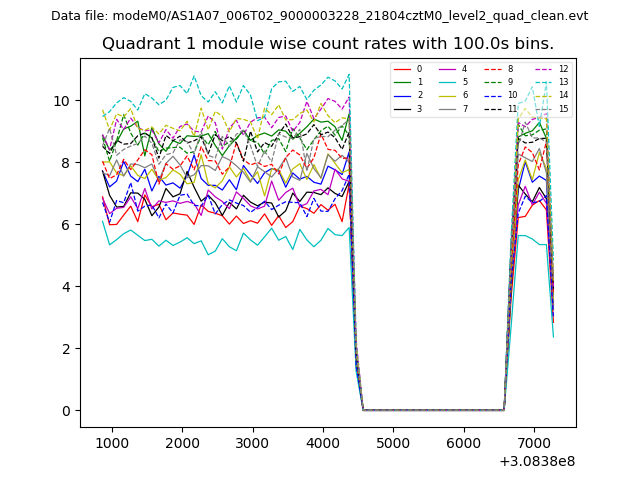
| Filename | modeM0/AS1A07_006T02_9000003228_21804cztM0_level2.evt | modeM0/AS1A07_006T02_9000003228_21804cztM0_level2_quad_clean.evt |
| Size (bytes) | 529,211,520 | 86,270,400 |
| Size | 504.7 MB | 82.3 MB |
| Events in quadrant A | 3,554,752 | 529,781 |
| Events in quadrant B | 3,842,610 | 537,495 |
| Events in quadrant C | 3,571,876 | 522,514 |
| Events in quadrant D | 4,546,613 | 498,671 |
| Mode M0 | |||
|---|---|---|---|
| Quadrant | BADHDUFLAG | Total packets | Discarded packets |
| A | 0 | 15373 | 1 |
| B | 0 | 16063 | 1 |
| C | 0 | 15357 | 1 |
| D | 0 | 18500 | 1 |
| Mode M9 | |||
|---|---|---|---|
| Quadrant | BADHDUFLAG | Total packets | Discarded packets |
| A | 0 | 2 | 0 |
| B | 0 | 2 | 0 |
| C | 0 | 2 | 0 |
| D | 0 | 2 | 0 |
| Mode SS | |||
|---|---|---|---|
| Quadrant | BADHDUFLAG | Total packets | Discarded packets |
| A | 0 | 154 | 0 |
| B | 0 | 154 | 0 |
| C | 0 | 154 | 0 |
| D | 0 | 154 | 0 |
| Quadrant | Total seconds | Saturated seconds | Saturation percentage |
|---|---|---|---|
| A | 7526 | 127 | 1.687483% |
| B | 7527 | 190 | 2.524246% |
| C | 7526 | 166 | 2.205687% |
| D | 7526 | 212 | 2.816901% |
Noise dominated data is calculated using 1-second bins in cleaned event files. If a bin has >2000 counts, and if more than 50% of those come from <1% of pixels, then it is considered to be noise-dominated and hence unusable.
| Quadrant | # 1 sec bins | Bins with >0 counts | Bins with >2000 counts | High rate bins dominated by noise | Noise dominated (total time) | Noise dominated (detector-on time) | Marked lightcurve |
|---|---|---|---|---|---|---|---|
| A | 7796 | 7527 | 0 | 0 | 0.00% | 0.00% | 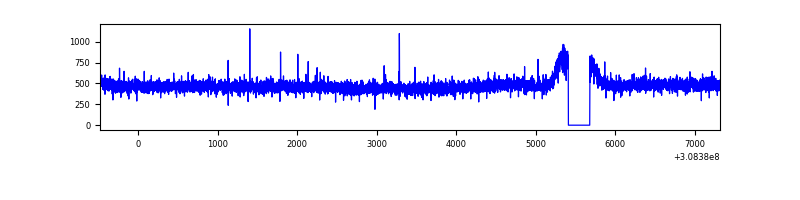 |
| B | 7797 | 7527 | 38 | 38 | 0.49% | 0.50% | 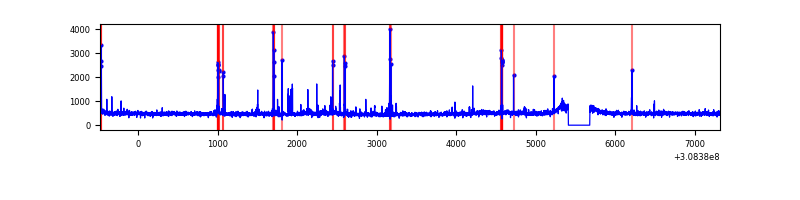 |
| C | 7796 | 7526 | 0 | 0 | 0.00% | 0.00% | 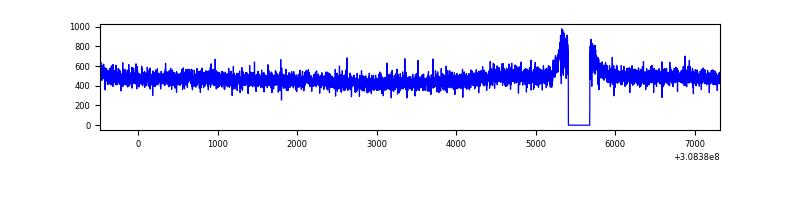 |
| D | 7796 | 7527 | 93 | 93 | 1.19% | 1.24% | 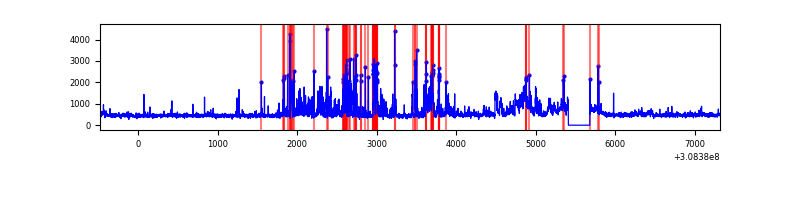 |
Top three noisy pixels from each quadrant. If the there are fewer than three noisy pixels in the level2.evt file, extra rows are filled as -1
| Pixel properties | Quadrant properties | ||||||
|---|---|---|---|---|---|---|---|
| Quadrant | DetID | PixID | Counts | Sigma | Mean | Median | Sigma |
| A | 14 | 235 | 21339 | 110.37 | 915 | 894 | 185.2 |
| A | 13 | 254 | 14145 | 71.53 | 915 | 894 | 185.2 |
| A | 0 | 226 | 8058 | 38.67 | 915 | 894 | 185.2 |
| B | 3 | 64 | 192325 | 1083.73 | 916 | 892 | 176.6 |
| B | 12 | 111 | 21093 | 114.36 | 916 | 892 | 176.6 |
| B | 11 | 111 | 18378 | 98.99 | 916 | 892 | 176.6 |
| C | 14 | 238 | 138521 | 666.17 | 879 | 882 | 206.6 |
| C | 13 | 61 | 6318 | 26.31 | 879 | 882 | 206.6 |
| C | 10 | 91 | 4521 | 17.61 | 879 | 882 | 206.6 |
| D | 1 | 52 | 830231 | 3834.65 | 884 | 856 | 216.3 |
| D | 13 | 104 | 155578 | 715.36 | 884 | 856 | 216.3 |
| D | 13 | 153 | 149649 | 687.95 | 884 | 856 | 216.3 |
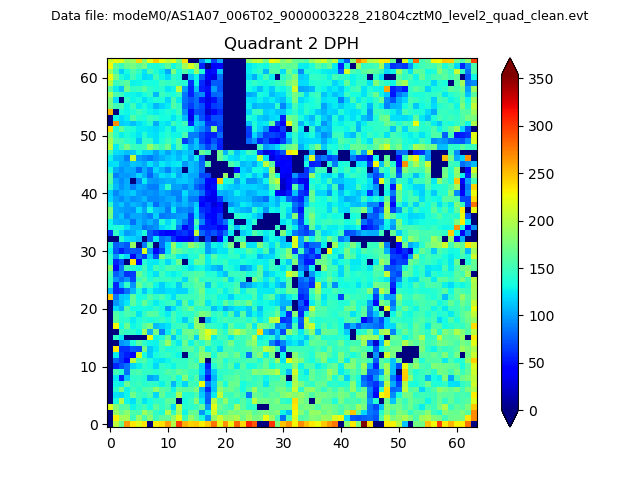
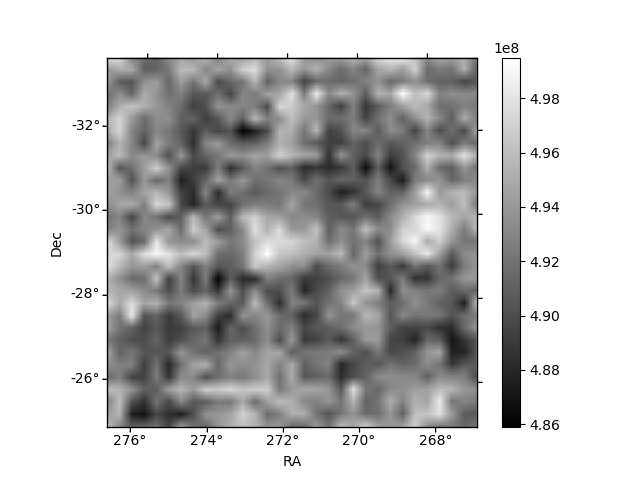
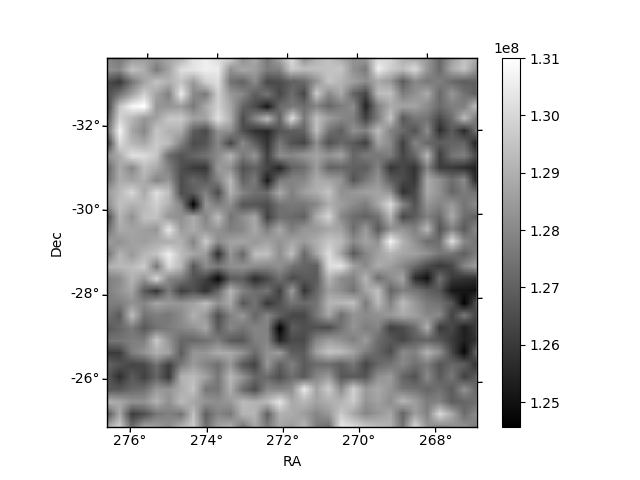
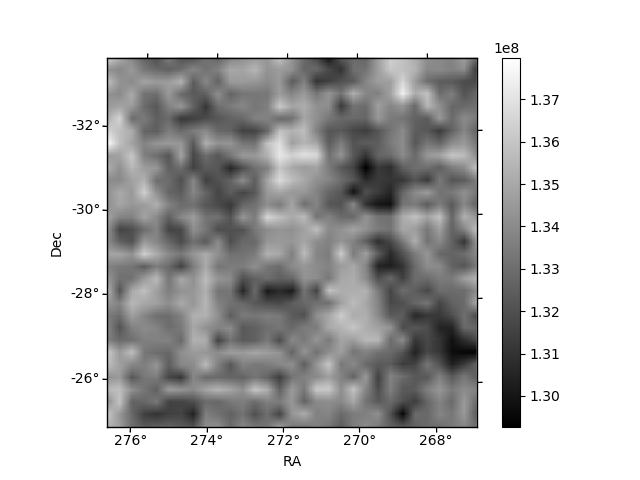
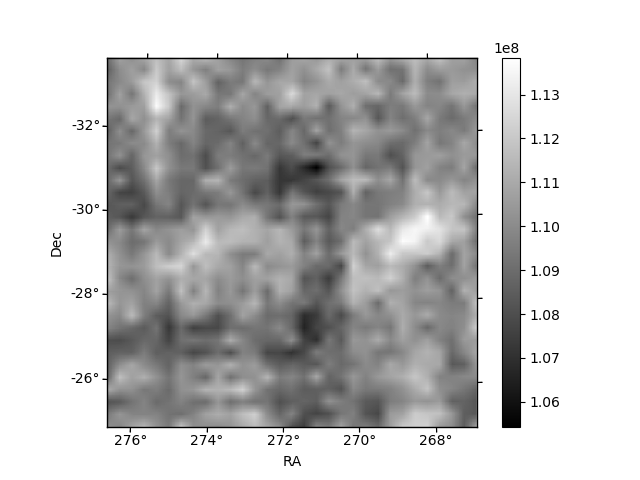
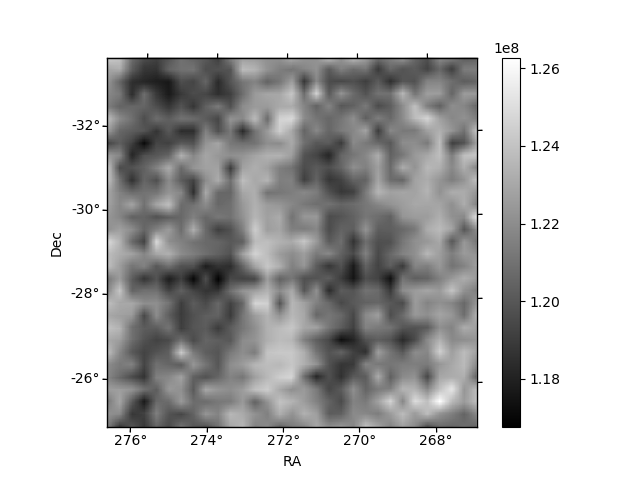
Histogram calculated using DETX and DETY for each event in the final _common_clean file
| Quadrant A | 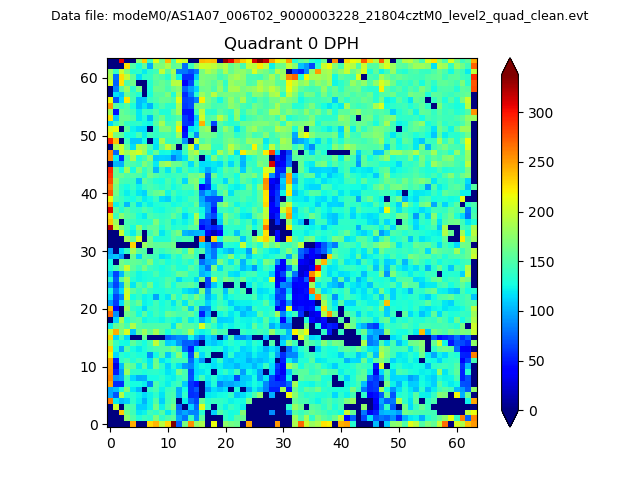 |
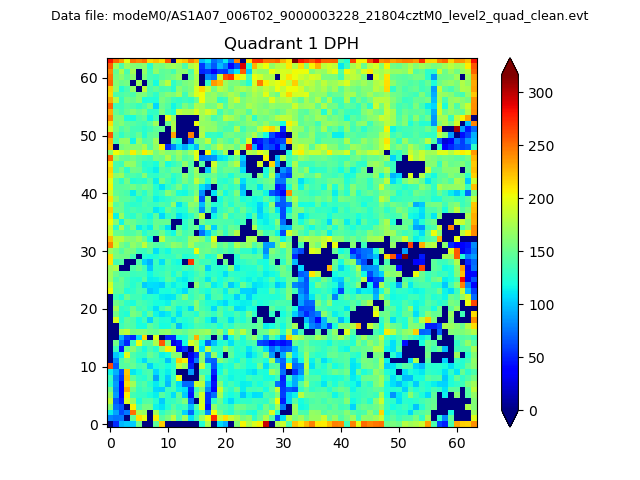 |
Quadrant B |
|---|---|---|---|
| Quadrant D | 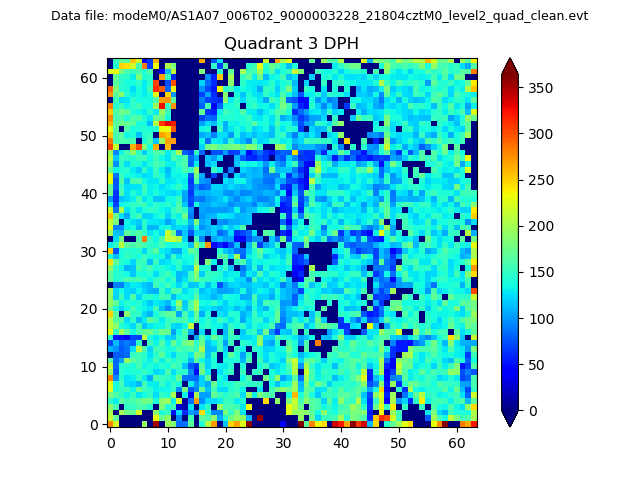 |
 |
Quadrant C |
| Plot type | Count rate plots | Images |
|---|---|---|
| Comparison with Poisson distribution Blue bars denote a histogram of data divided into 1 sec bins. Red curve is a Poisson curve with rate = median count rate of data. |
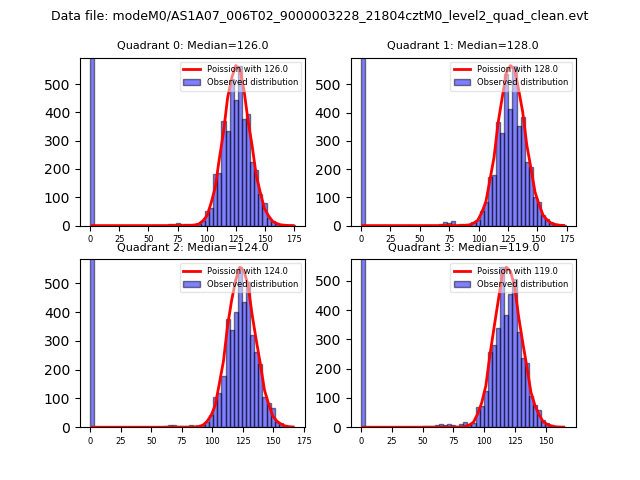 |
 |
| Quadrant-wise count rates Data is divided into 100 sec bins |
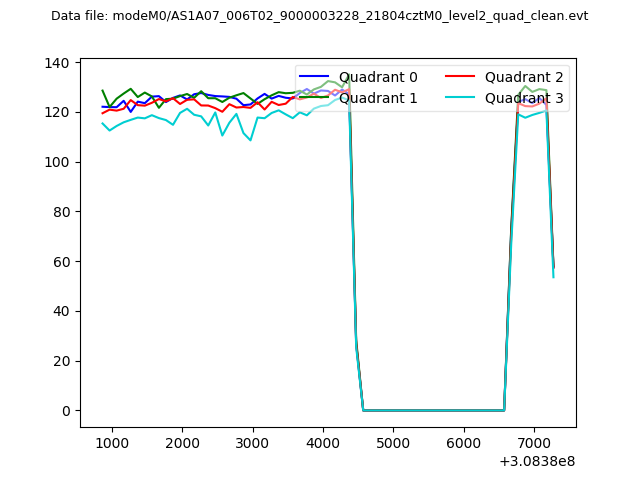 |
|
| Module-wise count rates for Quadrant A Data is divided into 100 sec bins |
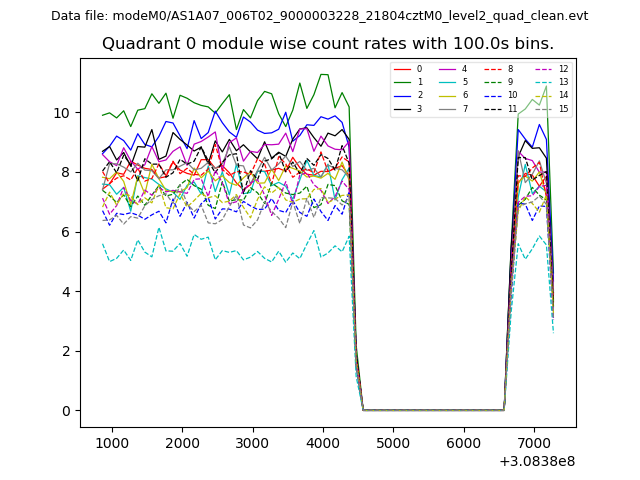 |
 |
| Module-wise count rates for Quadrant B Data is divided into 100 sec bins |
 |
 |
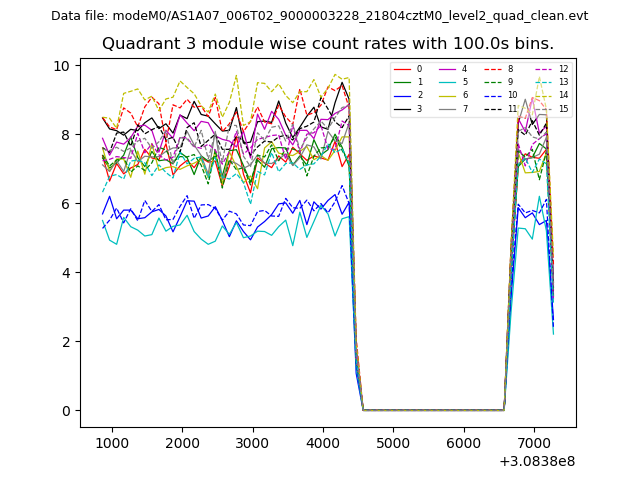
| Module-wise count rates for Quadrant C Data is divided into 100 sec bins |
 |
 |
| Module-wise count rates for Quadrant D Data is divided into 100 sec bins |
 |
 |
| Parameter | Plot |
|---|---|
| CZT HV Monitor | 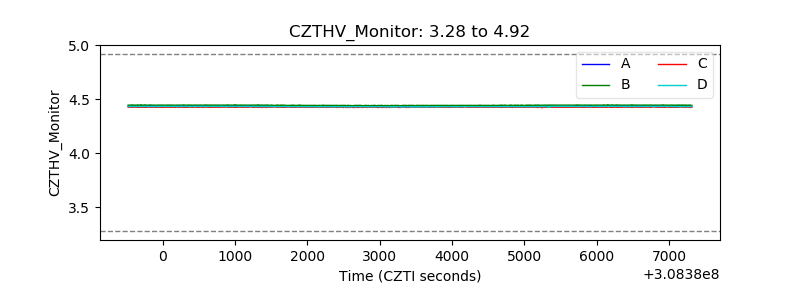 |
| D_VDD |  |
| Temperature 1 | 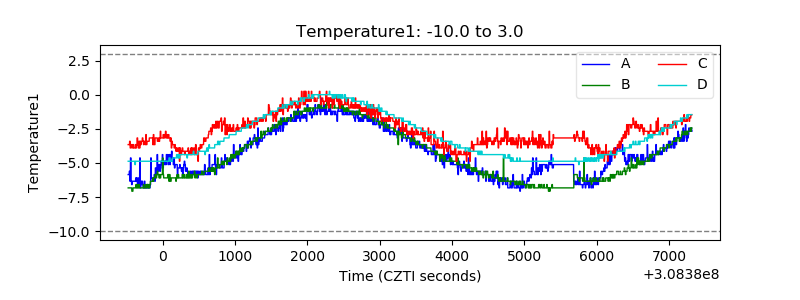 |
| Veto HV Monitor | 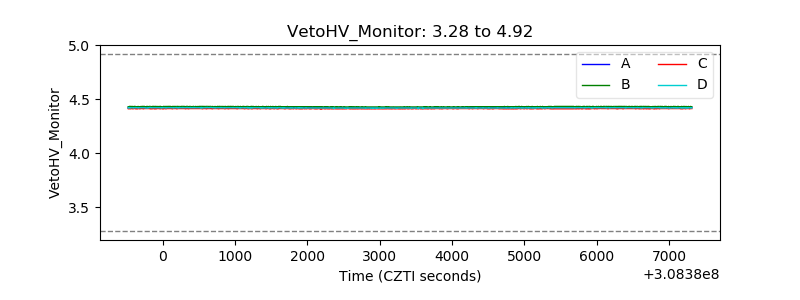 |
| Veto LLD | 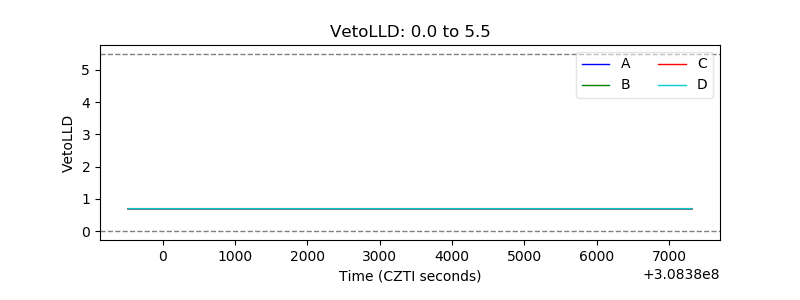 |
| Alpha Counter | 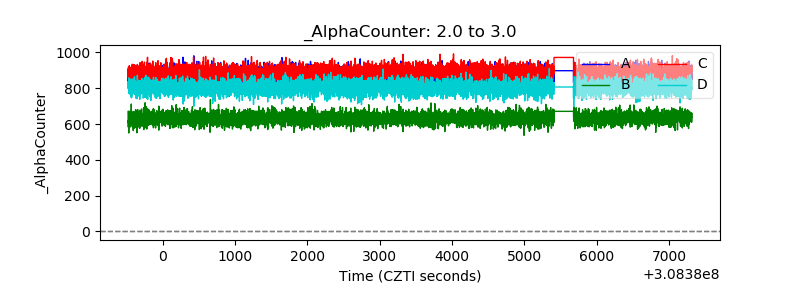 |
| _CPM_Rate | 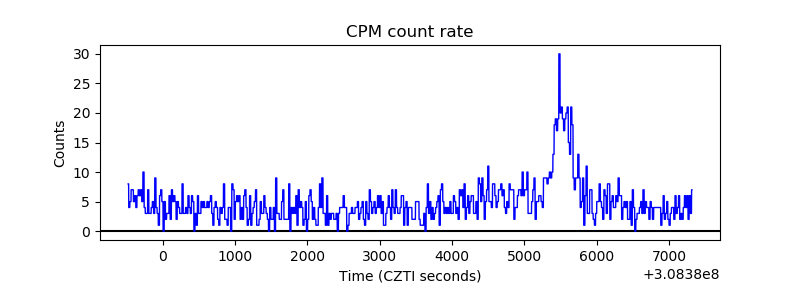 |
| CZT Counter | 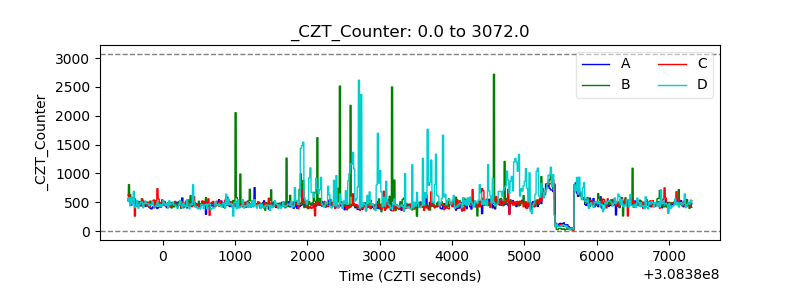 |
| +2.5 Volts monitor |  |
| +5 Volts monitor |  |
| _ROLL_ROT | 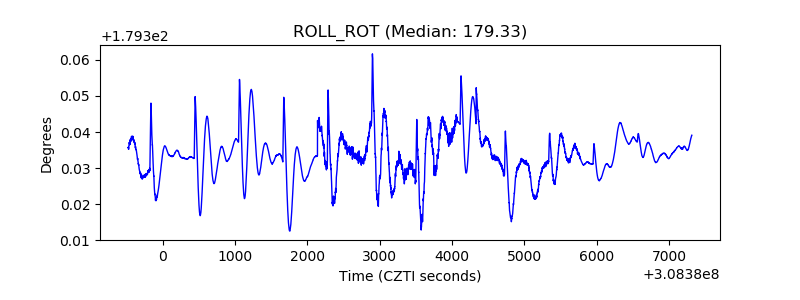 |
| _Roll_DEC | 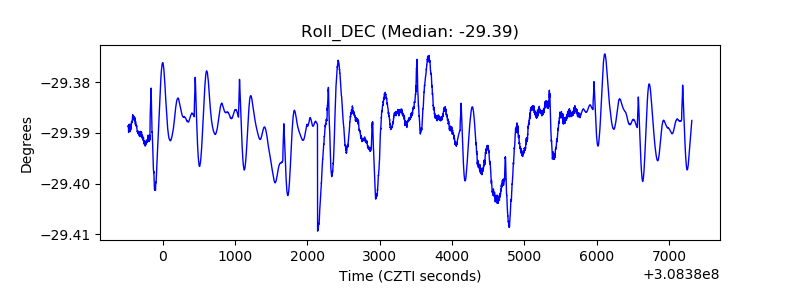 |
| _Roll_RA | 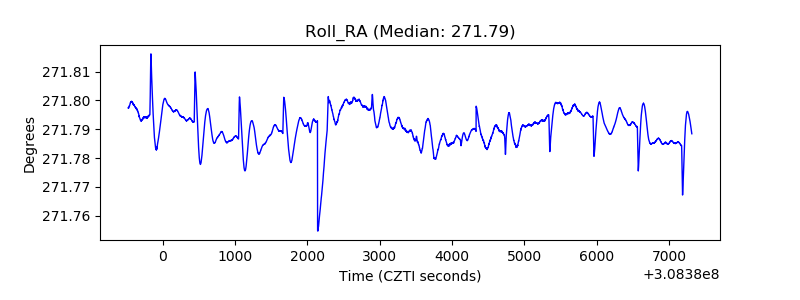 |
| Veto Counter | 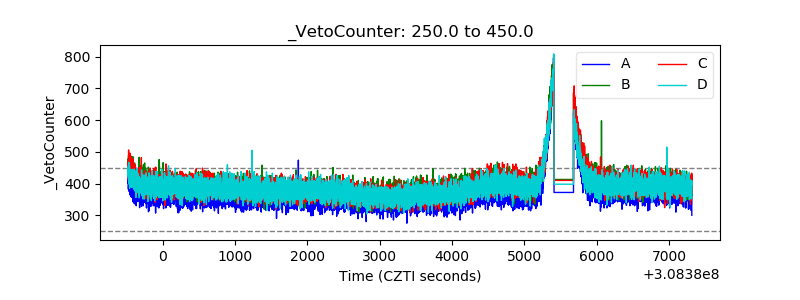 |