| Param | Original file | Final file |
|---|---|---|
| Filename | modeM0/AS1A07_006T02_9000003228_21807cztM0_level2.evt | modeM0/AS1A07_006T02_9000003228_21807cztM0_level2_quad_clean.evt |
| Size (bytes) | 997,781,760 | 197,127,360 |
| Size | 951.6 MB | 188.0 MB |
| Events in quadrant A | 7,133,081 | 1,264,214 |
| Events in quadrant B | 7,266,142 | 1,278,535 |
| Events in quadrant C | 6,741,436 | 1,243,258 |
| Events in quadrant D | 8,102,639 | 1,190,586 |
| Mode M0 | |||
|---|---|---|---|
| Quadrant | BADHDUFLAG | Total packets | Discarded packets |
| A | 0 | 30419 | 2 |
| B | 0 | 30519 | 2 |
| C | 0 | 29395 | 2 |
| D | 0 | 33697 | 2 |
| Mode M9 | |||
|---|---|---|---|
| Quadrant | BADHDUFLAG | Total packets | Discarded packets |
| A | 0 | 11 | 0 |
| B | 0 | 11 | 0 |
| C | 0 | 11 | 0 |
| D | 0 | 11 | 0 |
| Mode SS | |||
|---|---|---|---|
| Quadrant | BADHDUFLAG | Total packets | Discarded packets |
| A | 0 | 290 | 0 |
| B | 0 | 290 | 0 |
| C | 0 | 290 | 0 |
| D | 0 | 290 | 0 |
| Quadrant | Total seconds | Saturated seconds | Saturation percentage |
|---|---|---|---|
| A | 14406 | 194 | 1.346661% |
| B | 14407 | 235 | 1.631152% |
| C | 14407 | 258 | 1.790796% |
| D | 14407 | 420 | 2.915250% |
Noise dominated data is calculated using 1-second bins in cleaned event files. If a bin has >2000 counts, and if more than 50% of those come from <1% of pixels, then it is considered to be noise-dominated and hence unusable.
| Quadrant | # 1 sec bins | Bins with >0 counts | Bins with >2000 counts | High rate bins dominated by noise | Noise dominated (total time) | Noise dominated (detector-on time) | Marked lightcurve |
|---|---|---|---|---|---|---|---|
| A | 15466 | 14406 | 9 | 9 | 0.06% | 0.06% | 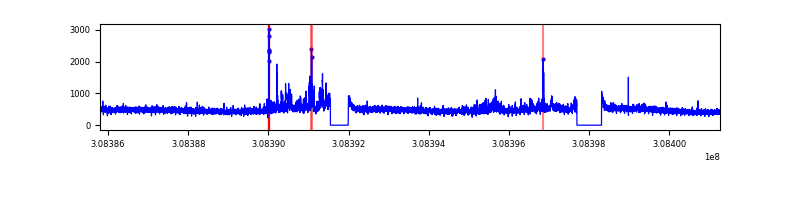 |
| B | 15467 | 14408 | 40 | 40 | 0.26% | 0.28% | 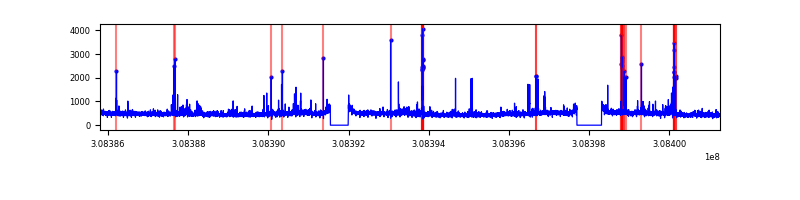 |
| C | 15467 | 14408 | 2 | 2 | 0.01% | 0.01% |  |
| D | 15467 | 14407 | 247 | 247 | 1.60% | 1.71% | 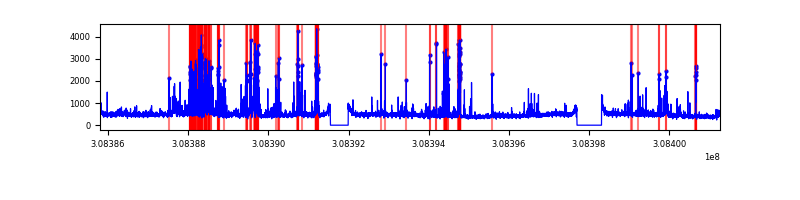 |
Top three noisy pixels from each quadrant. If the there are fewer than three noisy pixels in the level2.evt file, extra rows are filled as -1
| Pixel properties | Quadrant properties | ||||||
|---|---|---|---|---|---|---|---|
| Quadrant | DetID | PixID | Counts | Sigma | Mean | Median | Sigma |
| A | 14 | 235 | 431277 | 1225.96 | 1735 | 1691 | 350.4 |
| A | 13 | 254 | 26790 | 71.63 | 1735 | 1691 | 350.4 |
| A | 0 | 226 | 15282 | 38.79 | 1735 | 1691 | 350.4 |
| B | 3 | 64 | 228750 | 686.35 | 1731 | 1685 | 330.8 |
| B | 0 | 190 | 101970 | 303.13 | 1731 | 1685 | 330.8 |
| B | 0 | 230 | 41748 | 121.1 | 1731 | 1685 | 330.8 |
| C | 14 | 238 | 257392 | 656.87 | 1659 | 1667 | 389.3 |
| C | 10 | 22 | 18220 | 42.52 | 1659 | 1667 | 389.3 |
| C | 13 | 61 | 11705 | 25.78 | 1659 | 1667 | 389.3 |
| D | 1 | 52 | 818232 | 1994.27 | 1673 | 1623 | 409.5 |
| D | 13 | 104 | 362174 | 880.51 | 1673 | 1623 | 409.5 |
| D | 13 | 153 | 322827 | 784.42 | 1673 | 1623 | 409.5 |
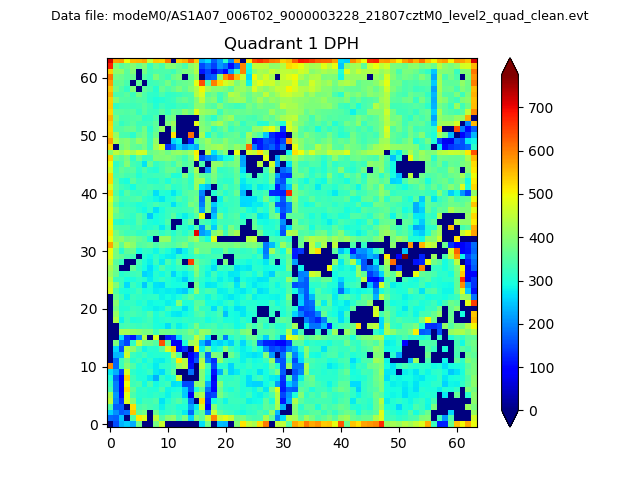
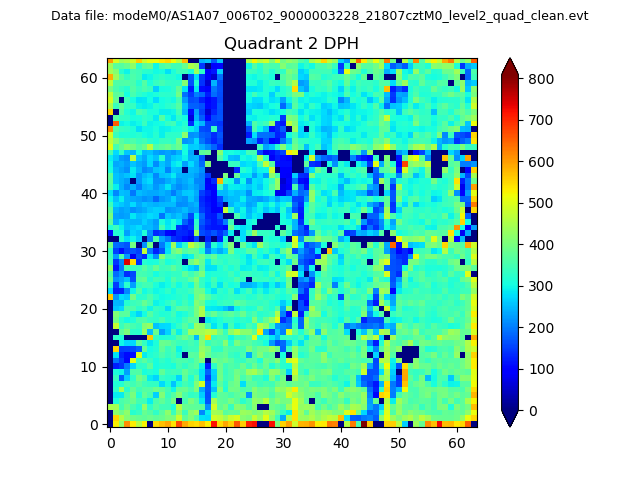
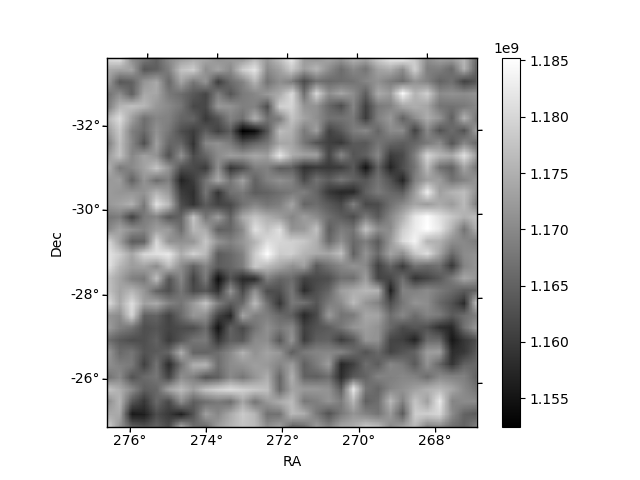
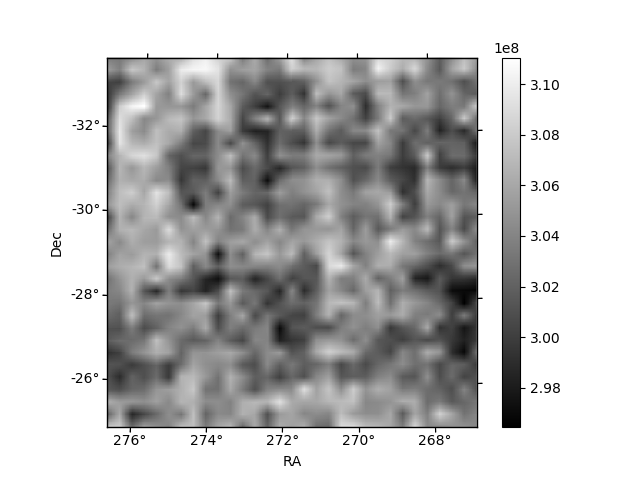
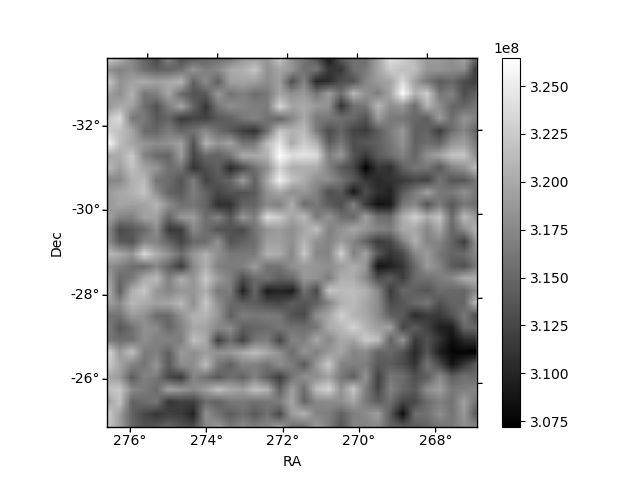
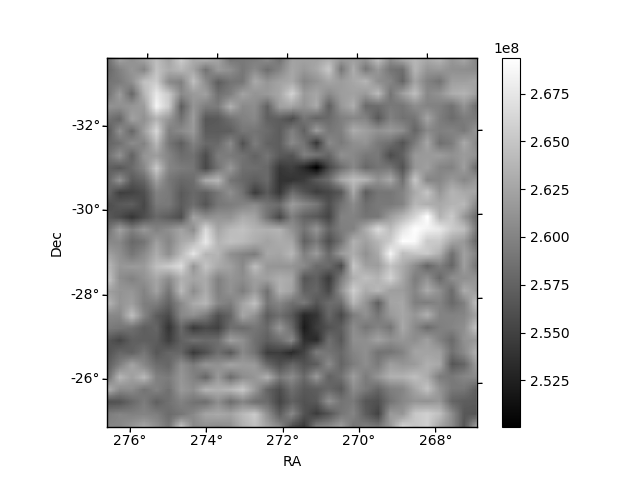
Histogram calculated using DETX and DETY for each event in the final _common_clean file
| Quadrant A | 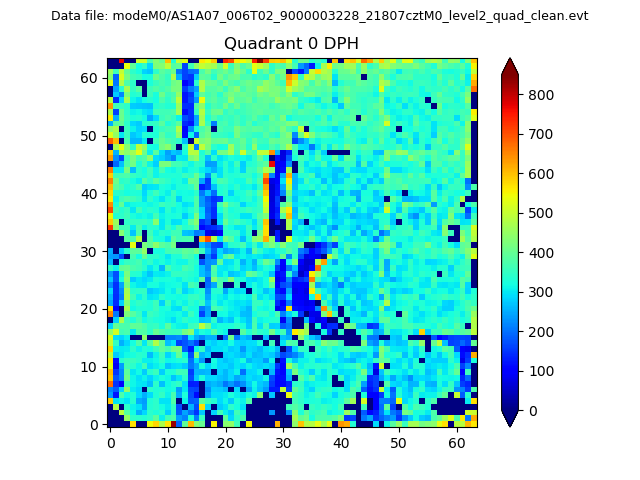 |
 |
Quadrant B |
|---|---|---|---|
| Quadrant D | 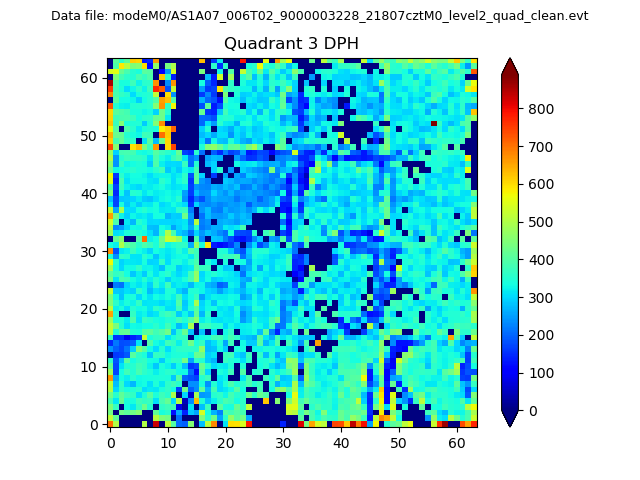 |
 |
Quadrant C |
| Plot type | Count rate plots | Images |
|---|---|---|
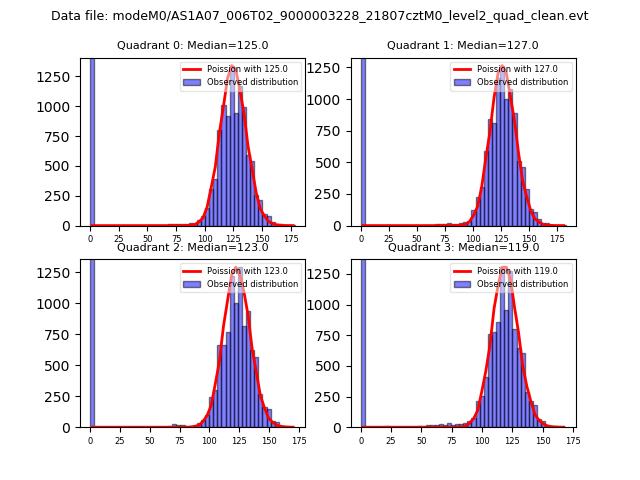
| Comparison with Poisson distribution Blue bars denote a histogram of data divided into 1 sec bins. Red curve is a Poisson curve with rate = median count rate of data. |
 |
 |
| Quadrant-wise count rates Data is divided into 100 sec bins |
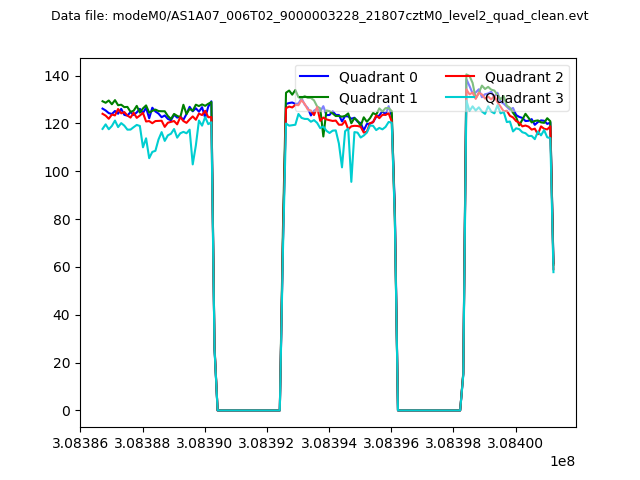 |
|
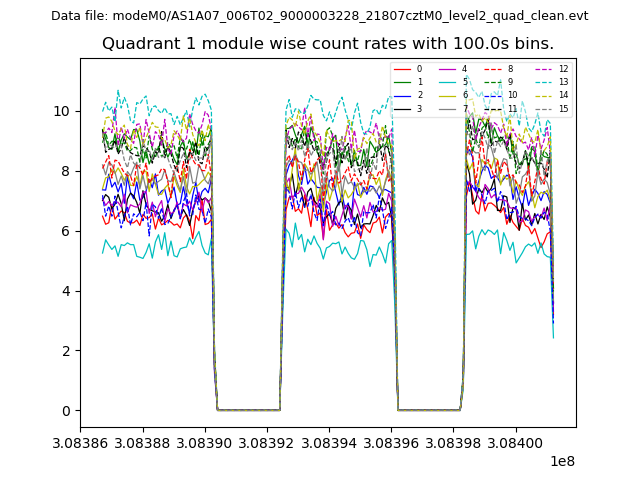
| Module-wise count rates for Quadrant A Data is divided into 100 sec bins |
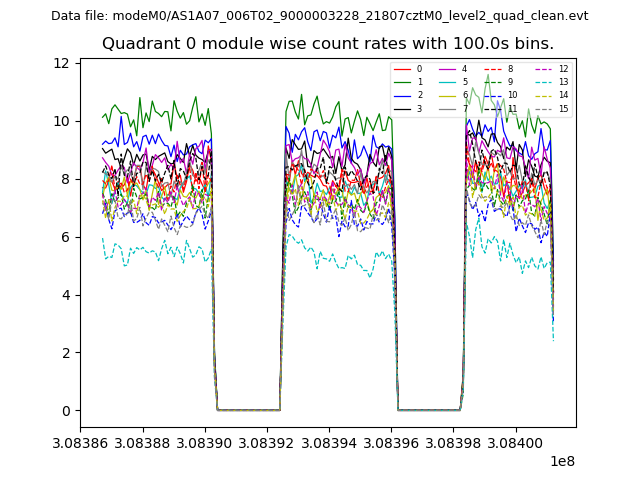 |
 |
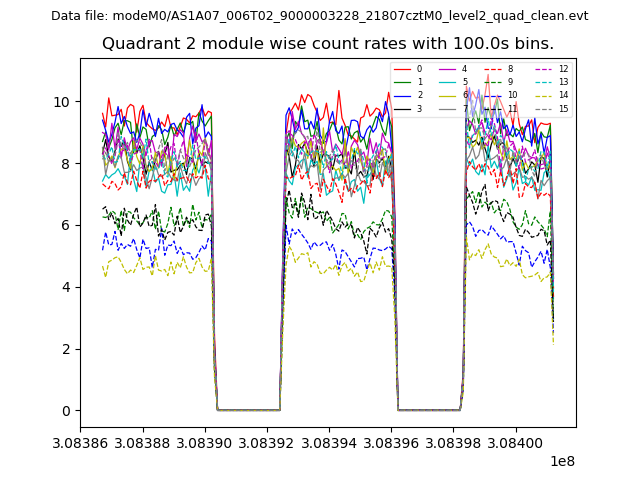
| Module-wise count rates for Quadrant B Data is divided into 100 sec bins |
 |
 |
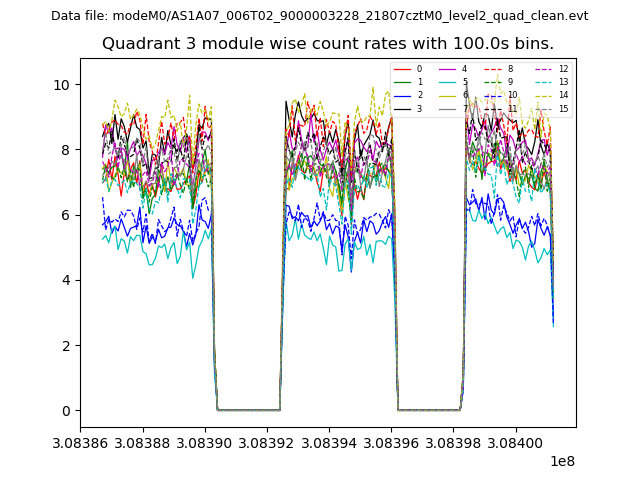
| Module-wise count rates for Quadrant C Data is divided into 100 sec bins |
 |
 |
| Module-wise count rates for Quadrant D Data is divided into 100 sec bins |
 |
 |
| Parameter | Plot |
|---|---|
| CZT HV Monitor | 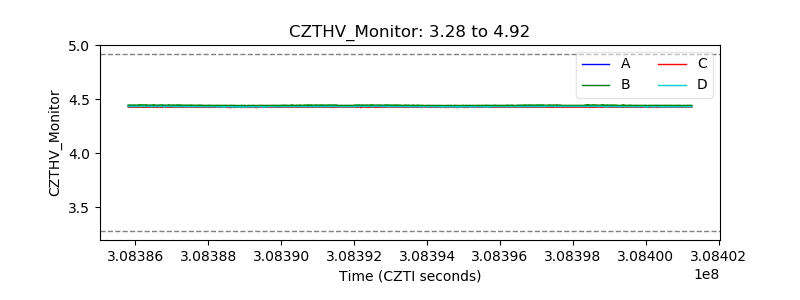 |
| D_VDD | 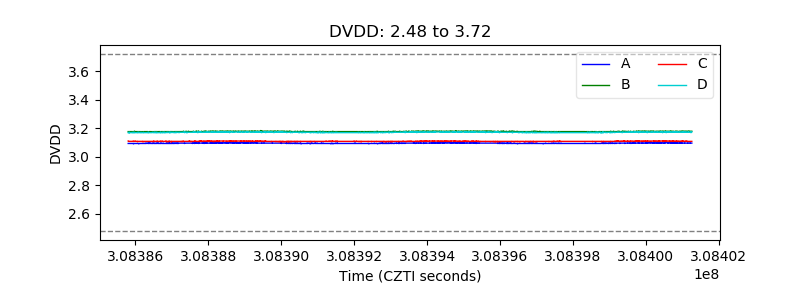 |
| Temperature 1 | 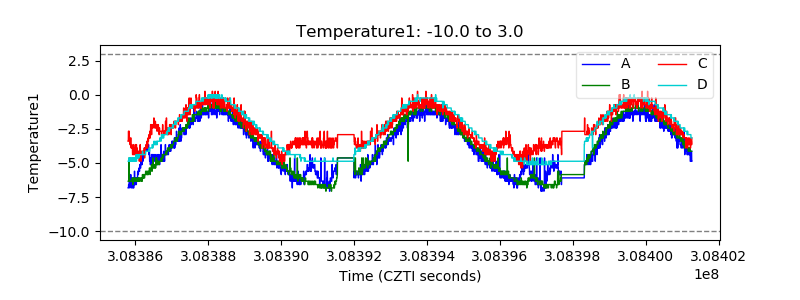 |
| Veto HV Monitor |  |
| Veto LLD | 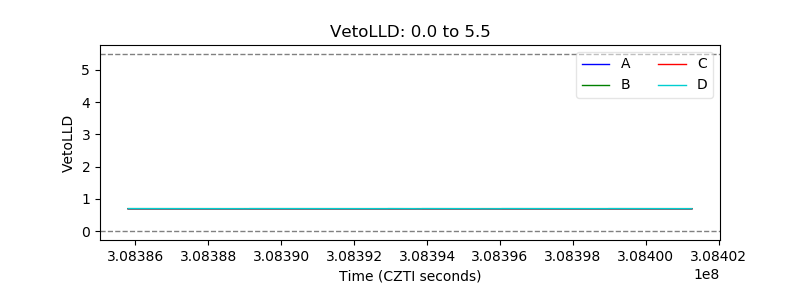 |
| Alpha Counter | 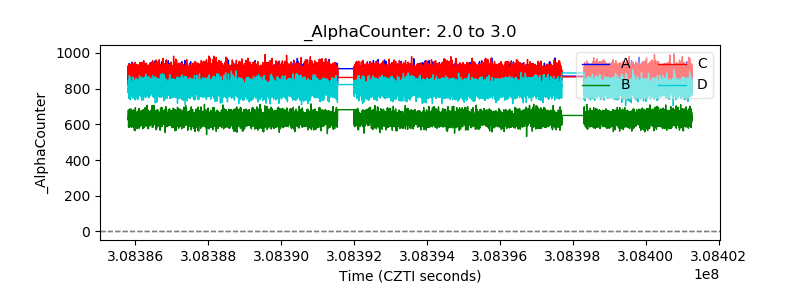 |
| _CPM_Rate | 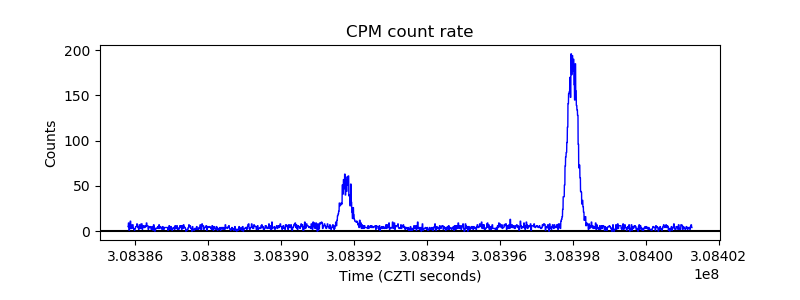 |
| CZT Counter | 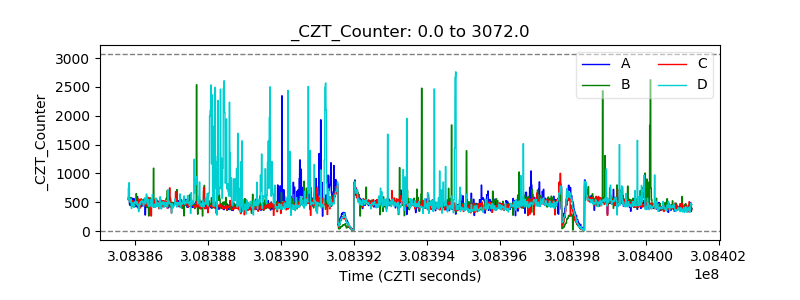 |
| +2.5 Volts monitor |  |
| +5 Volts monitor |  |
| _ROLL_ROT | 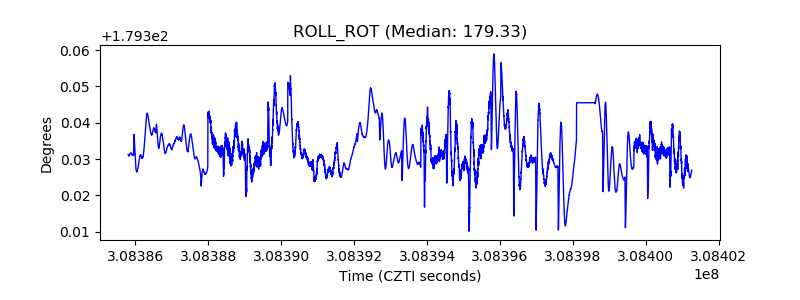 |
| _Roll_DEC | 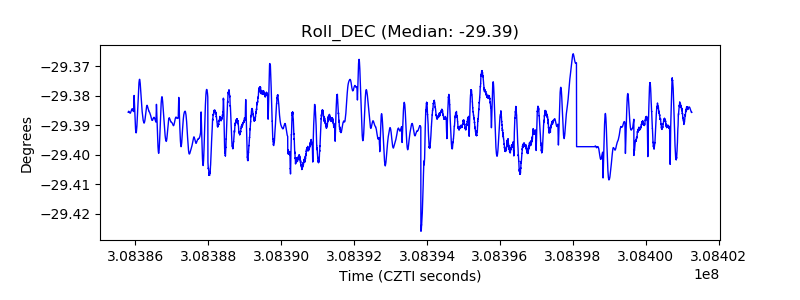 |
| _Roll_RA | 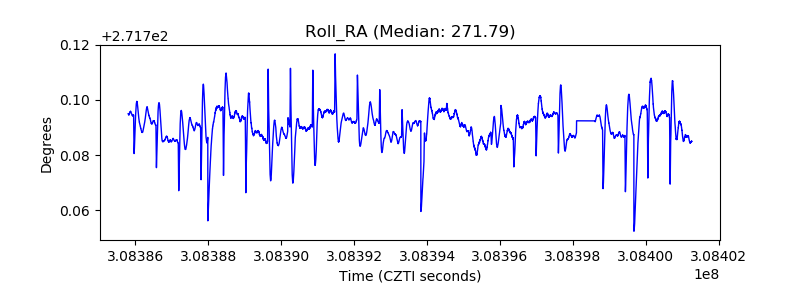 |
| Veto Counter | 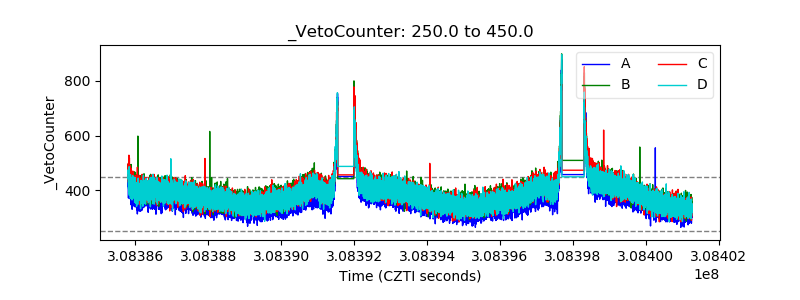 |