| Param | Original file | Final file |
|---|---|---|
| Filename | modeM0/AS1A07_004T01_9000003230cztM0_level2.fits | modeM0/AS1A07_004T01_9000003230cztM0_level2_quad_clean.evt |
| Size (bytes) | 2,390,849,280 | 1,942,119,360 |
| Size | 2.2 GB | 1.8 GB |
| Events in quadrant A | 14,733,522 | 10,923,958 |
| Events in quadrant B | 14,127,134 | 10,993,456 |
| Events in quadrant C | 14,396,262 | 10,608,106 |
| Events in quadrant D | 12,358,760 | 9,498,729 |
| Mode SS | |||
|---|---|---|---|
| Quadrant | BADHDUFLAG | Total packets | Discarded packets |
| A | 0 | 5002 | 0 |
| B | 0 | 5002 | 0 |
| C | 0 | 5002 | 0 |
| D | 0 | 5002 | 0 |
| Mode M0 | |||
|---|---|---|---|
| Quadrant | BADHDUFLAG | Total packets | Discarded packets |
| A | 0 | 517786 | 0 |
| B | 0 | 538380 | 0 |
| C | 0 | 507541 | 0 |
| D | 0 | 599119 | 0 |
| Mode M9 | |||
|---|---|---|---|
| Quadrant | BADHDUFLAG | Total packets | Discarded packets |
| A | 0 | 410 | 0 |
| B | 0 | 410 | 0 |
| C | 0 | 410 | 0 |
| D | 0 | 410 | 0 |
| Quadrant | Total seconds | Saturated seconds | Saturation percentage |
|---|---|---|---|
| A | 245116 | 3581 | 1.460941% |
| B | 245116 | 4741 | 1.934186% |
| C | 245116 | 3857 | 1.573541% |
| D | 245116 | 6585 | 2.686483% |
Noise dominated data is calculated using 1-second bins in cleaned event files. If a bin has >2000 counts, and if more than 50% of those come from <1% of pixels, then it is considered to be noise-dominated and hence unusable.
| Quadrant | # 1 sec bins | Bins with >0 counts | Bins with >2000 counts | High rate bins dominated by noise | Noise dominated (total time) | Noise dominated (detector-on time) | Marked lightcurve |
|---|---|---|---|---|---|---|---|
| A | 286357 | 245096 | 0 | 0 | 0.00% | 0.00% |  |
| B | 286357 | 245071 | 0 | 0 | 0.00% | 0.00% |  |
| C | 286357 | 245095 | 0 | 0 | 0.00% | 0.00% |  |
| D | 286357 | 245016 | 0 | 0 | 0.00% | 0.00% |  |
Top three noisy pixels from each quadrant. If the there are fewer than three noisy pixels in the level2.evt file, extra rows are filled as -1
| Pixel properties | Quadrant properties | ||||||
|---|---|---|---|---|---|---|---|
| Quadrant | DetID | PixID | Counts | Sigma | Mean | Median | Sigma |
| A | 0 | 29 | 14215 | 11.45 | 3831 | 3598 | 927.6 |
| A | 7 | 110 | 12156 | 9.23 | 3831 | 3598 | 927.6 |
| A | 0 | 30 | 11181 | 8.17 | 3831 | 3598 | 927.6 |
| B | 2 | 9 | 11533 | 10.95 | 3741 | 3573 | 726.8 |
| B | 2 | 8 | 9585 | 8.27 | 3741 | 3573 | 726.8 |
| B | 14 | 254 | 9347 | 7.94 | 3741 | 3573 | 726.8 |
| C | 3 | 234 | 10157 | 6.83 | 3801 | 3544 | 968.2 |
| C | 12 | 241 | 9971 | 6.64 | 3801 | 3544 | 968.2 |
| C | 3 | 126 | 9661 | 6.32 | 3801 | 3544 | 968.2 |
| D | 3 | 14 | 9005 | 6.15 | 3535 | 3210 | 942.3 |
| D | 6 | 231 | 8680 | 5.8 | 3535 | 3210 | 942.3 |
| D | 10 | 189 | 8640 | 5.76 | 3535 | 3210 | 942.3 |
Histogram calculated using DETX and DETY for each event in the final _common_clean file
| Quadrant A | 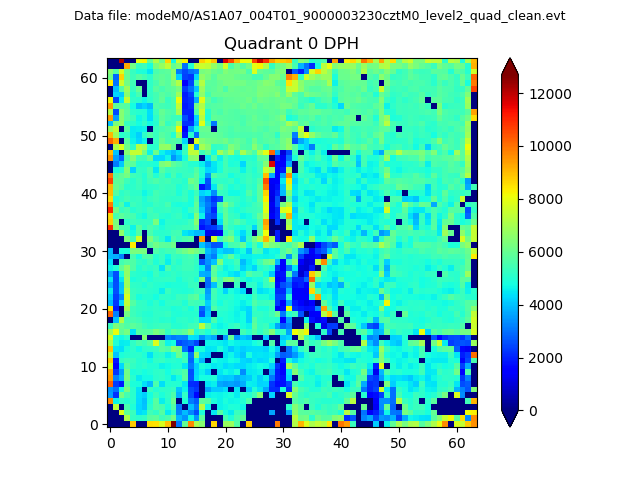 |
 |
Quadrant B |
|---|---|---|---|
| Quadrant D |  |
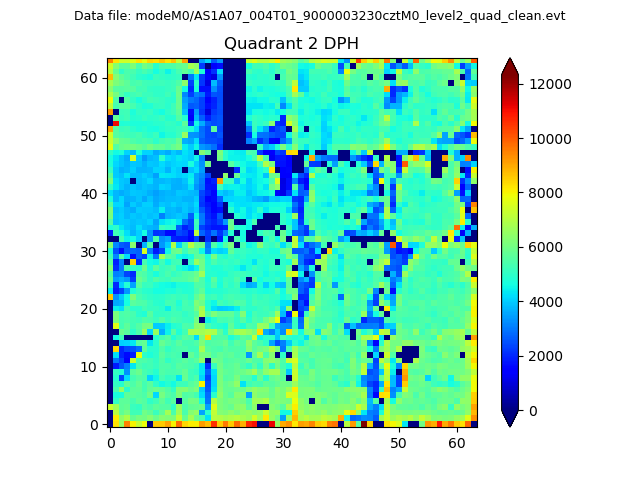 |
Quadrant C |
| Plot type | Count rate plots | Images |
|---|---|---|
| Comparison with Poisson distribution Blue bars denote a histogram of data divided into 1 sec bins. Red curve is a Poisson curve with rate = median count rate of data. |
 |
 |
| Quadrant-wise count rates Data is divided into 100 sec bins |
 |
|
| Module-wise count rates for Quadrant A Data is divided into 100 sec bins |
 |
 |
| Module-wise count rates for Quadrant B Data is divided into 100 sec bins |
 |
 |
| Module-wise count rates for Quadrant C Data is divided into 100 sec bins |
 |
 |
| Module-wise count rates for Quadrant D Data is divided into 100 sec bins |
 |
 |
| Parameter | Plot |
|---|---|
| CZT HV Monitor |  |
| D_VDD |  |
| Temperature 1 |  |
| Veto HV Monitor |  |
| Veto LLD |  |
| Alpha Counter |  |
| _CPM_Rate |  |
| CZT Counter |  |
| +2.5 Volts monitor |  |
| +5 Volts monitor |  |
| _ROLL_ROT |  |
| _Roll_DEC |  |
| _Roll_RA |  |
| Veto Counter |  |