| Param | Original file | Final file |
|---|---|---|
| Filename | modeM0/AS1A07_004T01_9000003230_21808cztM0_level2.evt | modeM0/AS1A07_004T01_9000003230_21808cztM0_level2_quad_clean.evt |
| Size (bytes) | 427,867,200 | 84,548,160 |
| Size | 408.0 MB | 80.6 MB |
| Events in quadrant A | 3,002,171 | 542,382 |
| Events in quadrant B | 3,192,307 | 546,662 |
| Events in quadrant C | 2,910,655 | 526,836 |
| Events in quadrant D | 3,432,251 | 512,627 |
| Mode SS | |||
|---|---|---|---|
| Quadrant | BADHDUFLAG | Total packets | Discarded packets |
| A | 0 | 126 | 0 |
| B | 0 | 126 | 0 |
| C | 0 | 126 | 0 |
| D | 0 | 126 | 0 |
| Mode M0 | |||
|---|---|---|---|
| Quadrant | BADHDUFLAG | Total packets | Discarded packets |
| A | 0 | 12985 | 1 |
| B | 0 | 13473 | 1 |
| C | 0 | 12722 | 1 |
| D | 0 | 14133 | 1 |
| Mode M9 | |||
|---|---|---|---|
| Quadrant | BADHDUFLAG | Total packets | Discarded packets |
| A | 0 | 10 | 0 |
| B | 0 | 10 | 0 |
| C | 0 | 10 | 0 |
| D | 0 | 10 | 0 |
| Quadrant | Total seconds | Saturated seconds | Saturation percentage |
|---|---|---|---|
| A | 6187 | 57 | 0.921287% |
| B | 6186 | 70 | 1.131587% |
| C | 6186 | 67 | 1.083091% |
| D | 6186 | 60 | 0.969932% |
Noise dominated data is calculated using 1-second bins in cleaned event files. If a bin has >2000 counts, and if more than 50% of those come from <1% of pixels, then it is considered to be noise-dominated and hence unusable.
| Quadrant | # 1 sec bins | Bins with >0 counts | Bins with >2000 counts | High rate bins dominated by noise | Noise dominated (total time) | Noise dominated (detector-on time) | Marked lightcurve |
|---|---|---|---|---|---|---|---|
| A | 7162 | 6188 | 11 | 11 | 0.15% | 0.18% | 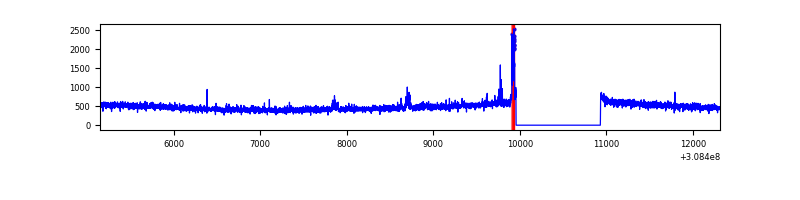 |
| B | 7161 | 6187 | 16 | 16 | 0.22% | 0.26% | 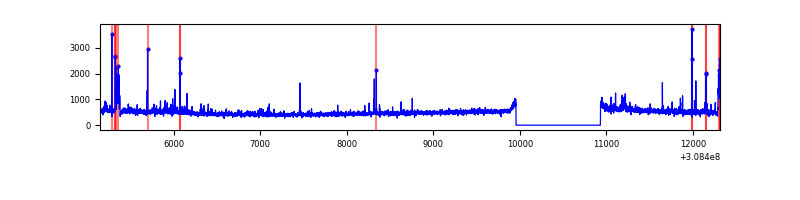 |
| C | 7161 | 6186 | 0 | 0 | 0.00% | 0.00% | 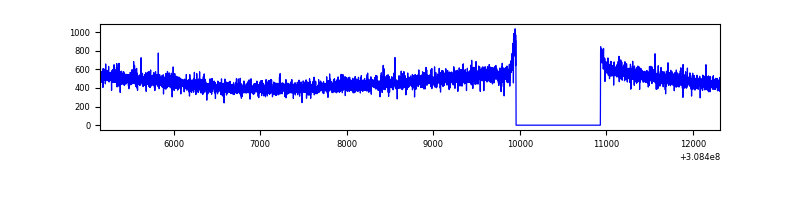 |
| D | 7161 | 6187 | 35 | 35 | 0.49% | 0.57% | 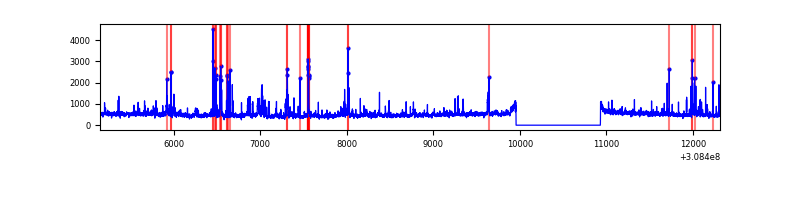 |
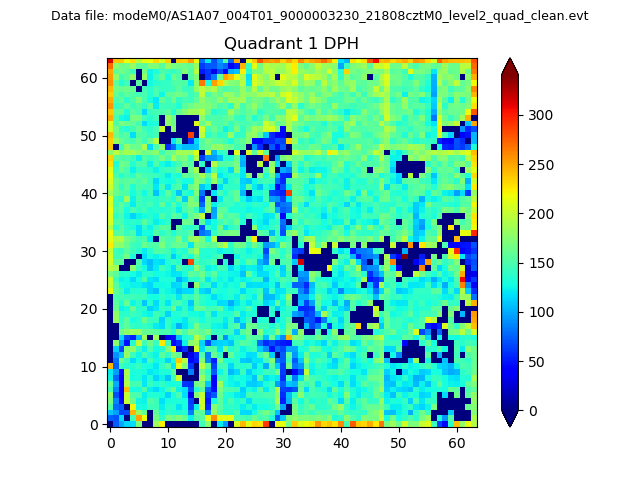
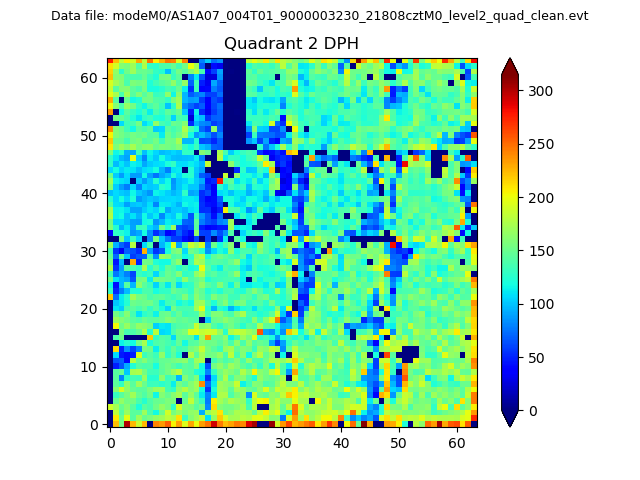
Top three noisy pixels from each quadrant. If the there are fewer than three noisy pixels in the level2.evt file, extra rows are filled as -1
| Pixel properties | Quadrant properties | ||||||
|---|---|---|---|---|---|---|---|
| Quadrant | DetID | PixID | Counts | Sigma | Mean | Median | Sigma |
| A | 14 | 235 | 82737 | 537.01 | 755 | 739 | 152.7 |
| A | 13 | 254 | 12511 | 77.1 | 755 | 739 | 152.7 |
| A | 13 | 252 | 9389 | 56.65 | 755 | 739 | 152.7 |
| B | 3 | 64 | 79741 | 546.64 | 751 | 732 | 144.5 |
| B | 0 | 197 | 76491 | 524.16 | 751 | 732 | 144.5 |
| B | 0 | 190 | 48210 | 328.49 | 751 | 732 | 144.5 |
| C | 14 | 238 | 111944 | 658.88 | 715 | 719 | 168.8 |
| C | 8 | 128 | 6458 | 34.0 | 715 | 719 | 168.8 |
| C | 13 | 61 | 5015 | 25.45 | 715 | 719 | 168.8 |
| D | 1 | 52 | 341208 | 1918.43 | 728 | 707 | 177.5 |
| D | 2 | 136 | 91023 | 508.85 | 728 | 707 | 177.5 |
| D | 13 | 153 | 84306 | 471.01 | 728 | 707 | 177.5 |
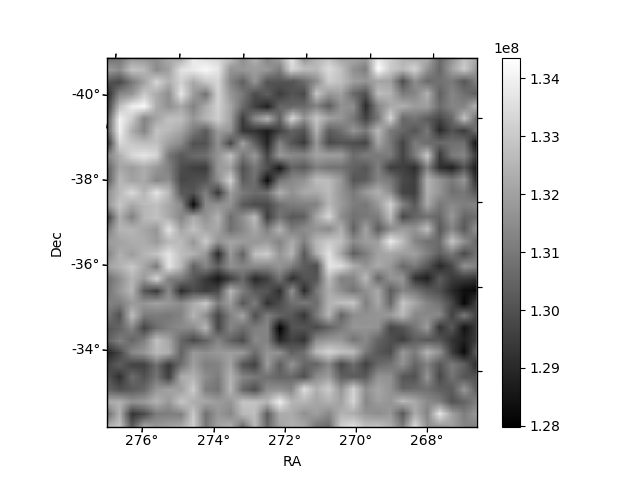
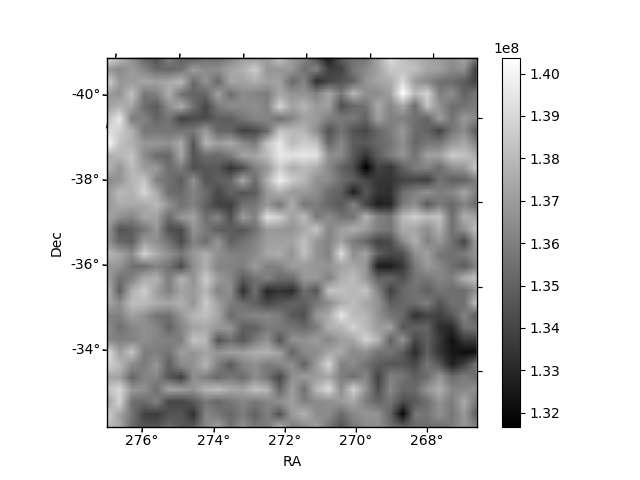
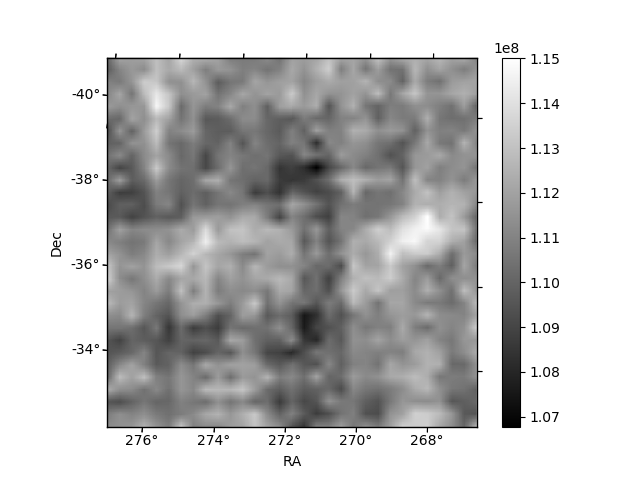
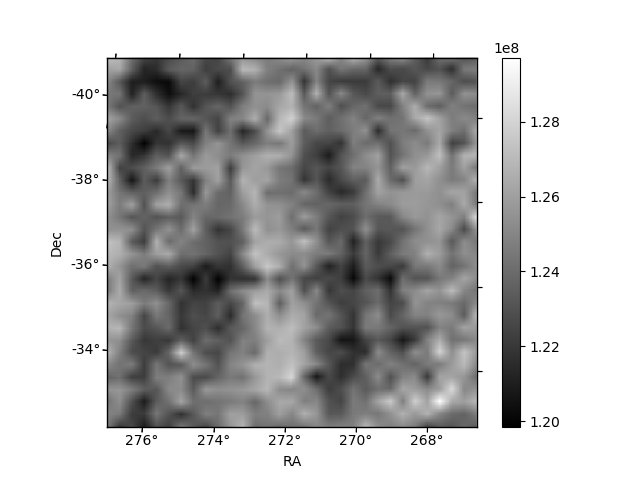
Histogram calculated using DETX and DETY for each event in the final _common_clean file
| Quadrant A | 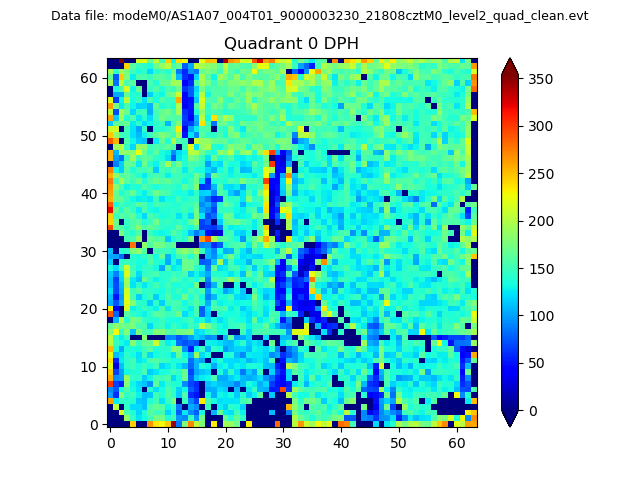 |
 |
Quadrant B |
|---|---|---|---|
| Quadrant D | 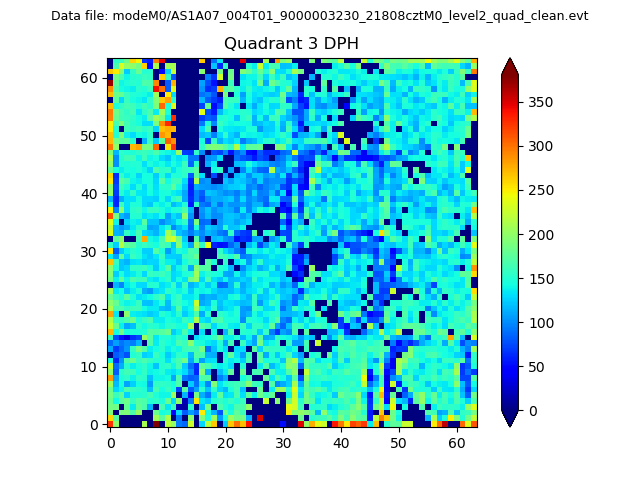 |
 |
Quadrant C |
| Plot type | Count rate plots | Images |
|---|---|---|
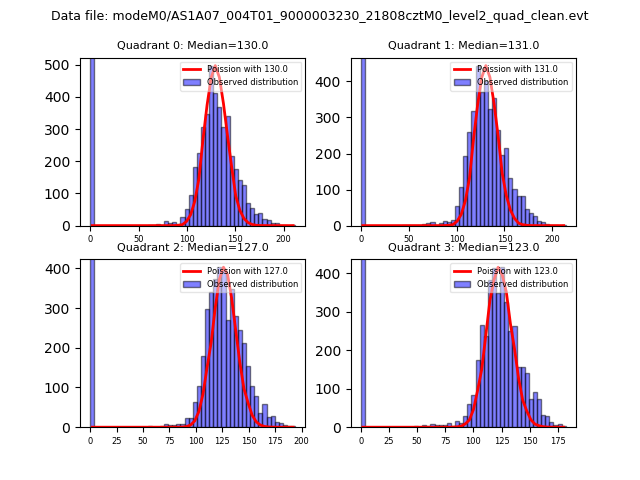
| Comparison with Poisson distribution Blue bars denote a histogram of data divided into 1 sec bins. Red curve is a Poisson curve with rate = median count rate of data. |
 |
 |
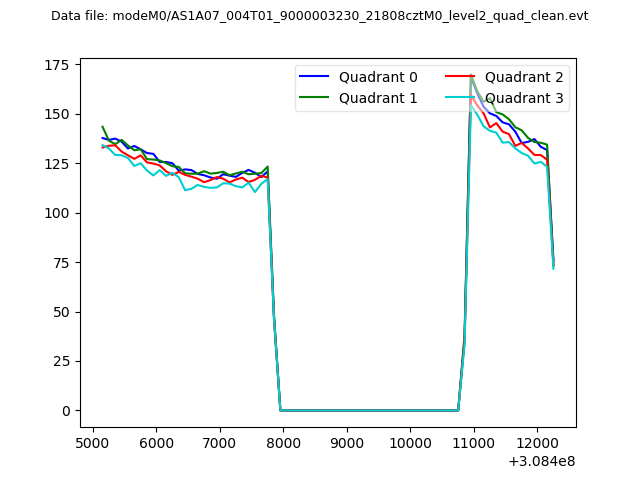
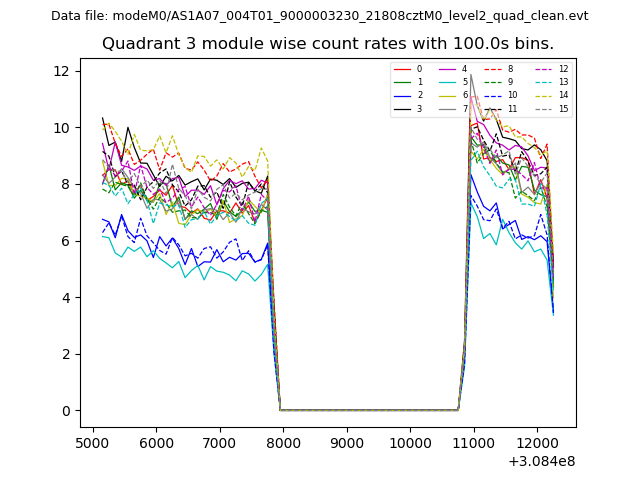
| Quadrant-wise count rates Data is divided into 100 sec bins |
 |
|
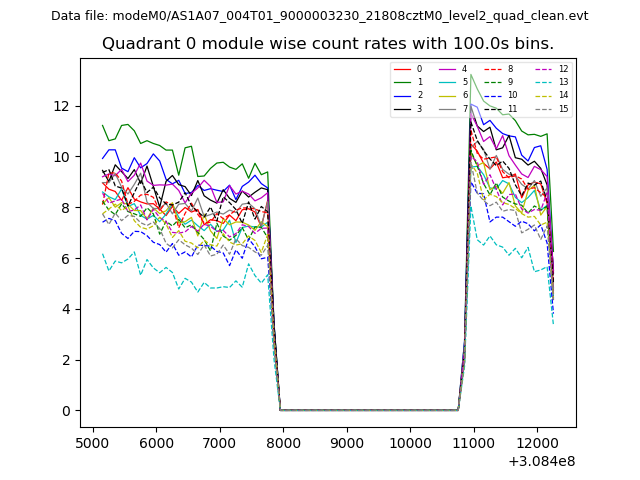
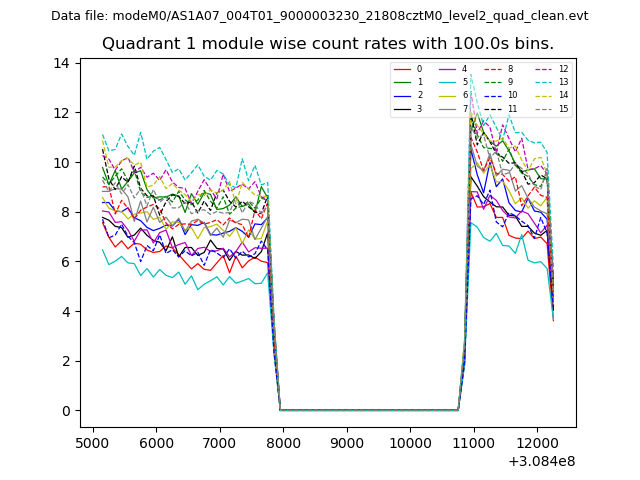
| Module-wise count rates for Quadrant A Data is divided into 100 sec bins |
 |
 |
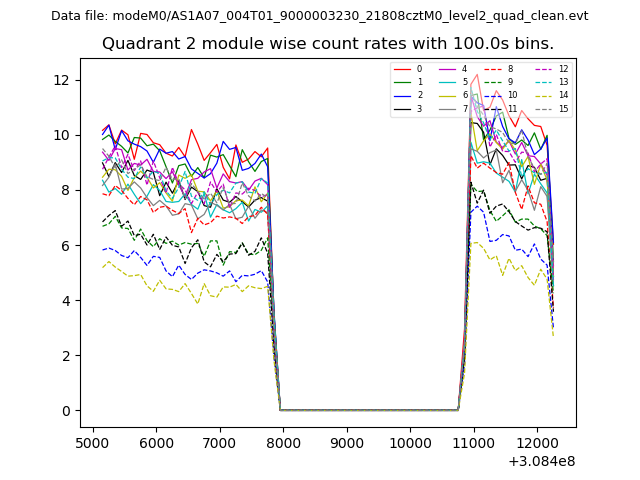
| Module-wise count rates for Quadrant B Data is divided into 100 sec bins |
 |
 |
| Module-wise count rates for Quadrant C Data is divided into 100 sec bins |
 |
 |
| Module-wise count rates for Quadrant D Data is divided into 100 sec bins |
 |
 |
| Parameter | Plot |
|---|---|
| CZT HV Monitor | 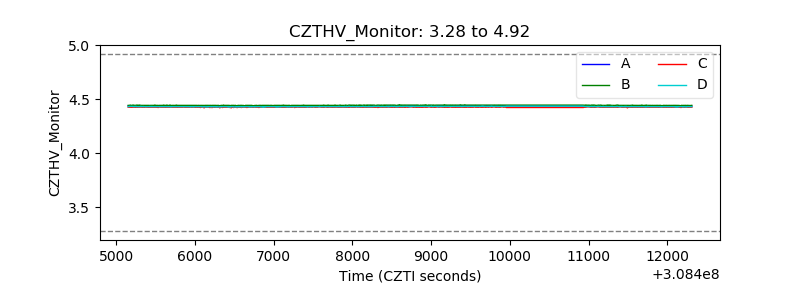 |
| D_VDD | 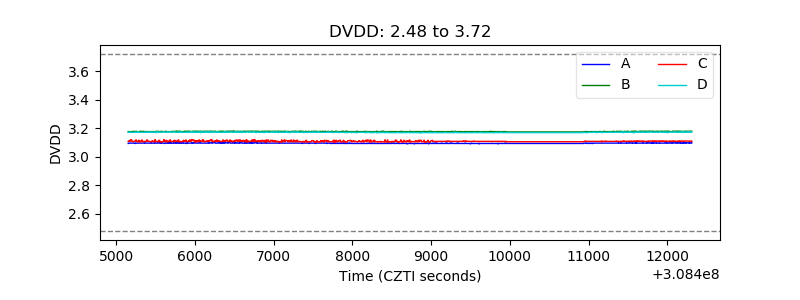 |
| Temperature 1 | 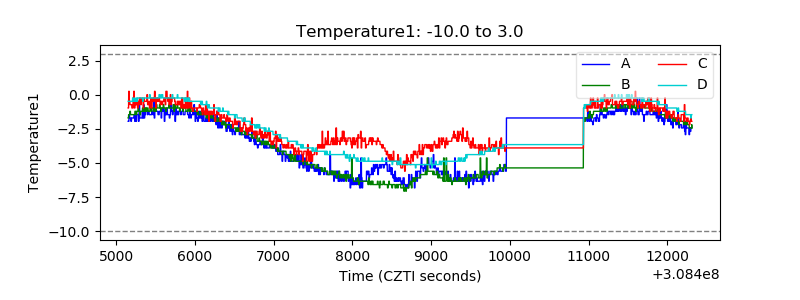 |
| Veto HV Monitor | 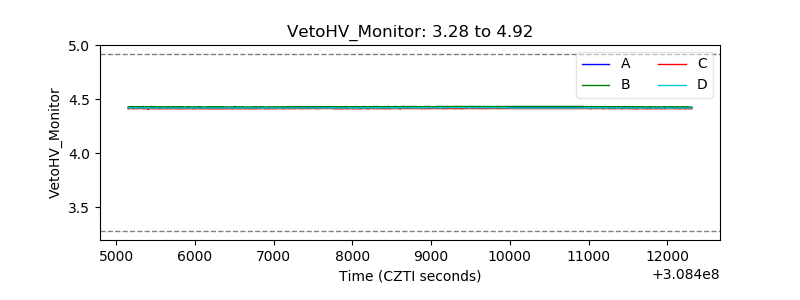 |
| Veto LLD | 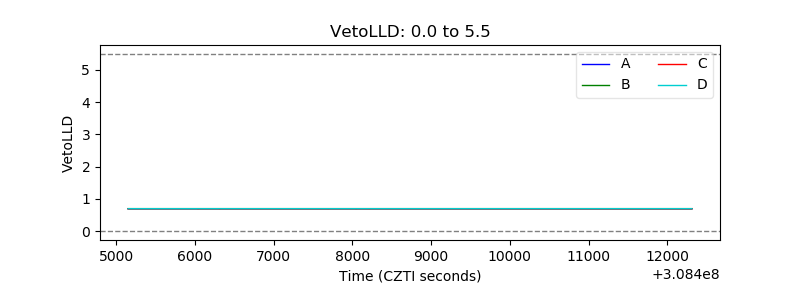 |
| Alpha Counter | 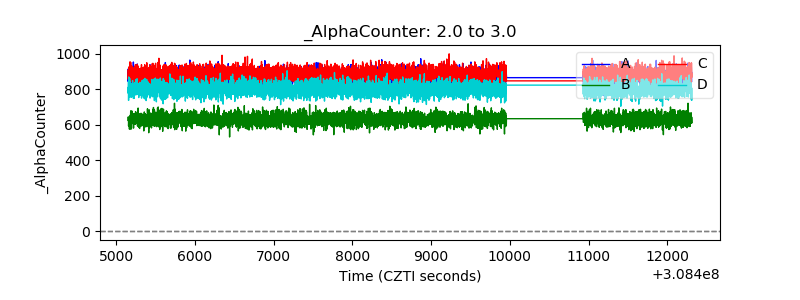 |
| _CPM_Rate | 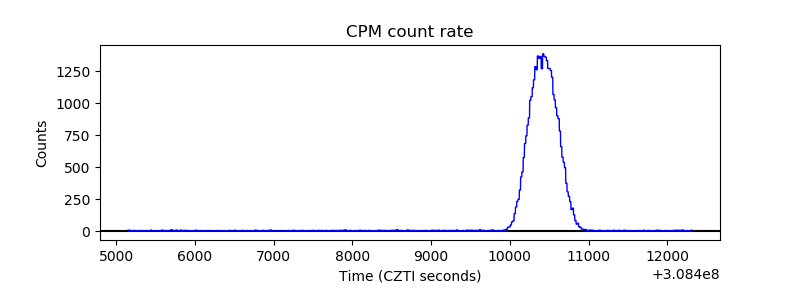 |
| CZT Counter | 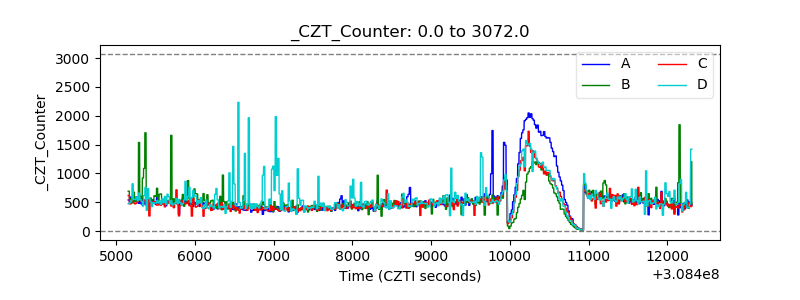 |
| +2.5 Volts monitor |  |
| +5 Volts monitor |  |
| _ROLL_ROT | 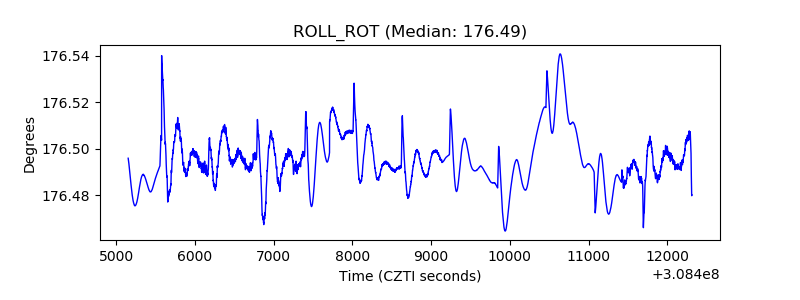 |
| _Roll_DEC | 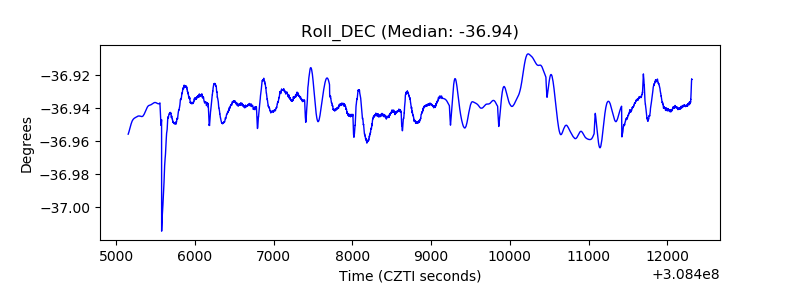 |
| _Roll_RA | 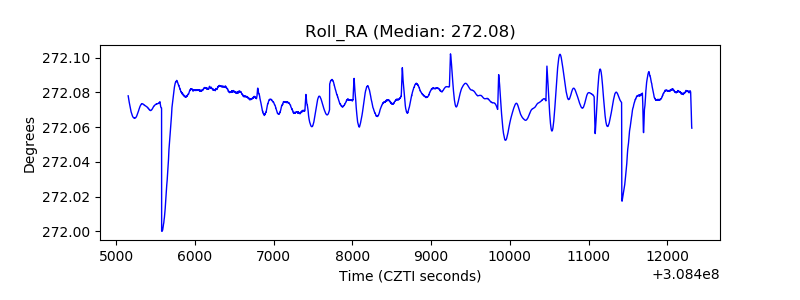 |
| Veto Counter | 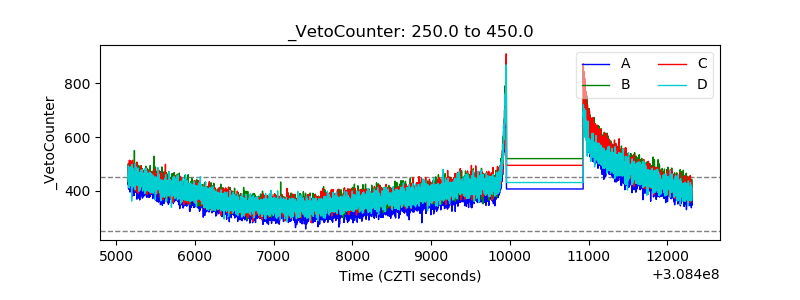 |