| Param | Original file | Final file |
|---|---|---|
| Filename | modeM0/AS1A07_004T01_9000003230_21812cztM0_level2.evt | modeM0/AS1A07_004T01_9000003230_21812cztM0_level2_quad_clean.evt |
| Size (bytes) | 481,861,440 | 94,242,240 |
| Size | 459.5 MB | 89.9 MB |
| Events in quadrant A | 3,982,108 | 593,933 |
| Events in quadrant B | 3,504,072 | 642,092 |
| Events in quadrant C | 3,131,071 | 612,489 |
| Events in quadrant D | 3,553,791 | 571,277 |
| Mode SS | |||
|---|---|---|---|
| Quadrant | BADHDUFLAG | Total packets | Discarded packets |
| A | 0 | 126 | 0 |
| B | 0 | 126 | 0 |
| C | 0 | 126 | 0 |
| D | 0 | 126 | 0 |
| Mode M0 | |||
|---|---|---|---|
| Quadrant | BADHDUFLAG | Total packets | Discarded packets |
| A | 0 | 15737 | 2 |
| B | 0 | 14234 | 2 |
| C | 0 | 13100 | 2 |
| D | 0 | 14733 | 2 |
| Mode M9 | |||
|---|---|---|---|
| Quadrant | BADHDUFLAG | Total packets | Discarded packets |
| A | 0 | 24 | 0 |
| B | 0 | 25 | 0 |
| C | 0 | 25 | 0 |
| D | 0 | 25 | 0 |
| Quadrant | Total seconds | Saturated seconds | Saturation percentage |
|---|---|---|---|
| A | 6221 | 439 | 7.056743% |
| B | 6221 | 84 | 1.350265% |
| C | 6221 | 49 | 0.787655% |
| D | 6221 | 102 | 1.639608% |
Noise dominated data is calculated using 1-second bins in cleaned event files. If a bin has >2000 counts, and if more than 50% of those come from <1% of pixels, then it is considered to be noise-dominated and hence unusable.
| Quadrant | # 1 sec bins | Bins with >0 counts | Bins with >2000 counts | High rate bins dominated by noise | Noise dominated (total time) | Noise dominated (detector-on time) | Marked lightcurve |
|---|---|---|---|---|---|---|---|
| A | 7521 | 6223 | 299 | 299 | 3.98% | 4.80% |  |
| B | 7521 | 6223 | 21 | 21 | 0.28% | 0.34% | 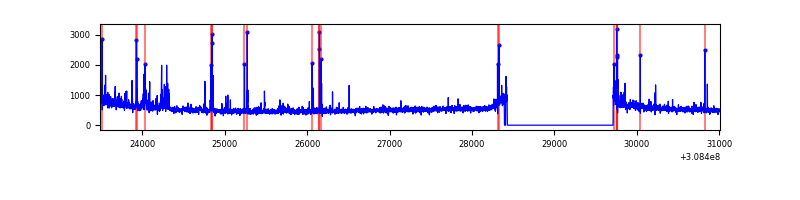 |
| C | 7521 | 6223 | 0 | 0 | 0.00% | 0.00% | 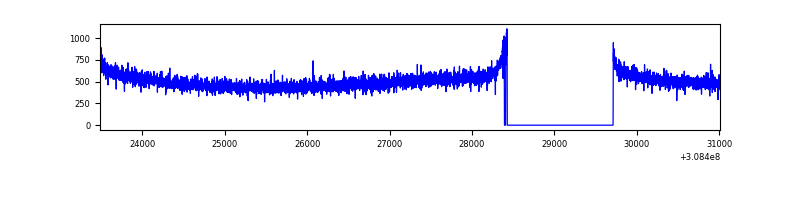 |
| D | 7521 | 6223 | 69 | 69 | 0.92% | 1.11% | 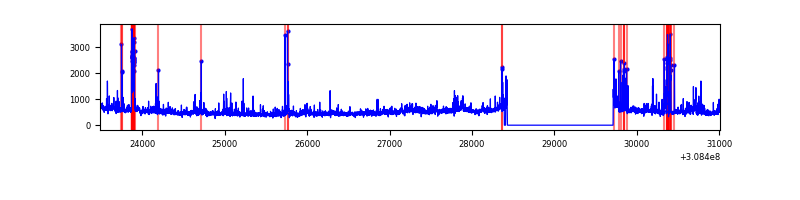 |
Top three noisy pixels from each quadrant. If the there are fewer than three noisy pixels in the level2.evt file, extra rows are filled as -1
| Pixel properties | Quadrant properties | ||||||
|---|---|---|---|---|---|---|---|
| Quadrant | DetID | PixID | Counts | Sigma | Mean | Median | Sigma |
| A | 5 | 16 | 942771 | 5957.46 | 786 | 773 | 158.1 |
| A | 13 | 254 | 12125 | 71.79 | 786 | 773 | 158.1 |
| A | 0 | 226 | 6993 | 39.34 | 786 | 773 | 158.1 |
| B | 3 | 64 | 116791 | 758.71 | 817 | 801 | 152.9 |
| B | 15 | 33 | 51734 | 333.16 | 817 | 801 | 152.9 |
| B | 0 | 230 | 46437 | 298.51 | 817 | 801 | 152.9 |
| C | 14 | 238 | 122891 | 681.93 | 770 | 778 | 179.1 |
| C | 13 | 61 | 5542 | 26.6 | 770 | 778 | 179.1 |
| C | 0 | 10 | 4777 | 22.33 | 770 | 778 | 179.1 |
| D | 1 | 52 | 307225 | 1642.53 | 764 | 742 | 186.6 |
| D | 13 | 104 | 108860 | 579.43 | 764 | 742 | 186.6 |
| D | 5 | 32 | 88167 | 468.53 | 764 | 742 | 186.6 |
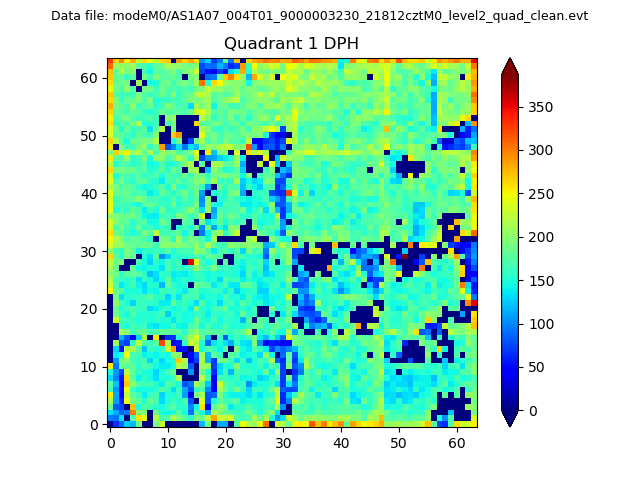
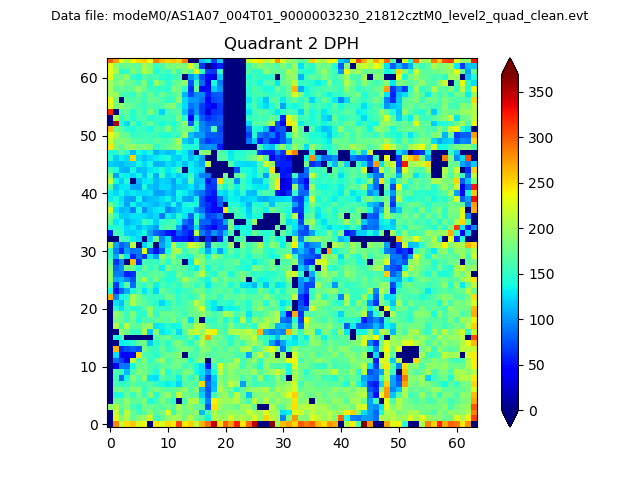
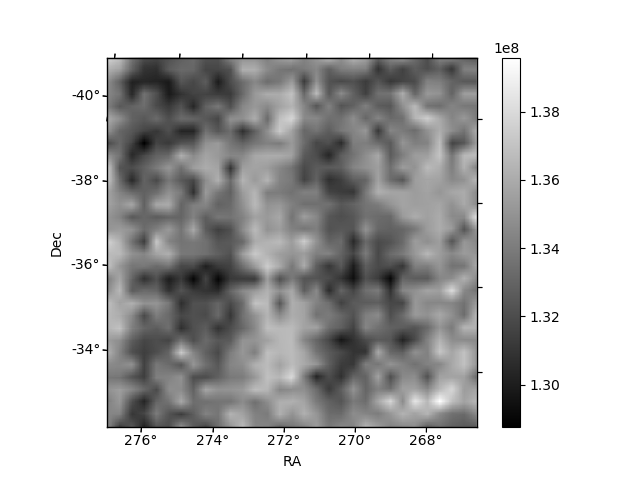
Histogram calculated using DETX and DETY for each event in the final _common_clean file
| Quadrant A | 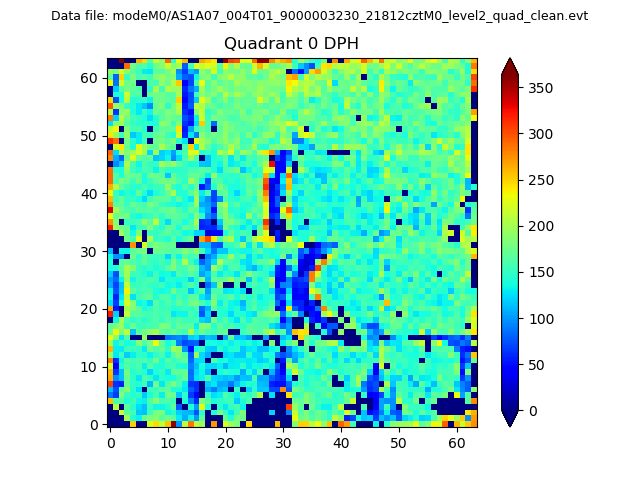 |
 |
Quadrant B |
|---|---|---|---|
| Quadrant D | 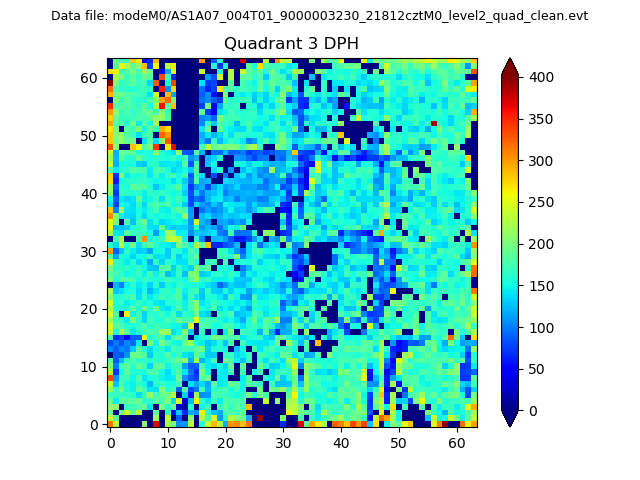 |
 |
Quadrant C |
| Plot type | Count rate plots | Images |
|---|---|---|
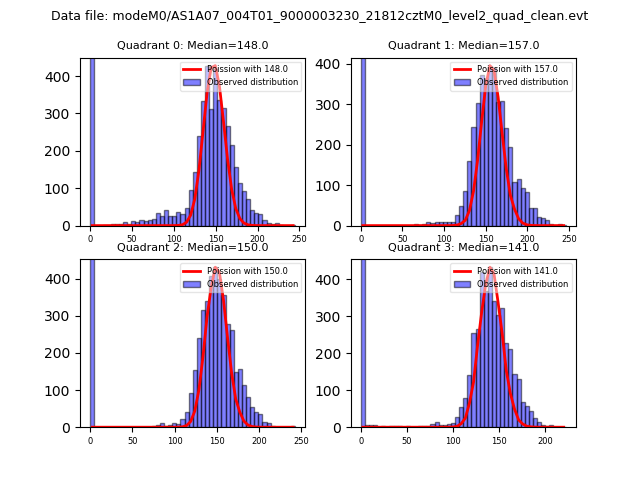
| Comparison with Poisson distribution Blue bars denote a histogram of data divided into 1 sec bins. Red curve is a Poisson curve with rate = median count rate of data. |
 |
 |
| Quadrant-wise count rates Data is divided into 100 sec bins |
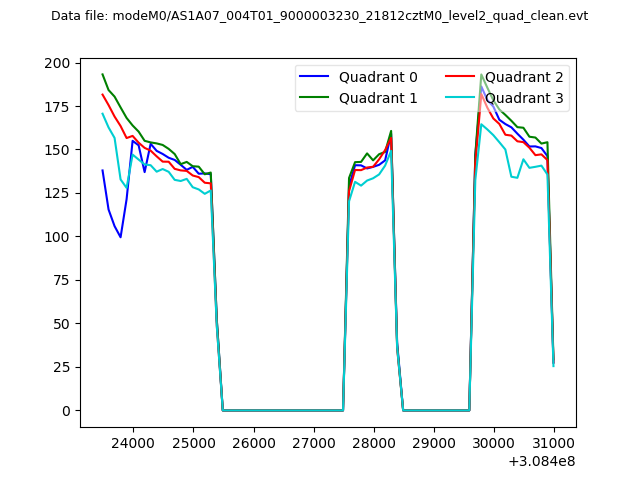 |
|
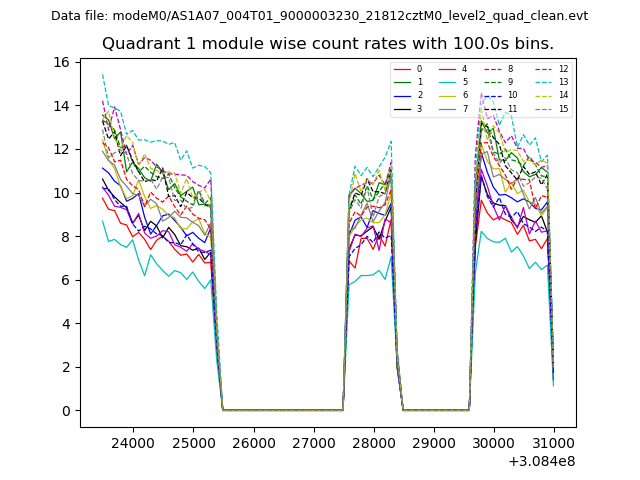
| Module-wise count rates for Quadrant A Data is divided into 100 sec bins |
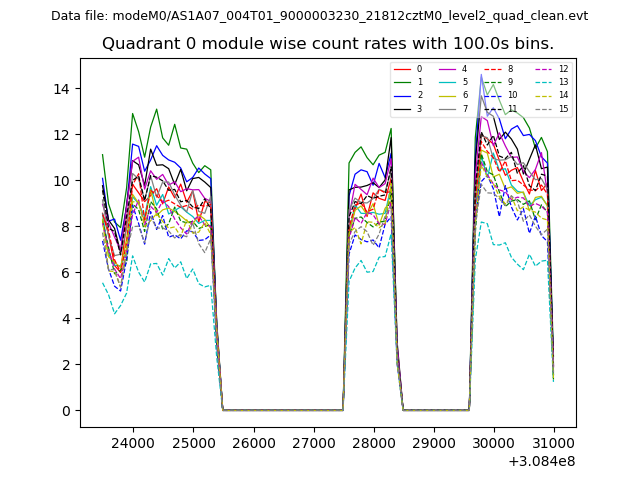 |
 |
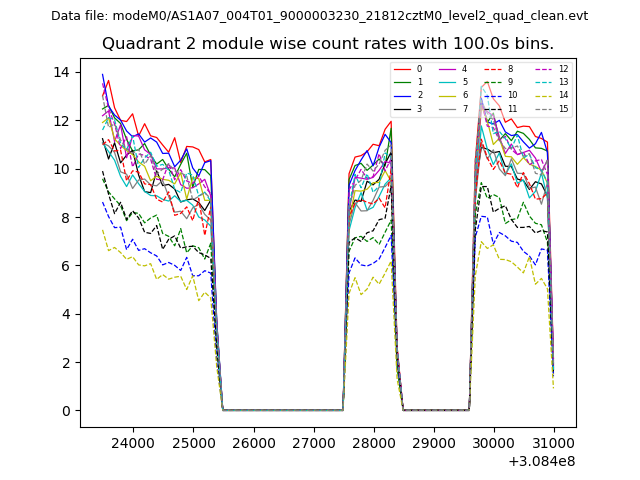
| Module-wise count rates for Quadrant B Data is divided into 100 sec bins |
 |
 |
| Module-wise count rates for Quadrant C Data is divided into 100 sec bins |
 |
 |
| Module-wise count rates for Quadrant D Data is divided into 100 sec bins |
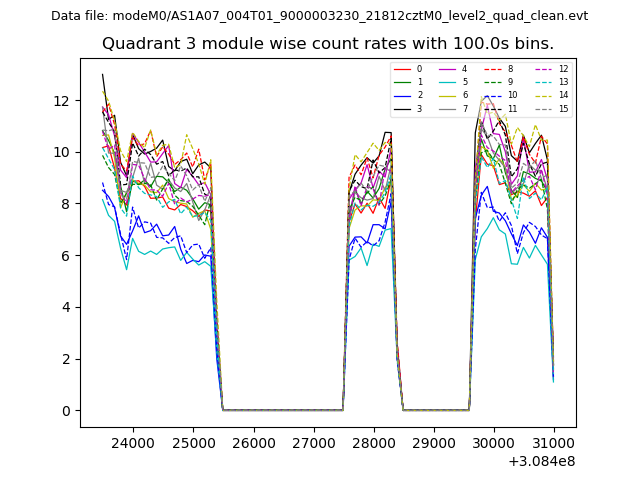 |
 |
| Parameter | Plot |
|---|---|
| CZT HV Monitor | 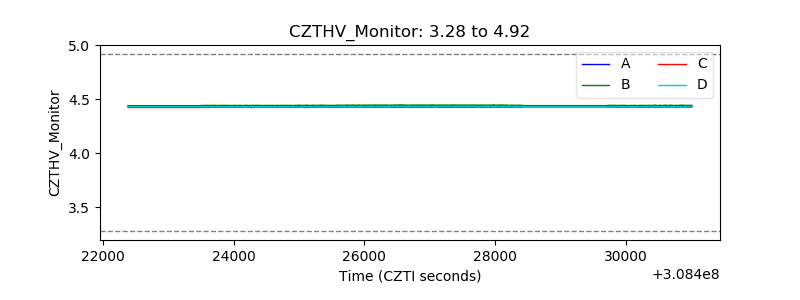 |
| D_VDD | 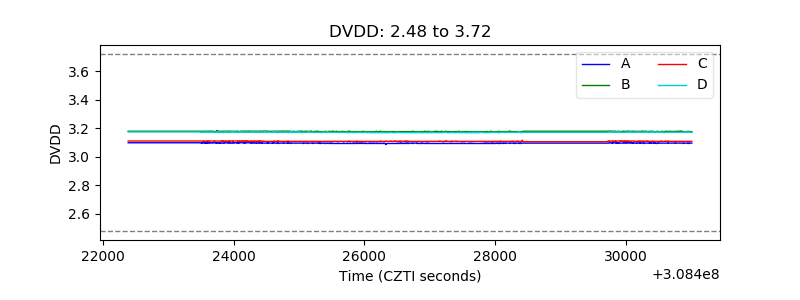 |
| Temperature 1 | 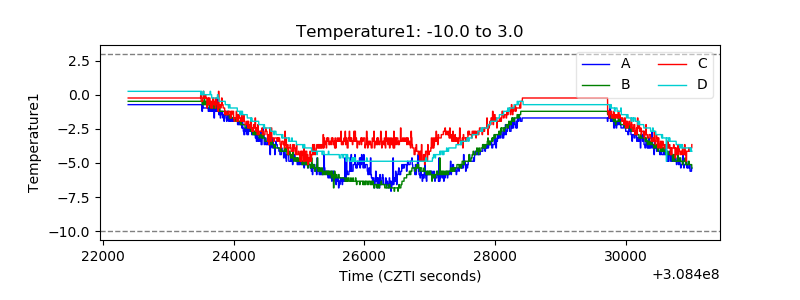 |
| Veto HV Monitor | 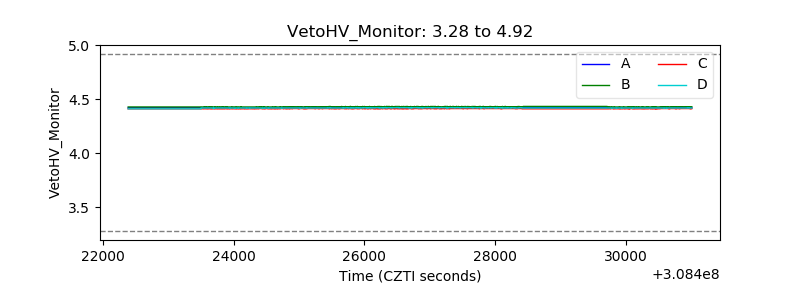 |
| Veto LLD | 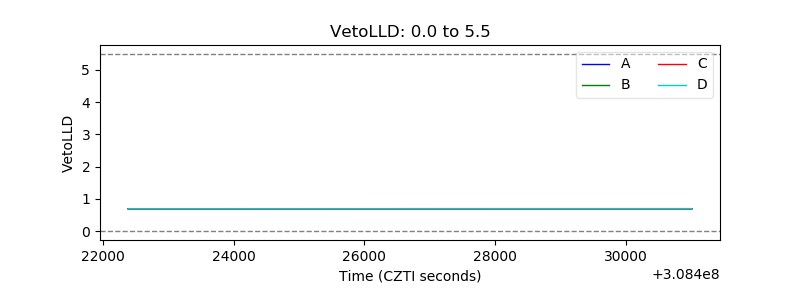 |
| Alpha Counter | 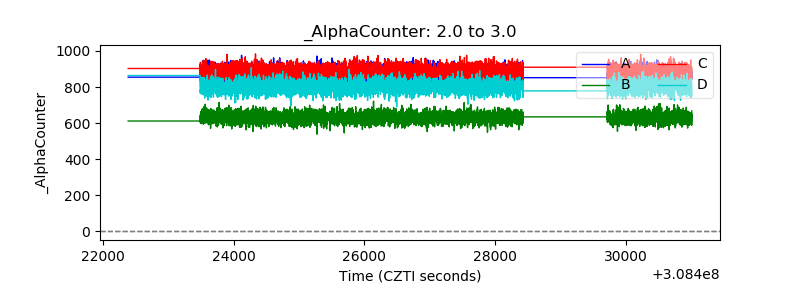 |
| _CPM_Rate | 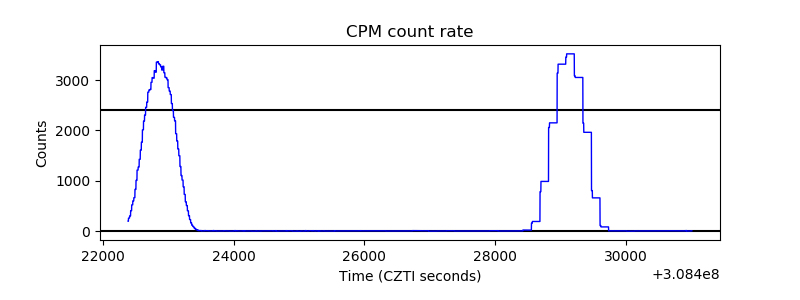 |
| CZT Counter | 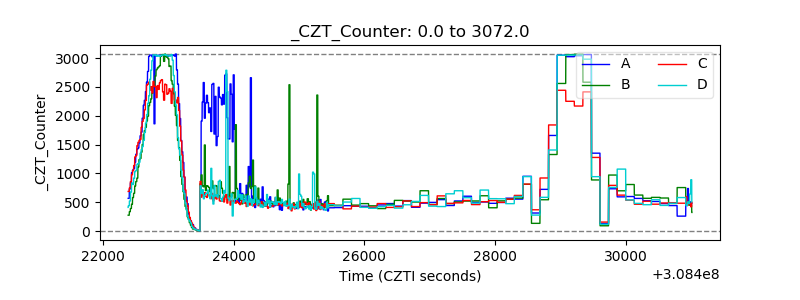 |
| +2.5 Volts monitor |  |
| +5 Volts monitor |  |
| _ROLL_ROT | 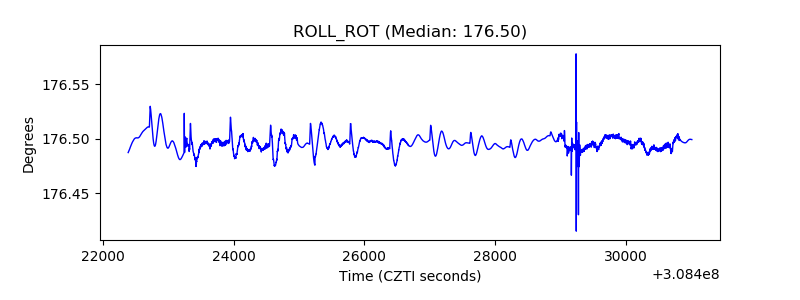 |
| _Roll_DEC | 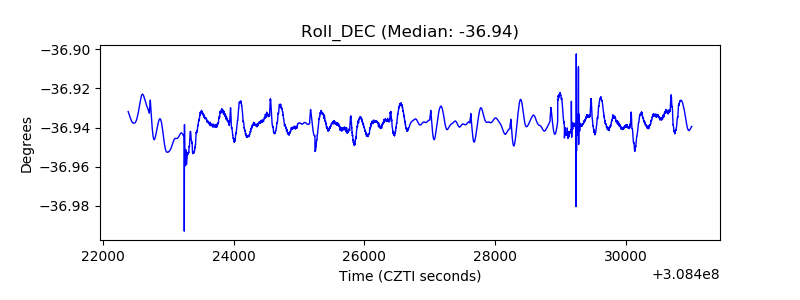 |
| _Roll_RA | 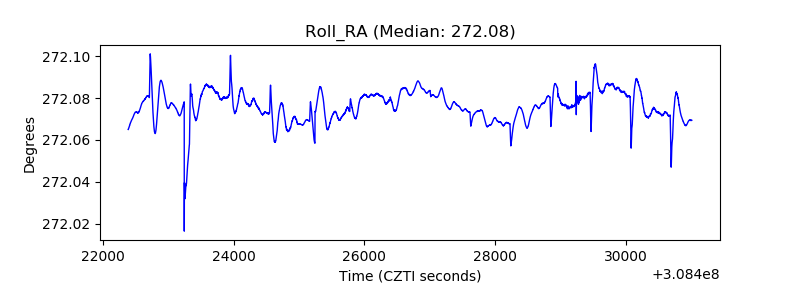 |
| Veto Counter | 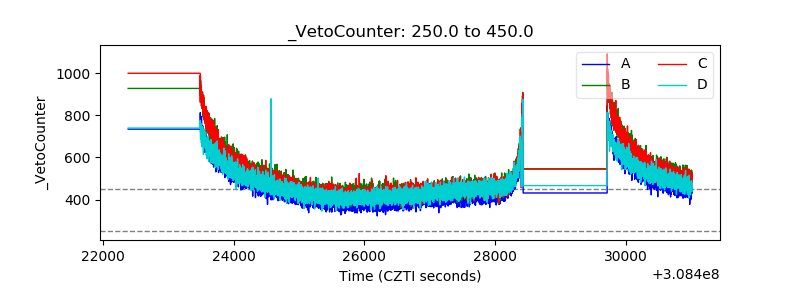 |