| Param | Original file | Final file |
|---|---|---|
| Filename | modeM0/AS1A07_004T01_9000003230_21813cztM0_level2.evt | modeM0/AS1A07_004T01_9000003230_21813cztM0_level2_quad_clean.evt |
| Size (bytes) | 446,483,520 | 93,401,280 |
| Size | 425.8 MB | 89.1 MB |
| Events in quadrant A | 3,140,648 | 609,345 |
| Events in quadrant B | 3,434,641 | 625,236 |
| Events in quadrant C | 3,170,928 | 596,689 |
| Events in quadrant D | 3,353,698 | 563,703 |
| Mode SS | |||
|---|---|---|---|
| Quadrant | BADHDUFLAG | Total packets | Discarded packets |
| A | 0 | 126 | 0 |
| B | 0 | 126 | 0 |
| C | 0 | 126 | 0 |
| D | 0 | 126 | 0 |
| Mode M0 | |||
|---|---|---|---|
| Quadrant | BADHDUFLAG | Total packets | Discarded packets |
| A | 0 | 13124 | 2 |
| B | 0 | 13934 | 2 |
| C | 0 | 13085 | 2 |
| D | 0 | 13939 | 2 |
| Mode M9 | |||
|---|---|---|---|
| Quadrant | BADHDUFLAG | Total packets | Discarded packets |
| A | 0 | 20 | 0 |
| B | 0 | 21 | 0 |
| C | 0 | 21 | 0 |
| D | 0 | 21 | 0 |
| Quadrant | Total seconds | Saturated seconds | Saturation percentage |
|---|---|---|---|
| A | 6212 | 29 | 0.466838% |
| B | 6211 | 112 | 1.803252% |
| C | 6211 | 61 | 0.982128% |
| D | 6211 | 60 | 0.966028% |
Noise dominated data is calculated using 1-second bins in cleaned event files. If a bin has >2000 counts, and if more than 50% of those come from <1% of pixels, then it is considered to be noise-dominated and hence unusable.
| Quadrant | # 1 sec bins | Bins with >0 counts | Bins with >2000 counts | High rate bins dominated by noise | Noise dominated (total time) | Noise dominated (detector-on time) | Marked lightcurve |
|---|---|---|---|---|---|---|---|
| A | 7537 | 6213 | 0 | 0 | 0.00% | 0.00% | 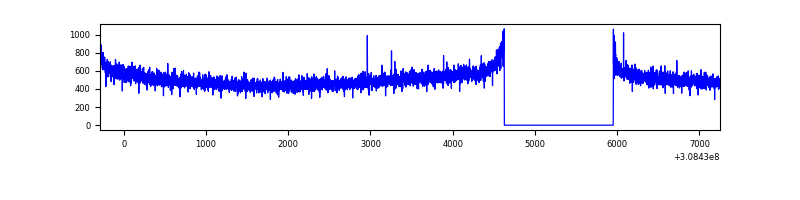 |
| B | 7536 | 6212 | 31 | 31 | 0.41% | 0.50% | 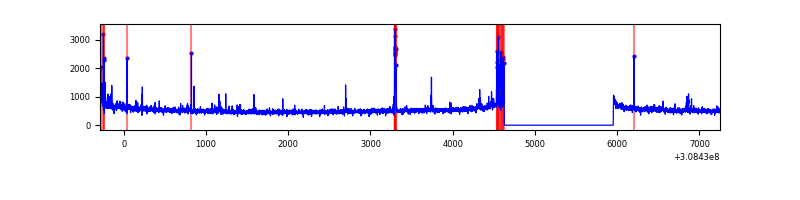 |
| C | 7536 | 6212 | 0 | 0 | 0.00% | 0.00% | 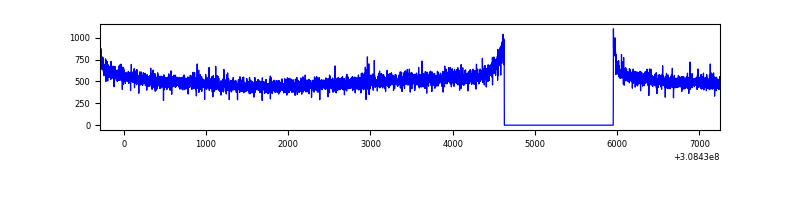 |
| D | 7536 | 6212 | 34 | 34 | 0.45% | 0.55% | 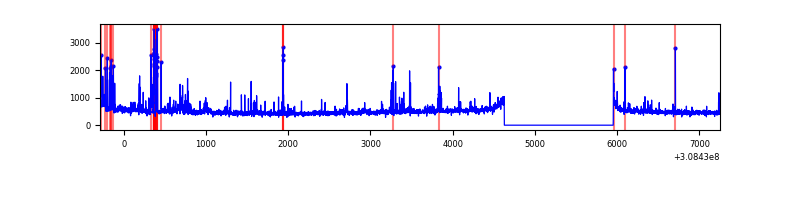 |
Top three noisy pixels from each quadrant. If the there are fewer than three noisy pixels in the level2.evt file, extra rows are filled as -1
| Pixel properties | Quadrant properties | ||||||
|---|---|---|---|---|---|---|---|
| Quadrant | DetID | PixID | Counts | Sigma | Mean | Median | Sigma |
| A | 13 | 254 | 12025 | 69.0 | 812 | 797 | 162.7 |
| A | 13 | 252 | 9365 | 52.66 | 812 | 797 | 162.7 |
| A | 0 | 226 | 7155 | 39.07 | 812 | 797 | 162.7 |
| B | 3 | 64 | 120789 | 788.88 | 818 | 802 | 152.1 |
| B | 0 | 230 | 30249 | 193.61 | 818 | 802 | 152.1 |
| B | 0 | 190 | 23266 | 147.69 | 818 | 802 | 152.1 |
| C | 14 | 238 | 124108 | 683.31 | 780 | 787 | 180.5 |
| C | 13 | 61 | 5570 | 26.5 | 780 | 787 | 180.5 |
| C | 0 | 10 | 5543 | 26.35 | 780 | 787 | 180.5 |
| D | 1 | 52 | 129117 | 678.74 | 776 | 753 | 189.1 |
| D | 13 | 104 | 85144 | 446.23 | 776 | 753 | 189.1 |
| D | 13 | 153 | 82087 | 430.06 | 776 | 753 | 189.1 |
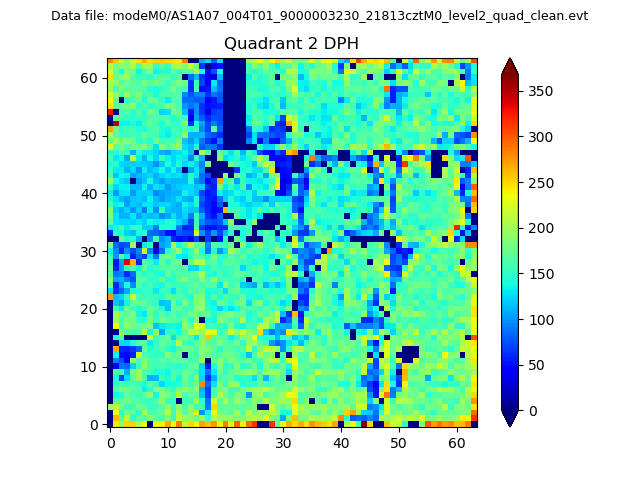
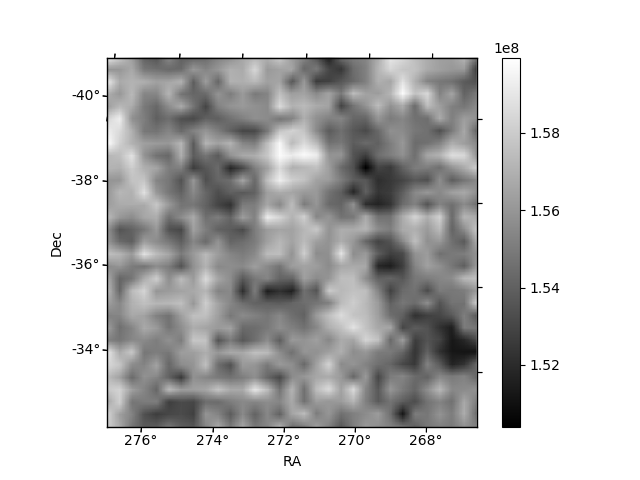
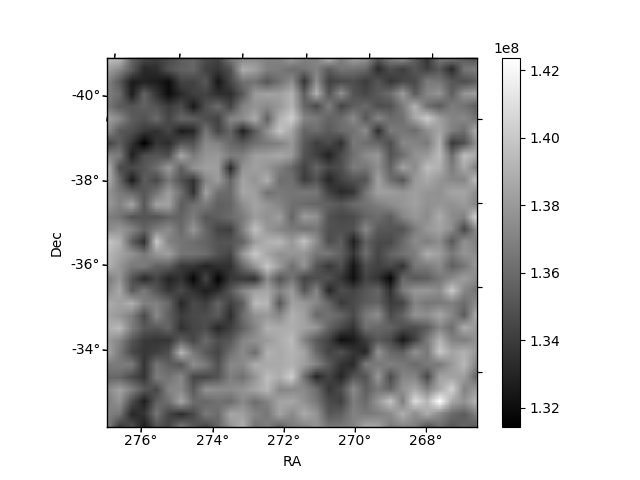
Histogram calculated using DETX and DETY for each event in the final _common_clean file
| Quadrant A | 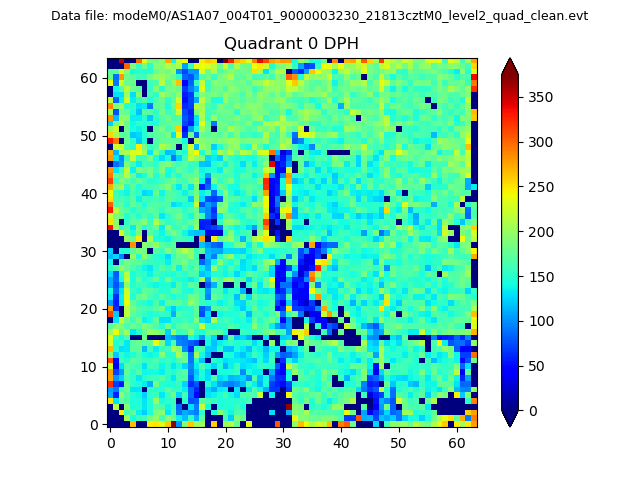 |
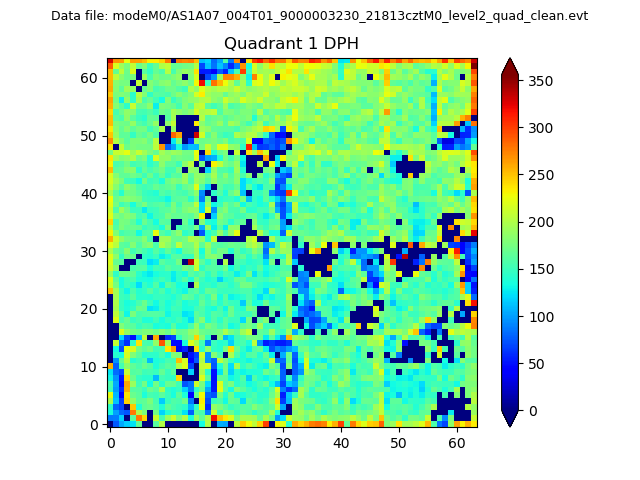 |
Quadrant B |
|---|---|---|---|
| Quadrant D | 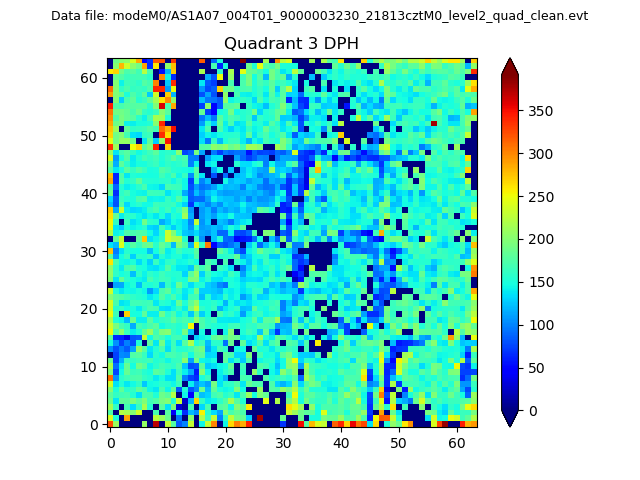 |
 |
Quadrant C |
| Plot type | Count rate plots | Images |
|---|---|---|
| Comparison with Poisson distribution Blue bars denote a histogram of data divided into 1 sec bins. Red curve is a Poisson curve with rate = median count rate of data. |
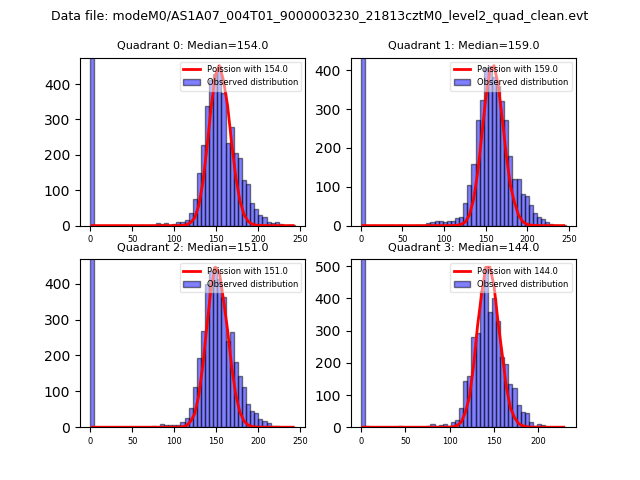 |
 |
| Quadrant-wise count rates Data is divided into 100 sec bins |
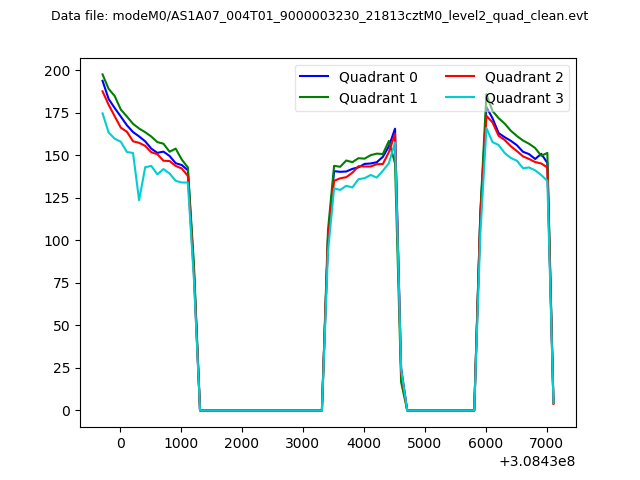 |
|
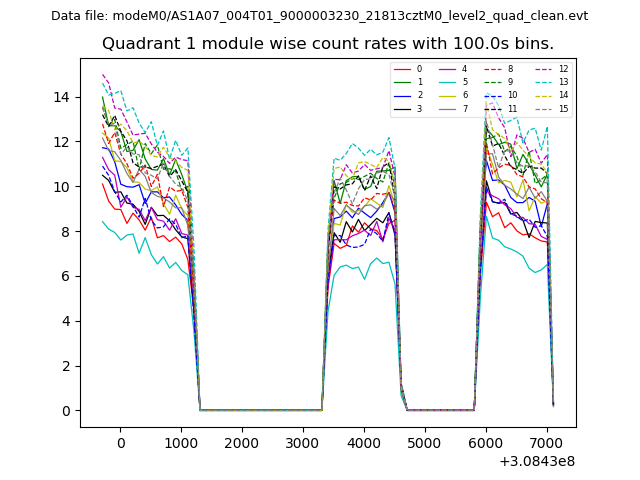
| Module-wise count rates for Quadrant A Data is divided into 100 sec bins |
 |
 |
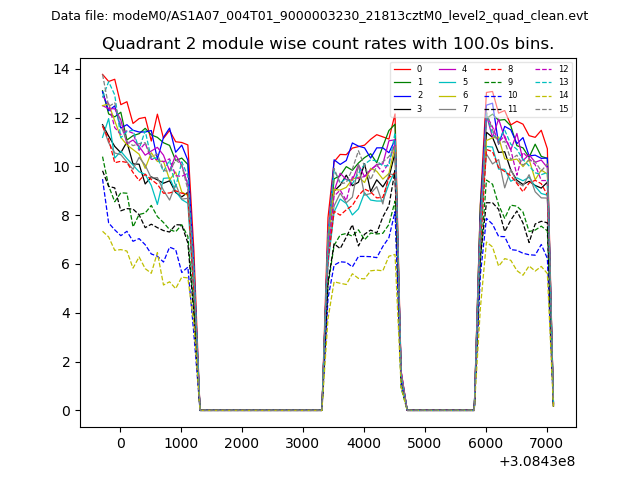
| Module-wise count rates for Quadrant B Data is divided into 100 sec bins |
 |
 |
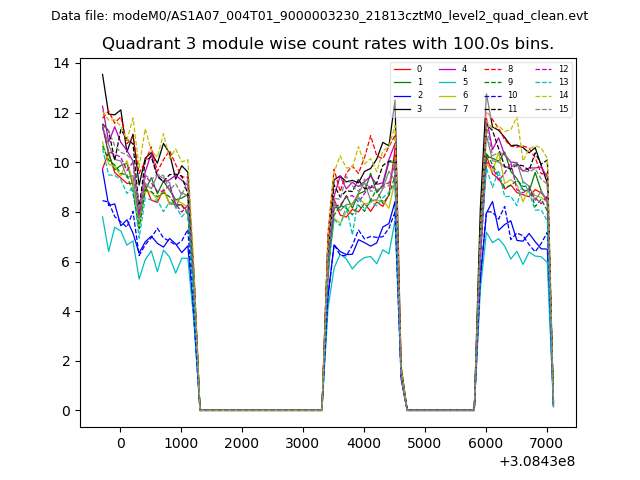
| Module-wise count rates for Quadrant C Data is divided into 100 sec bins |
 |
 |
| Module-wise count rates for Quadrant D Data is divided into 100 sec bins |
 |
 |
| Parameter | Plot |
|---|---|
| CZT HV Monitor |  |
| D_VDD | 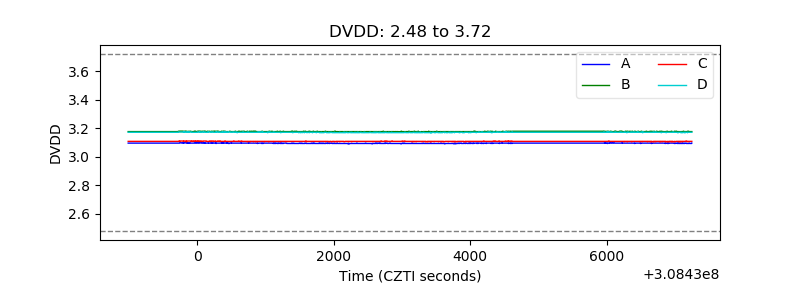 |
| Temperature 1 | 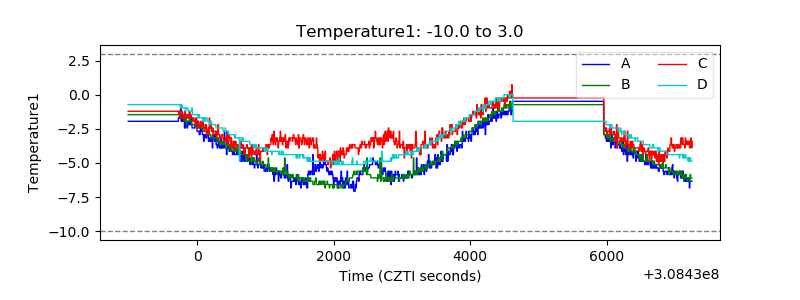 |
| Veto HV Monitor | 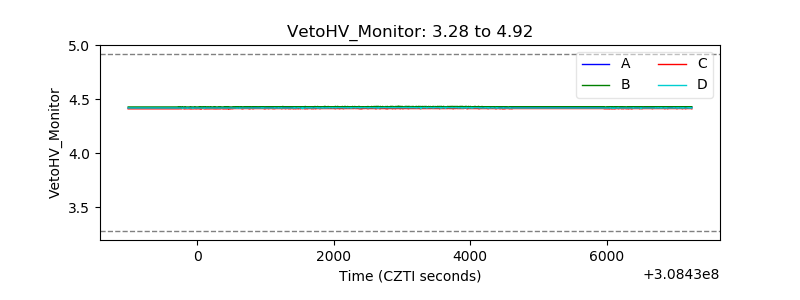 |
| Veto LLD |  |
| Alpha Counter | 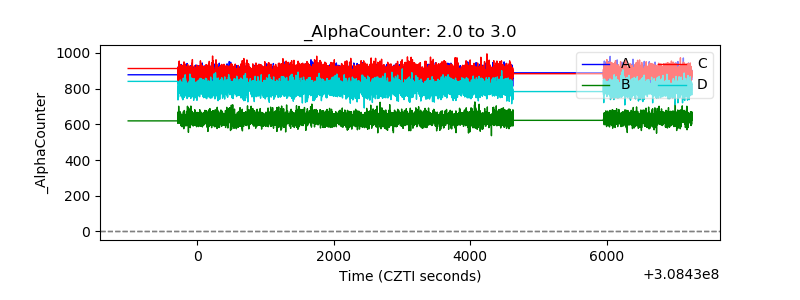 |
| _CPM_Rate | 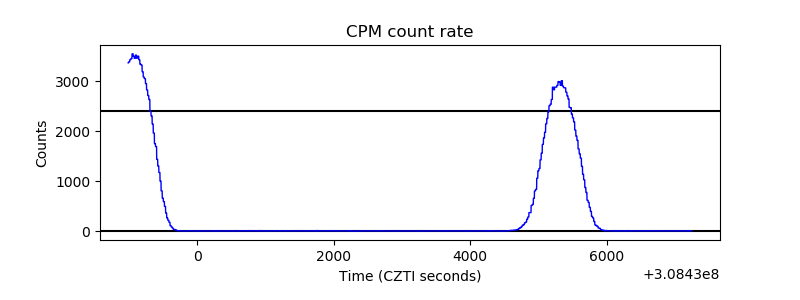 |
| CZT Counter | 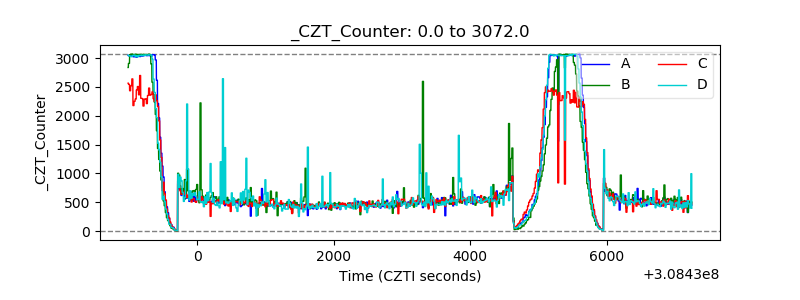 |
| +2.5 Volts monitor |  |
| +5 Volts monitor |  |
| _ROLL_ROT | 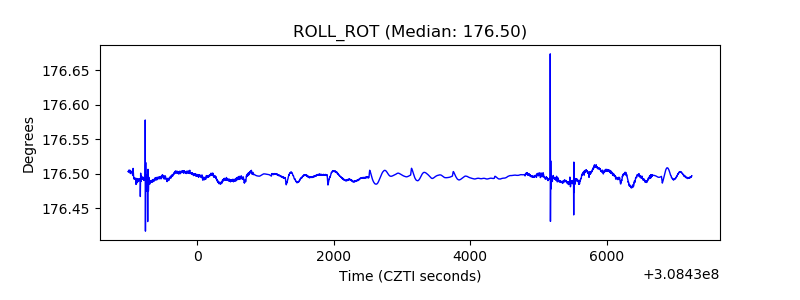 |
| _Roll_DEC | 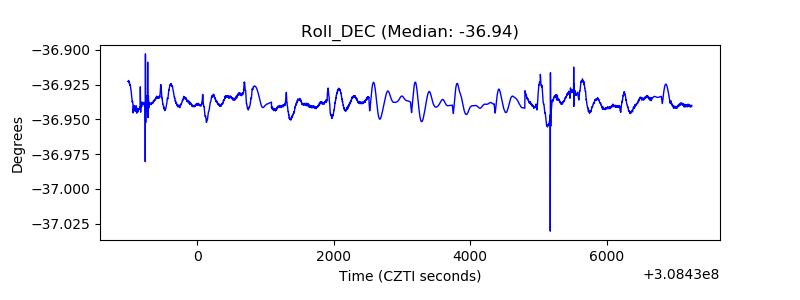 |
| _Roll_RA | 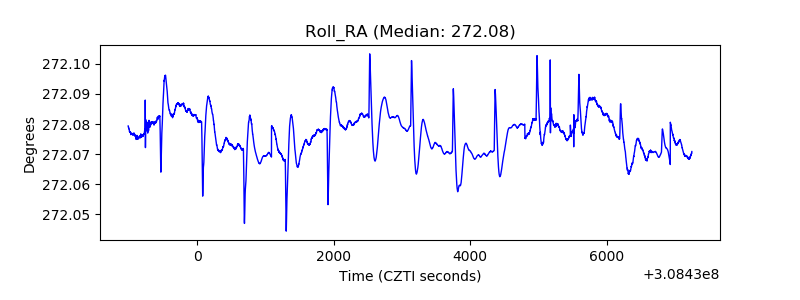 |
| Veto Counter | 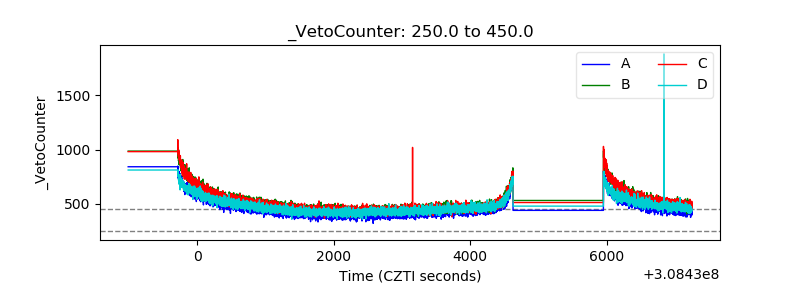 |