| Param | Original file | Final file |
|---|---|---|
| Filename | modeM0/AS1A07_004T01_9000003230_21814cztM0_level2.evt | modeM0/AS1A07_004T01_9000003230_21814cztM0_level2_quad_clean.evt |
| Size (bytes) | 431,049,600 | 83,782,080 |
| Size | 411.1 MB | 79.9 MB |
| Events in quadrant A | 3,070,147 | 530,943 |
| Events in quadrant B | 3,284,605 | 547,816 |
| Events in quadrant C | 3,105,994 | 526,105 |
| Events in quadrant D | 3,175,216 | 502,488 |
| Mode SS | |||
|---|---|---|---|
| Quadrant | BADHDUFLAG | Total packets | Discarded packets |
| A | 0 | 126 | 0 |
| B | 0 | 126 | 0 |
| C | 0 | 126 | 0 |
| D | 0 | 126 | 0 |
| Mode M0 | |||
|---|---|---|---|
| Quadrant | BADHDUFLAG | Total packets | Discarded packets |
| A | 0 | 12827 | 2 |
| B | 0 | 13409 | 2 |
| C | 0 | 12831 | 2 |
| D | 0 | 13440 | 2 |
| Mode M9 | |||
|---|---|---|---|
| Quadrant | BADHDUFLAG | Total packets | Discarded packets |
| A | 0 | 15 | 0 |
| B | 0 | 16 | 0 |
| C | 0 | 16 | 0 |
| D | 0 | 16 | 0 |
| Quadrant | Total seconds | Saturated seconds | Saturation percentage |
|---|---|---|---|
| A | 6154 | 20 | 0.324992% |
| B | 6153 | 42 | 0.682594% |
| C | 6153 | 49 | 0.796359% |
| D | 6153 | 28 | 0.455063% |
Noise dominated data is calculated using 1-second bins in cleaned event files. If a bin has >2000 counts, and if more than 50% of those come from <1% of pixels, then it is considered to be noise-dominated and hence unusable.
| Quadrant | # 1 sec bins | Bins with >0 counts | Bins with >2000 counts | High rate bins dominated by noise | Noise dominated (total time) | Noise dominated (detector-on time) | Marked lightcurve |
|---|---|---|---|---|---|---|---|
| A | 7464 | 6155 | 0 | 0 | 0.00% | 0.00% | 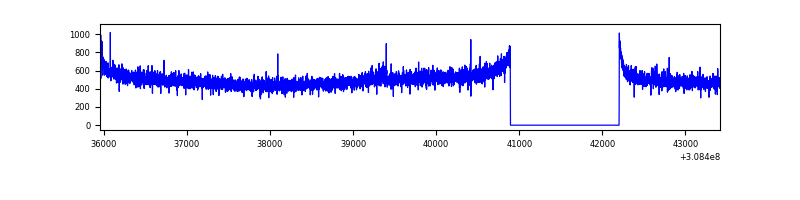 |
| B | 7463 | 6154 | 10 | 10 | 0.13% | 0.16% | 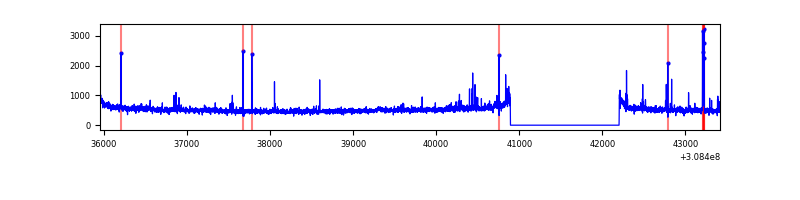 |
| C | 7463 | 6154 | 0 | 0 | 0.00% | 0.00% | 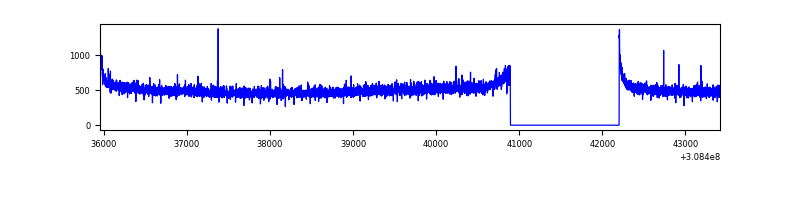 |
| D | 7463 | 6154 | 20 | 20 | 0.27% | 0.32% | 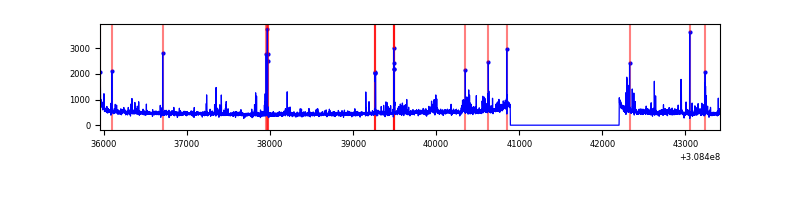 |
Top three noisy pixels from each quadrant. If the there are fewer than three noisy pixels in the level2.evt file, extra rows are filled as -1
| Pixel properties | Quadrant properties | ||||||
|---|---|---|---|---|---|---|---|
| Quadrant | DetID | PixID | Counts | Sigma | Mean | Median | Sigma |
| A | 13 | 252 | 16146 | 96.49 | 792 | 778 | 159.3 |
| A | 13 | 254 | 11737 | 68.81 | 792 | 778 | 159.3 |
| A | 0 | 226 | 7055 | 39.41 | 792 | 778 | 159.3 |
| B | 3 | 64 | 67671 | 445.84 | 799 | 780 | 150.0 |
| B | 0 | 190 | 26907 | 174.14 | 799 | 780 | 150.0 |
| B | 12 | 111 | 17147 | 109.09 | 799 | 780 | 150.0 |
| C | 14 | 238 | 122733 | 692.03 | 763 | 769 | 176.2 |
| C | 0 | 10 | 6437 | 32.16 | 763 | 769 | 176.2 |
| C | 13 | 61 | 5362 | 26.06 | 763 | 769 | 176.2 |
| D | 1 | 52 | 118373 | 636.75 | 762 | 741 | 184.7 |
| D | 13 | 153 | 82436 | 442.22 | 762 | 741 | 184.7 |
| D | 13 | 104 | 32495 | 171.89 | 762 | 741 | 184.7 |
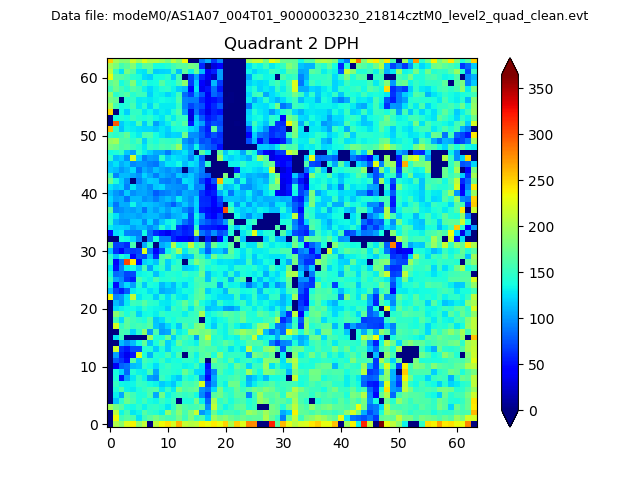
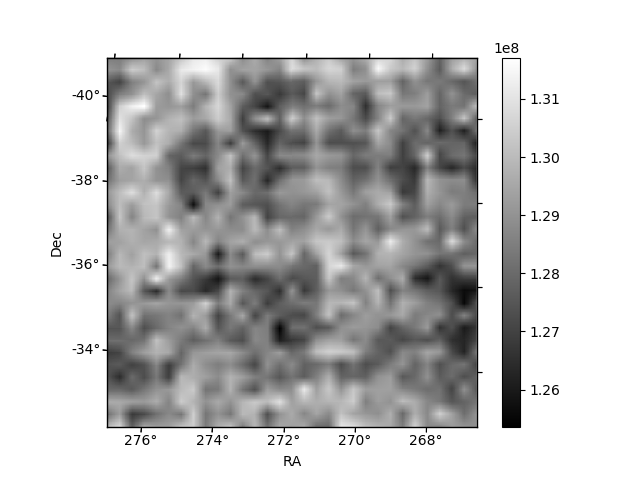
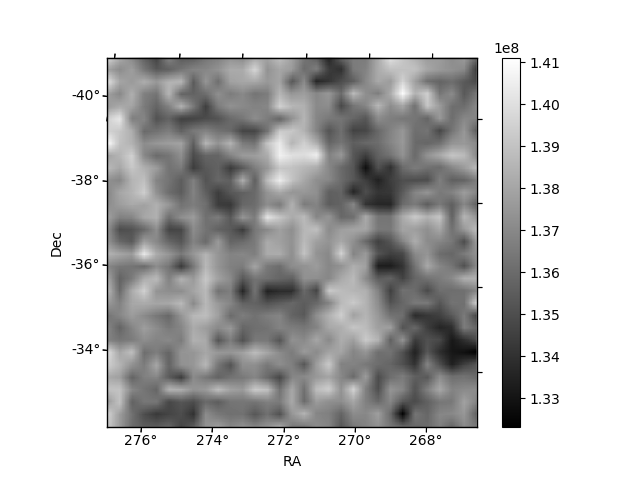
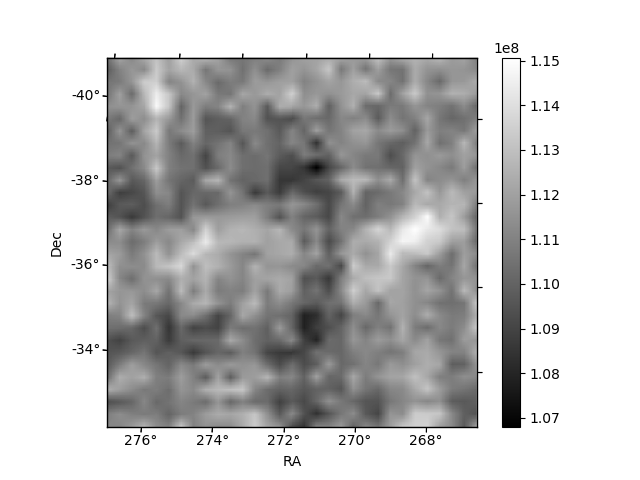
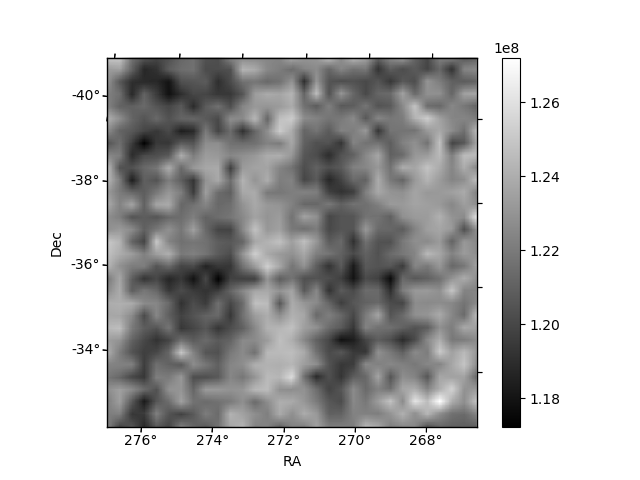
Histogram calculated using DETX and DETY for each event in the final _common_clean file
| Quadrant A |  |
 |
Quadrant B |
|---|---|---|---|
| Quadrant D | 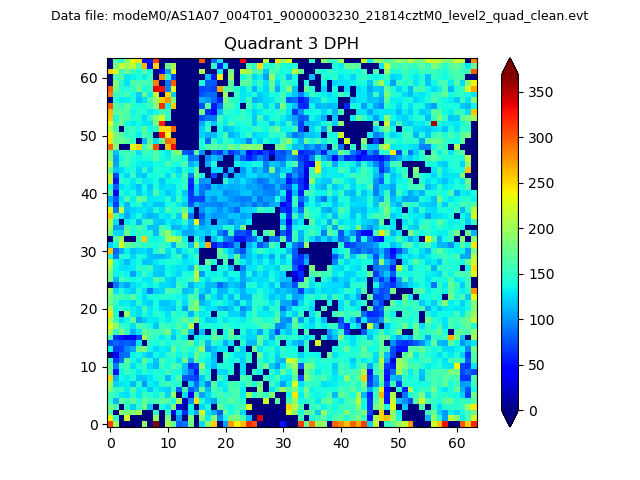 |
 |
Quadrant C |
| Plot type | Count rate plots | Images |
|---|---|---|
| Comparison with Poisson distribution Blue bars denote a histogram of data divided into 1 sec bins. Red curve is a Poisson curve with rate = median count rate of data. |
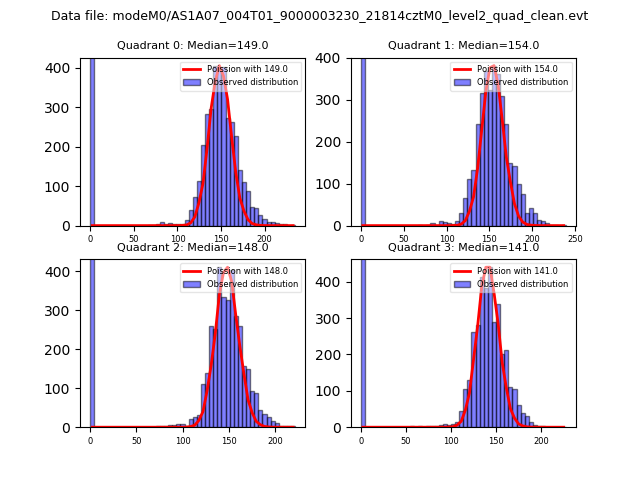 |
 |
| Quadrant-wise count rates Data is divided into 100 sec bins |
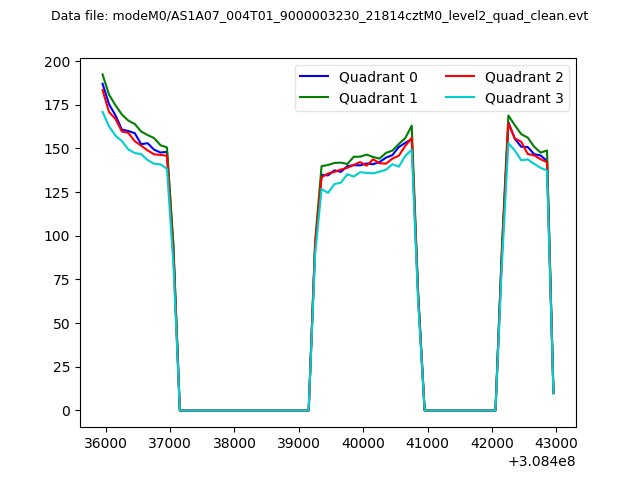 |
|
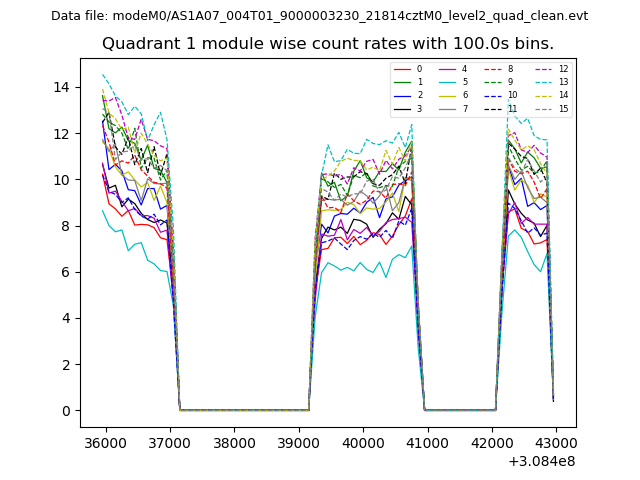
| Module-wise count rates for Quadrant A Data is divided into 100 sec bins |
 |
 |
| Module-wise count rates for Quadrant B Data is divided into 100 sec bins |
 |
 |
| Module-wise count rates for Quadrant C Data is divided into 100 sec bins |
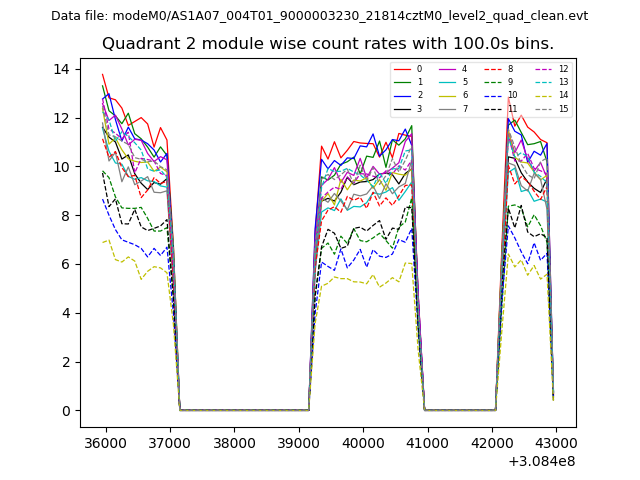 |
 |
| Module-wise count rates for Quadrant D Data is divided into 100 sec bins |
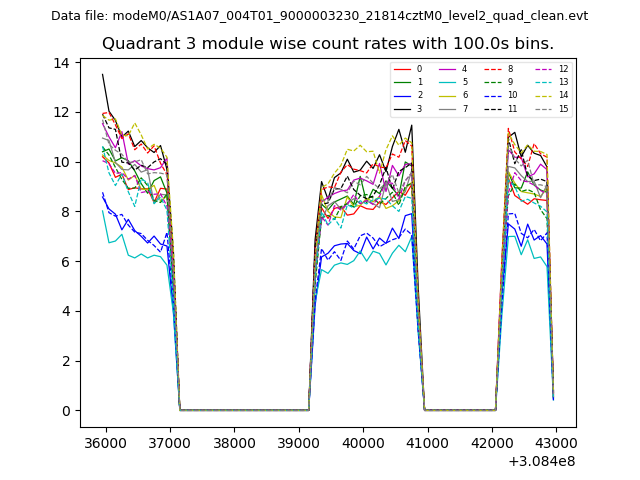 |
 |
| Parameter | Plot |
|---|---|
| CZT HV Monitor |  |
| D_VDD | 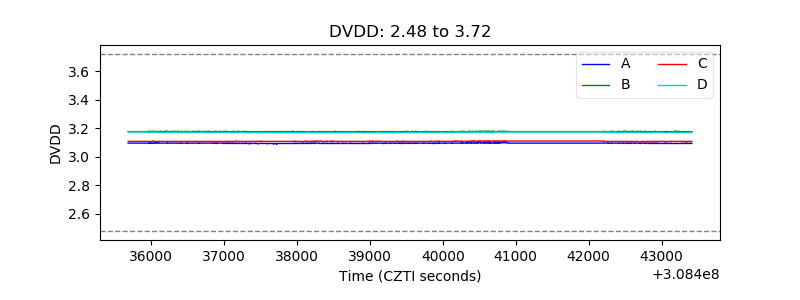 |
| Temperature 1 | 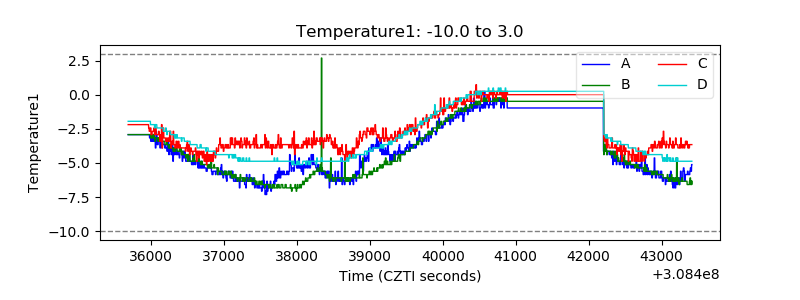 |
| Veto HV Monitor | 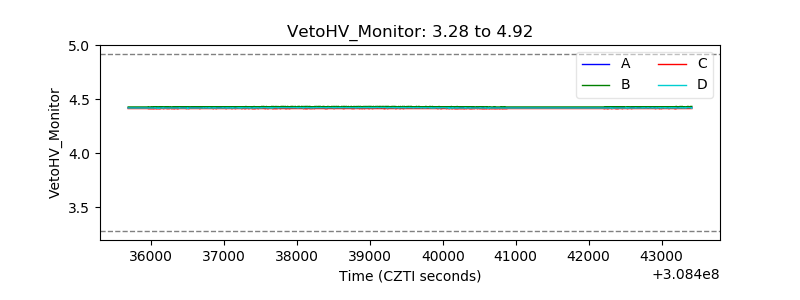 |
| Veto LLD | 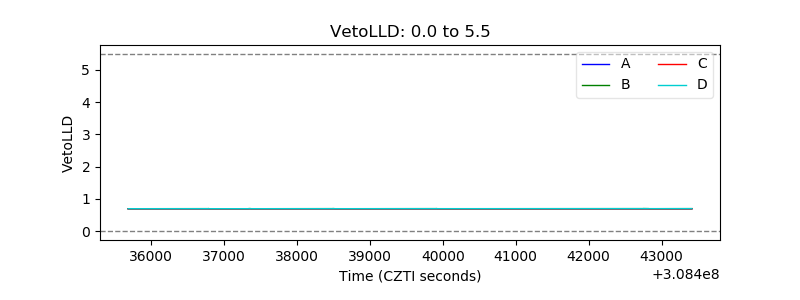 |
| Alpha Counter |  |
| _CPM_Rate | 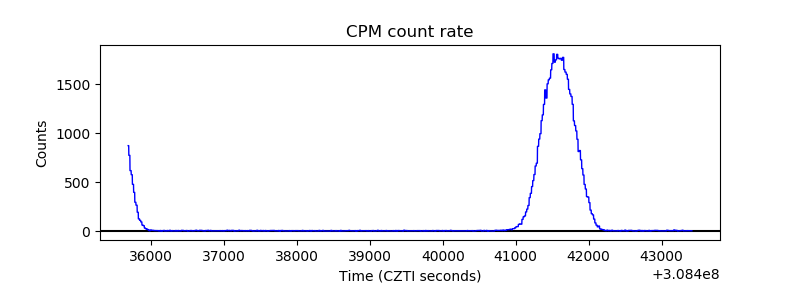 |
| CZT Counter | 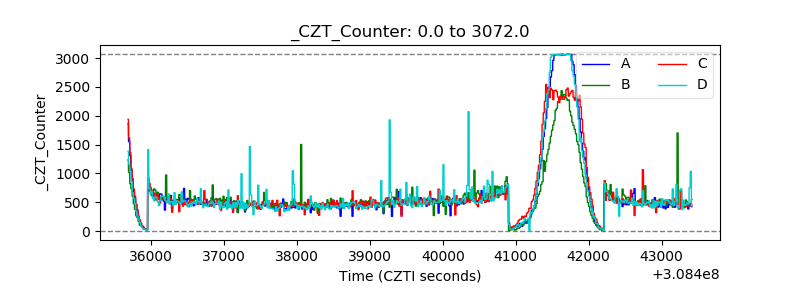 |
| +2.5 Volts monitor |  |
| +5 Volts monitor | 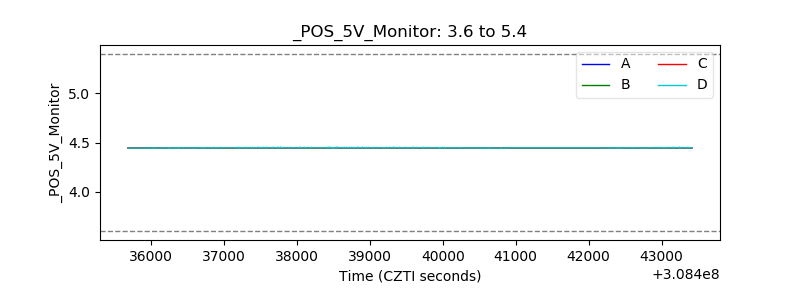 |
| _ROLL_ROT | 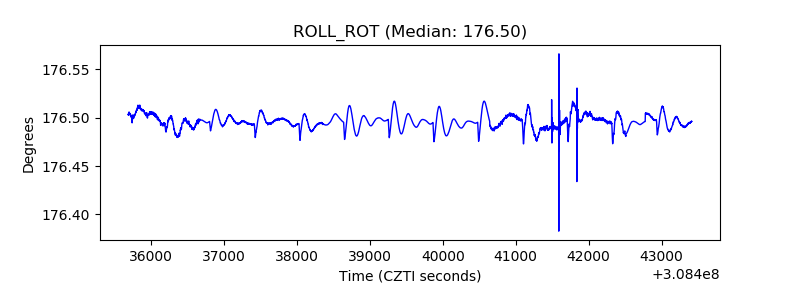 |
| _Roll_DEC | 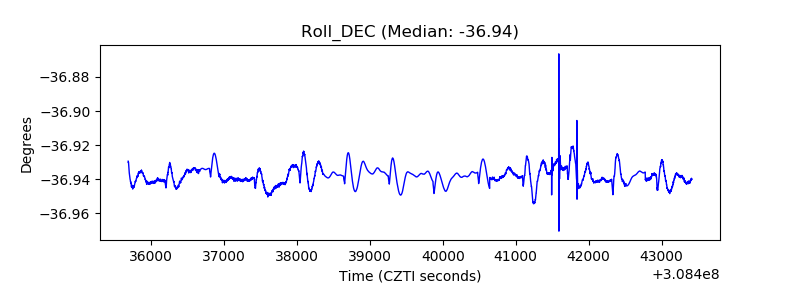 |
| _Roll_RA | 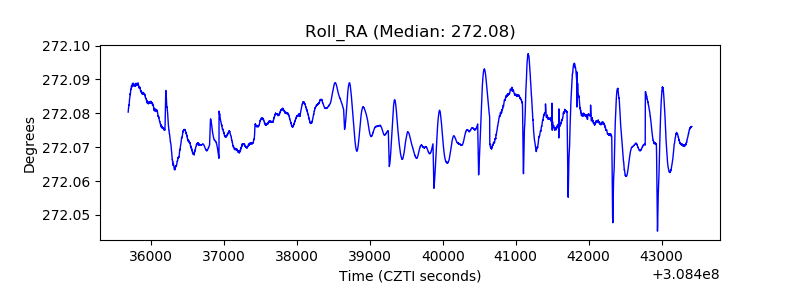 |
| Veto Counter | 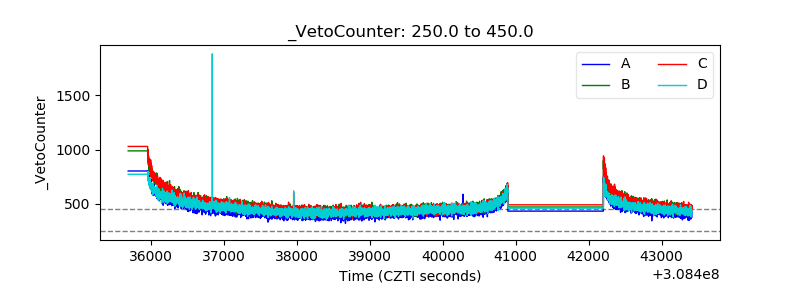 |