| Param | Original file | Final file |
|---|---|---|
| Filename | modeM0/AS1A07_004T01_9000003230_21816cztM0_level2.evt | modeM0/AS1A07_004T01_9000003230_21816cztM0_level2_quad_clean.evt |
| Size (bytes) | 507,024,000 | 72,855,360 |
| Size | 483.5 MB | 69.5 MB |
| Events in quadrant A | 3,534,410 | 431,352 |
| Events in quadrant B | 3,564,895 | 442,666 |
| Events in quadrant C | 3,364,753 | 429,792 |
| Events in quadrant D | 4,412,015 | 410,290 |
| Mode SS | |||
|---|---|---|---|
| Quadrant | BADHDUFLAG | Total packets | Discarded packets |
| A | 0 | 146 | 0 |
| B | 0 | 146 | 0 |
| C | 0 | 146 | 0 |
| D | 0 | 146 | 0 |
| Mode M0 | |||
|---|---|---|---|
| Quadrant | BADHDUFLAG | Total packets | Discarded packets |
| A | 0 | 14936 | 2 |
| B | 0 | 14915 | 2 |
| C | 0 | 14416 | 2 |
| D | 0 | 17903 | 2 |
| Mode M9 | |||
|---|---|---|---|
| Quadrant | BADHDUFLAG | Total packets | Discarded packets |
| A | 0 | 12 | 0 |
| B | 0 | 13 | 0 |
| C | 0 | 13 | 0 |
| D | 0 | 13 | 0 |
| Quadrant | Total seconds | Saturated seconds | Saturation percentage |
|---|---|---|---|
| A | 7052 | 64 | 0.907544% |
| B | 7051 | 71 | 1.006949% |
| C | 7051 | 70 | 0.992767% |
| D | 7051 | 48 | 0.680755% |
Noise dominated data is calculated using 1-second bins in cleaned event files. If a bin has >2000 counts, and if more than 50% of those come from <1% of pixels, then it is considered to be noise-dominated and hence unusable.
| Quadrant | # 1 sec bins | Bins with >0 counts | Bins with >2000 counts | High rate bins dominated by noise | Noise dominated (total time) | Noise dominated (detector-on time) | Marked lightcurve |
|---|---|---|---|---|---|---|---|
| A | 7812 | 7053 | 18 | 18 | 0.23% | 0.26% | 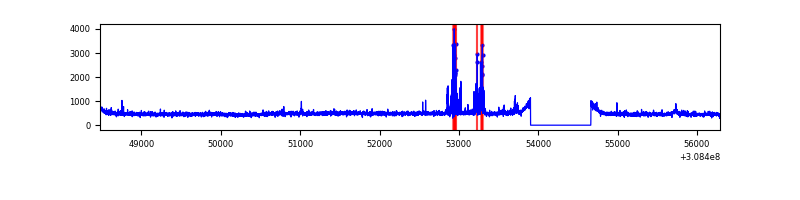 |
| B | 7811 | 7052 | 9 | 9 | 0.12% | 0.13% | 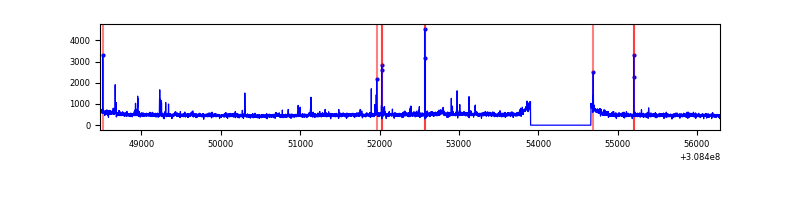 |
| C | 7811 | 7052 | 0 | 0 | 0.00% | 0.00% | 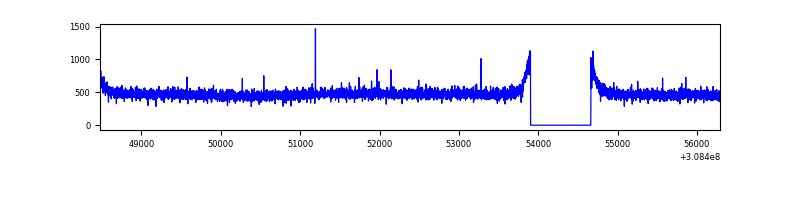 |
| D | 7811 | 7052 | 19 | 19 | 0.24% | 0.27% | 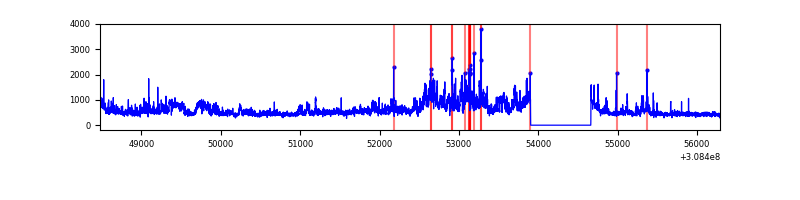 |
Top three noisy pixels from each quadrant. If the there are fewer than three noisy pixels in the level2.evt file, extra rows are filled as -1
| Pixel properties | Quadrant properties | ||||||
|---|---|---|---|---|---|---|---|
| Quadrant | DetID | PixID | Counts | Sigma | Mean | Median | Sigma |
| A | 4 | 2 | 164642 | 946.45 | 857 | 838 | 173.1 |
| A | 13 | 252 | 65892 | 375.88 | 857 | 838 | 173.1 |
| A | 13 | 254 | 12856 | 69.44 | 857 | 838 | 173.1 |
| B | 3 | 64 | 63282 | 377.34 | 865 | 842 | 165.5 |
| B | 0 | 189 | 23250 | 135.42 | 865 | 842 | 165.5 |
| B | 0 | 230 | 21712 | 126.12 | 865 | 842 | 165.5 |
| C | 14 | 238 | 128097 | 654.06 | 830 | 834 | 194.6 |
| C | 13 | 61 | 5665 | 24.83 | 830 | 834 | 194.6 |
| C | 10 | 23 | 2297 | 7.52 | 830 | 834 | 194.6 |
| D | 1 | 52 | 1113877 | 5468.72 | 832 | 806 | 203.5 |
| D | 13 | 153 | 48725 | 235.43 | 832 | 806 | 203.5 |
| D | 7 | 38 | 38788 | 186.61 | 832 | 806 | 203.5 |
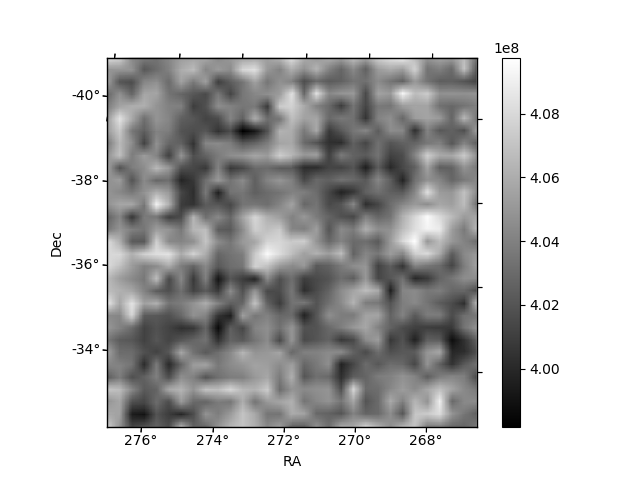
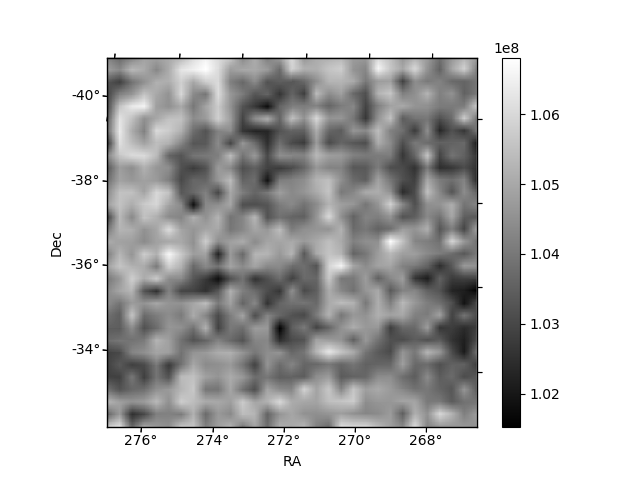
Histogram calculated using DETX and DETY for each event in the final _common_clean file
| Quadrant A | 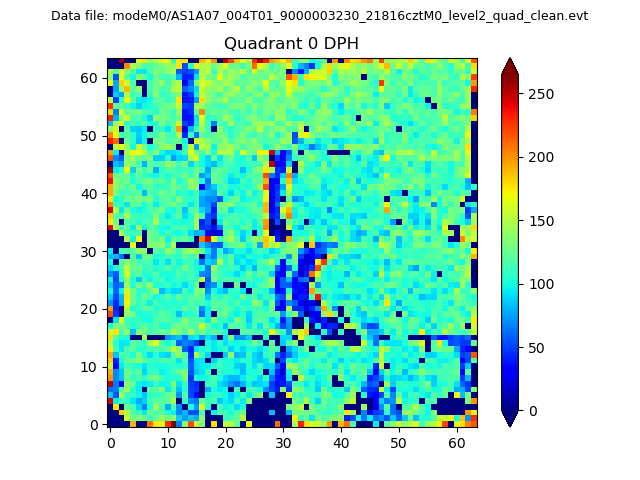 |
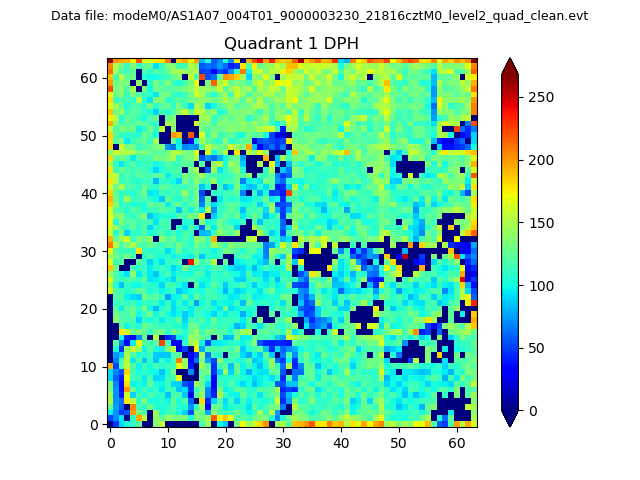 |
Quadrant B |
|---|---|---|---|
| Quadrant D | 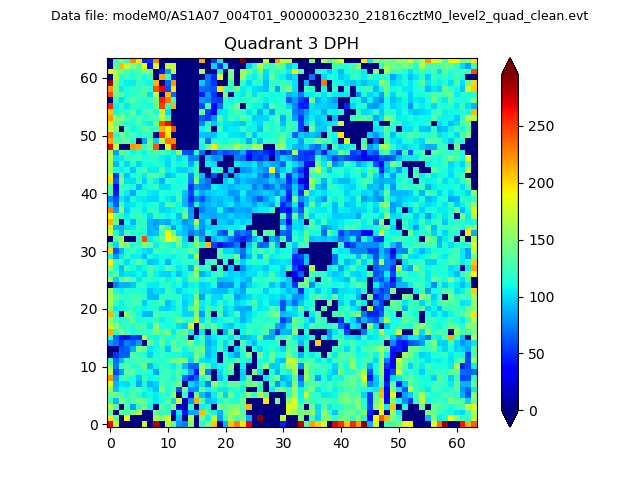 |
 |
Quadrant C |
| Plot type | Count rate plots | Images |
|---|---|---|
| Comparison with Poisson distribution Blue bars denote a histogram of data divided into 1 sec bins. Red curve is a Poisson curve with rate = median count rate of data. |
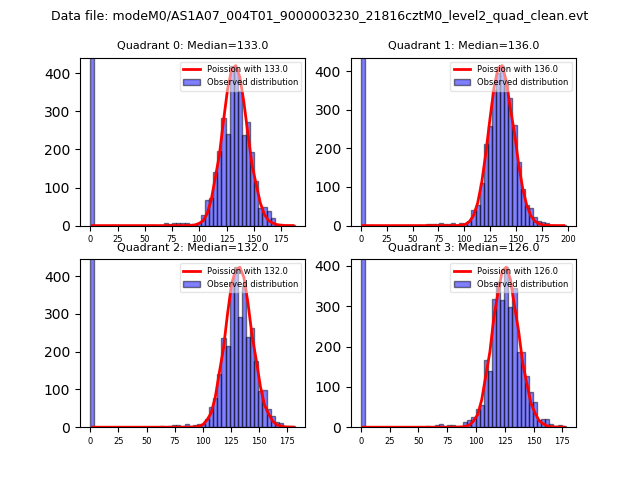 |
 |
| Quadrant-wise count rates Data is divided into 100 sec bins |
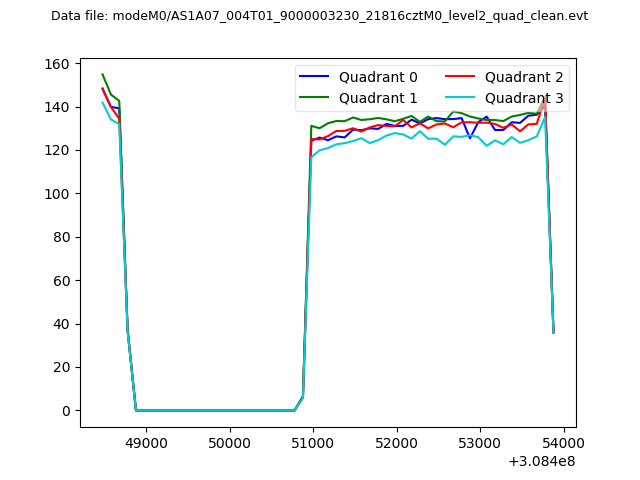 |
|
| Module-wise count rates for Quadrant A Data is divided into 100 sec bins |
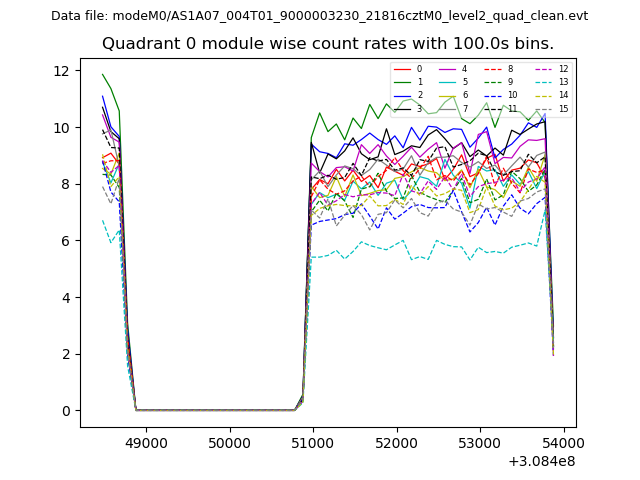 |
 |
| Module-wise count rates for Quadrant B Data is divided into 100 sec bins |
 |
 |
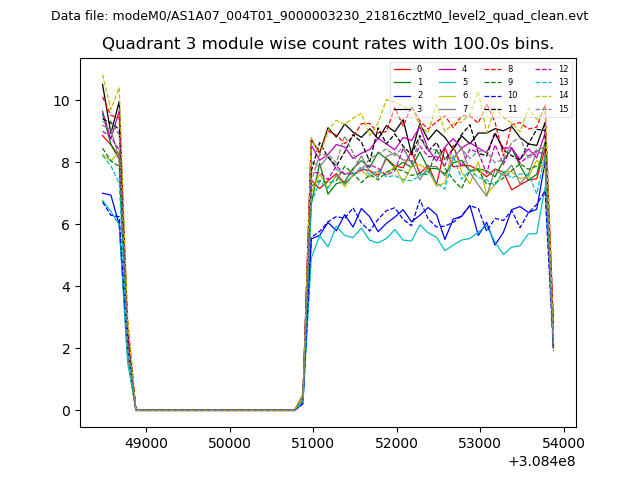
| Module-wise count rates for Quadrant C Data is divided into 100 sec bins |
 |
 |
| Module-wise count rates for Quadrant D Data is divided into 100 sec bins |
 |
 |
| Parameter | Plot |
|---|---|
| CZT HV Monitor | 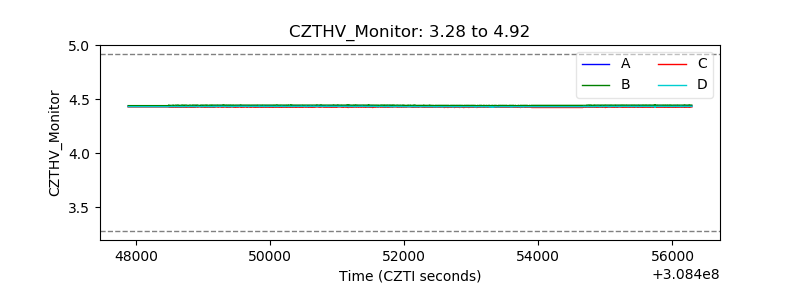 |
| D_VDD | 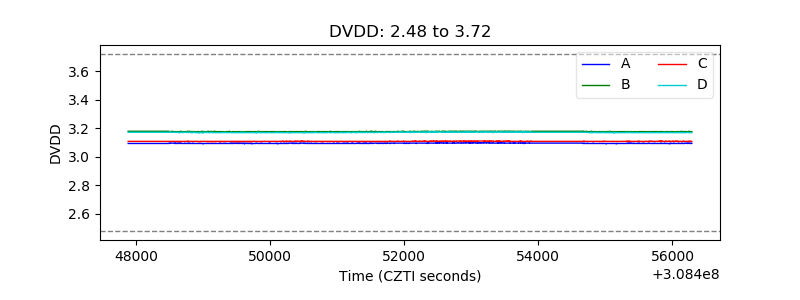 |
| Temperature 1 |  |
| Veto HV Monitor | 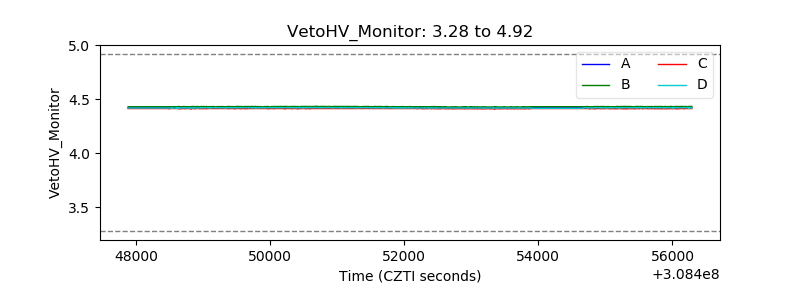 |
| Veto LLD |  |
| Alpha Counter |  |
| _CPM_Rate | 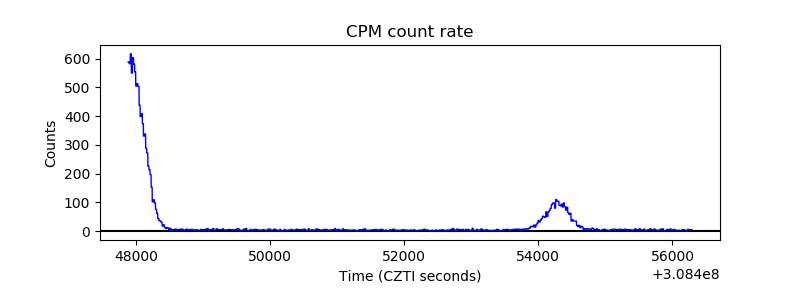 |
| CZT Counter | 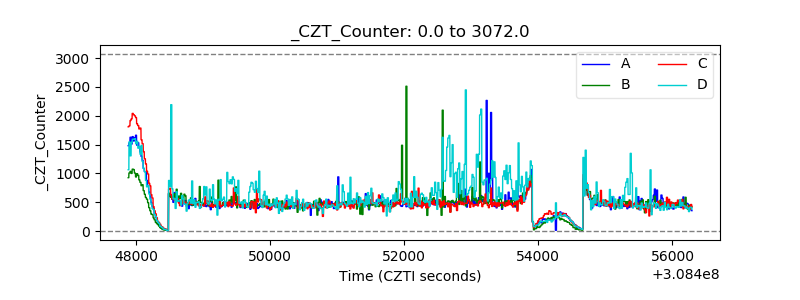 |
| +2.5 Volts monitor |  |
| +5 Volts monitor | 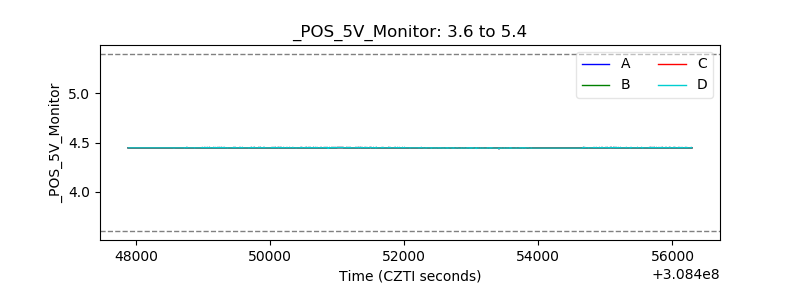 |
| _ROLL_ROT | 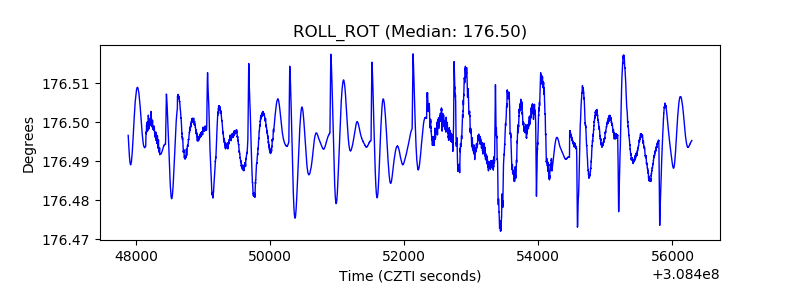 |
| _Roll_DEC | 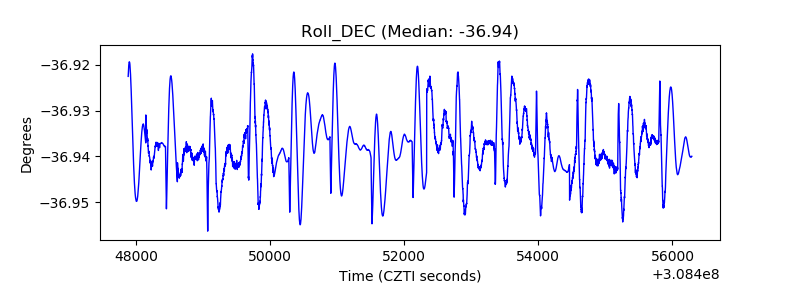 |
| _Roll_RA |  |
| Veto Counter | 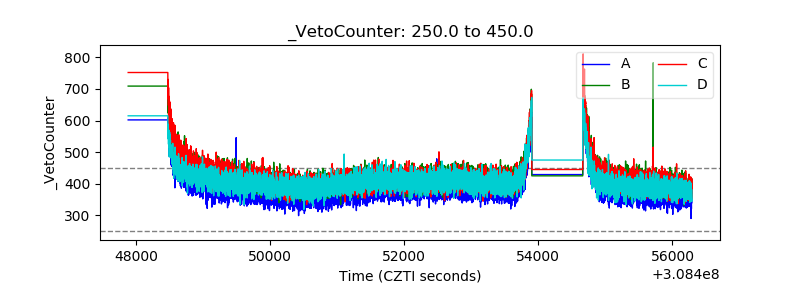 |