| Param | Original file | Final file |
|---|---|---|
| Filename | modeM0/AS1A07_004T01_9000003230_21817cztM0_level2.evt | modeM0/AS1A07_004T01_9000003230_21817cztM0_level2_quad_clean.evt |
| Size (bytes) | 498,913,920 | 78,750,720 |
| Size | 475.8 MB | 75.1 MB |
| Events in quadrant A | 3,560,647 | 469,301 |
| Events in quadrant B | 3,754,392 | 480,043 |
| Events in quadrant C | 3,562,936 | 466,566 |
| Events in quadrant D | 3,727,735 | 452,628 |
| Mode SS | |||
|---|---|---|---|
| Quadrant | BADHDUFLAG | Total packets | Discarded packets |
| A | 0 | 150 | 0 |
| B | 0 | 150 | 0 |
| C | 0 | 150 | 0 |
| D | 0 | 150 | 0 |
| Mode M0 | |||
|---|---|---|---|
| Quadrant | BADHDUFLAG | Total packets | Discarded packets |
| A | 0 | 15365 | 1 |
| B | 0 | 15807 | 1 |
| C | 0 | 15357 | 1 |
| D | 0 | 16249 | 1 |
| Mode M9 | |||
|---|---|---|---|
| Quadrant | BADHDUFLAG | Total packets | Discarded packets |
| A | 0 | 3 | 0 |
| B | 0 | 3 | 0 |
| C | 0 | 3 | 0 |
| D | 0 | 3 | 0 |
| Quadrant | Total seconds | Saturated seconds | Saturation percentage |
|---|---|---|---|
| A | 7414 | 167 | 2.252495% |
| B | 7414 | 194 | 2.616671% |
| C | 7414 | 189 | 2.549231% |
| D | 7414 | 160 | 2.158079% |
Noise dominated data is calculated using 1-second bins in cleaned event files. If a bin has >2000 counts, and if more than 50% of those come from <1% of pixels, then it is considered to be noise-dominated and hence unusable.
| Quadrant | # 1 sec bins | Bins with >0 counts | Bins with >2000 counts | High rate bins dominated by noise | Noise dominated (total time) | Noise dominated (detector-on time) | Marked lightcurve |
|---|---|---|---|---|---|---|---|
| A | 7689 | 7414 | 0 | 0 | 0.00% | 0.00% | 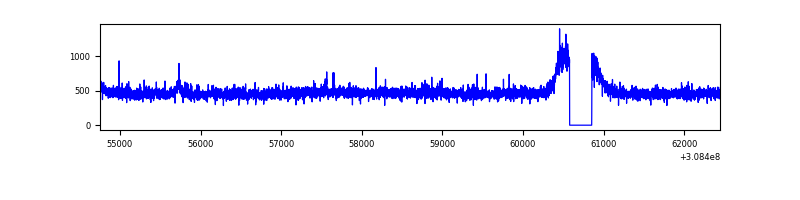 |
| B | 7689 | 7414 | 2 | 2 | 0.03% | 0.03% | 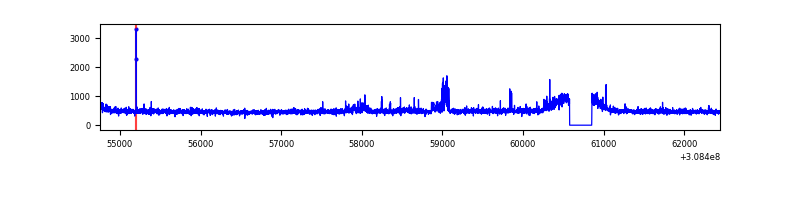 |
| C | 7689 | 7414 | 0 | 0 | 0.00% | 0.00% | 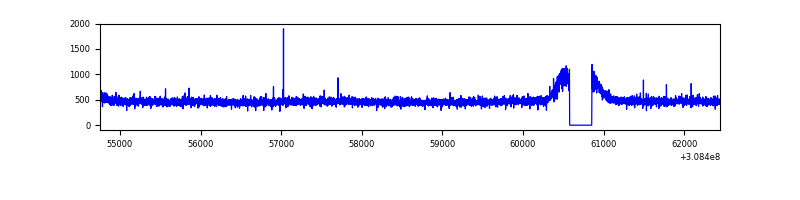 |
| D | 7689 | 7414 | 18 | 18 | 0.23% | 0.24% | 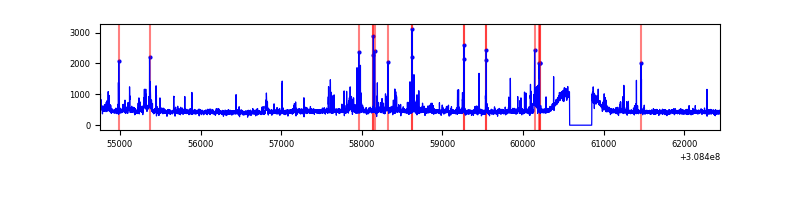 |
Top three noisy pixels from each quadrant. If the there are fewer than three noisy pixels in the level2.evt file, extra rows are filled as -1
| Pixel properties | Quadrant properties | ||||||
|---|---|---|---|---|---|---|---|
| Quadrant | DetID | PixID | Counts | Sigma | Mean | Median | Sigma |
| A | 13 | 252 | 47179 | 251.1 | 909 | 888 | 184.4 |
| A | 13 | 254 | 14185 | 72.13 | 909 | 888 | 184.4 |
| A | 3 | 137 | 7818 | 37.59 | 909 | 888 | 184.4 |
| B | 0 | 190 | 76328 | 424.37 | 914 | 891 | 177.8 |
| B | 0 | 197 | 32201 | 176.14 | 914 | 891 | 177.8 |
| B | 0 | 230 | 23386 | 126.55 | 914 | 891 | 177.8 |
| C | 14 | 238 | 134022 | 642.18 | 877 | 880 | 207.3 |
| C | 13 | 61 | 6086 | 25.11 | 877 | 880 | 207.3 |
| C | 10 | 23 | 4989 | 19.82 | 877 | 880 | 207.3 |
| D | 1 | 52 | 200001 | 918.35 | 886 | 859 | 216.8 |
| D | 13 | 153 | 50849 | 230.53 | 886 | 859 | 216.8 |
| D | 13 | 172 | 49357 | 223.65 | 886 | 859 | 216.8 |
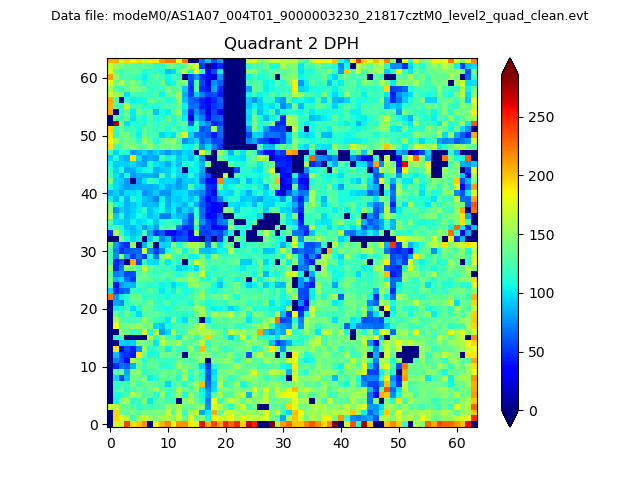
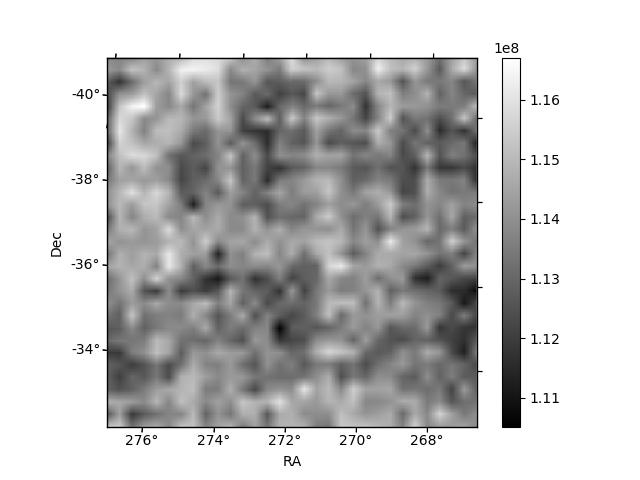
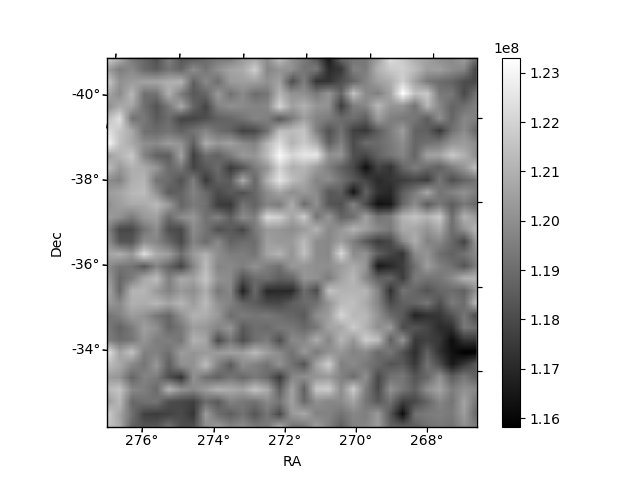
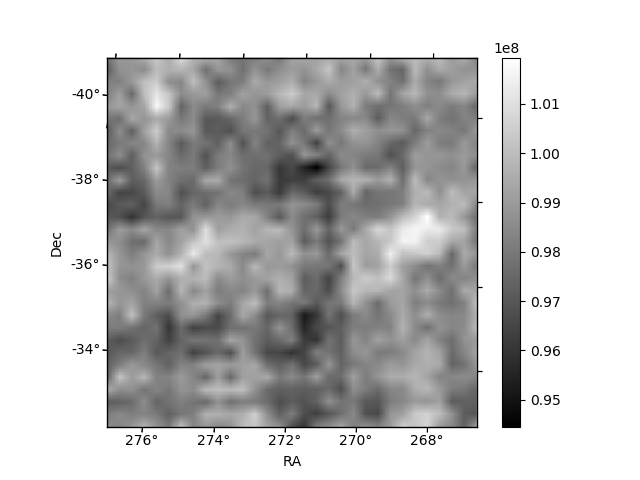
Histogram calculated using DETX and DETY for each event in the final _common_clean file
| Quadrant A |  |
 |
Quadrant B |
|---|---|---|---|
| Quadrant D | 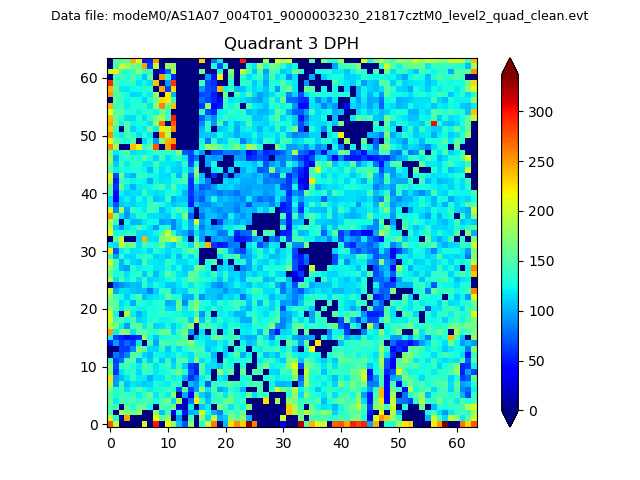 |
 |
Quadrant C |
| Plot type | Count rate plots | Images |
|---|---|---|
| Comparison with Poisson distribution Blue bars denote a histogram of data divided into 1 sec bins. Red curve is a Poisson curve with rate = median count rate of data. |
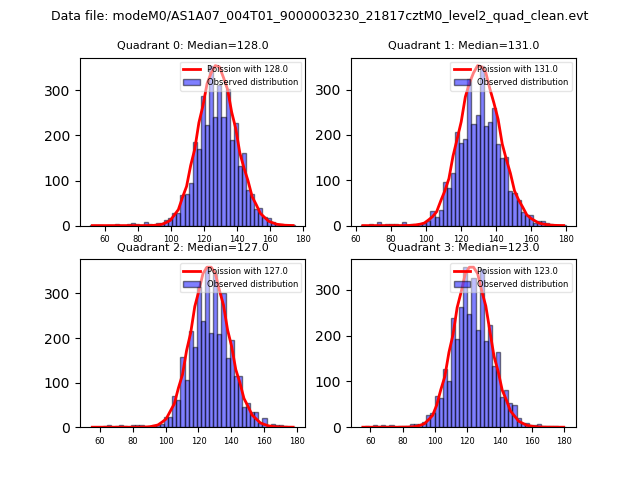 |
 |
| Quadrant-wise count rates Data is divided into 100 sec bins |
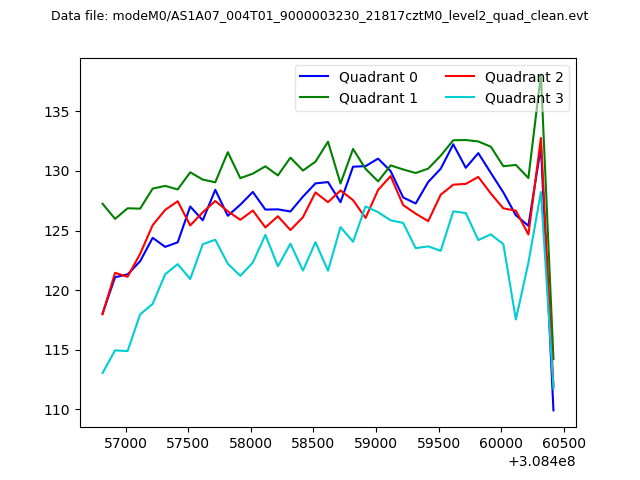 |
|
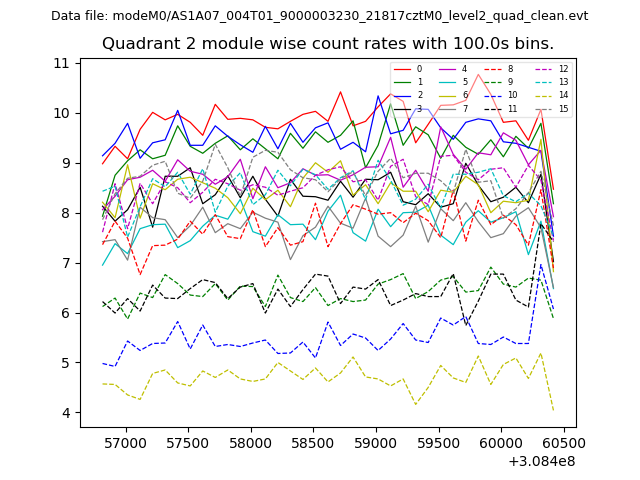
| Module-wise count rates for Quadrant A Data is divided into 100 sec bins |
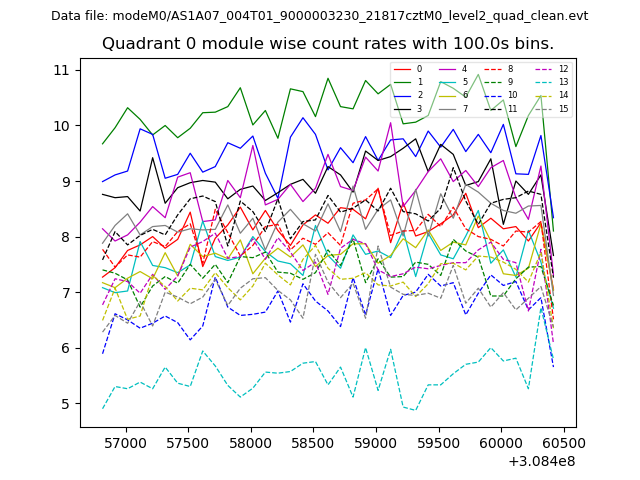 |
 |
| Module-wise count rates for Quadrant B Data is divided into 100 sec bins |
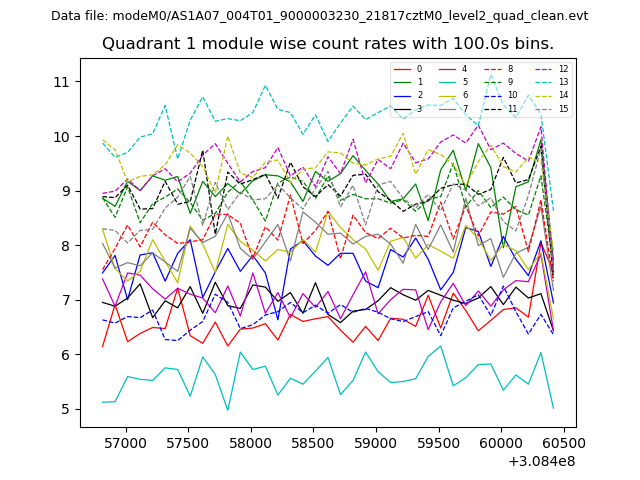 |
 |
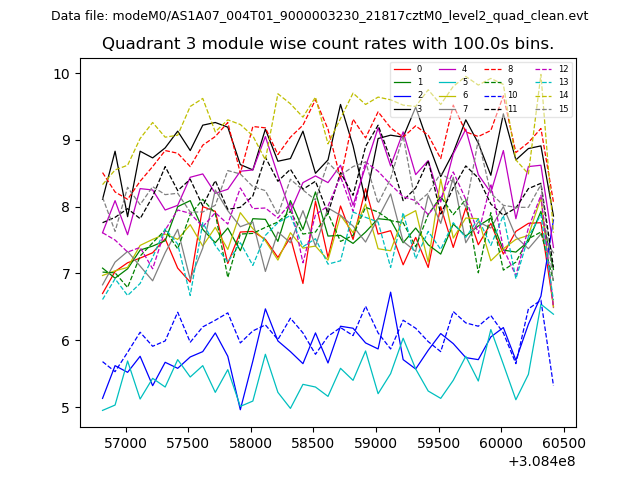
| Module-wise count rates for Quadrant C Data is divided into 100 sec bins |
 |
 |
| Module-wise count rates for Quadrant D Data is divided into 100 sec bins |
 |
 |
| Parameter | Plot |
|---|---|
| CZT HV Monitor |  |
| D_VDD | 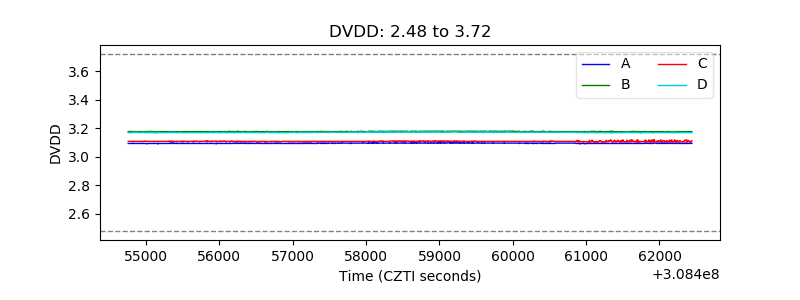 |
| Temperature 1 | 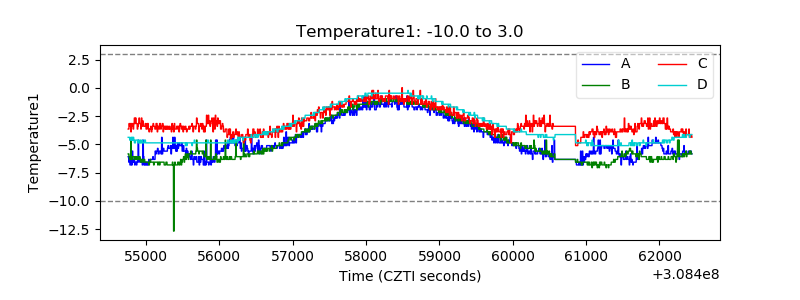 |
| Veto HV Monitor | 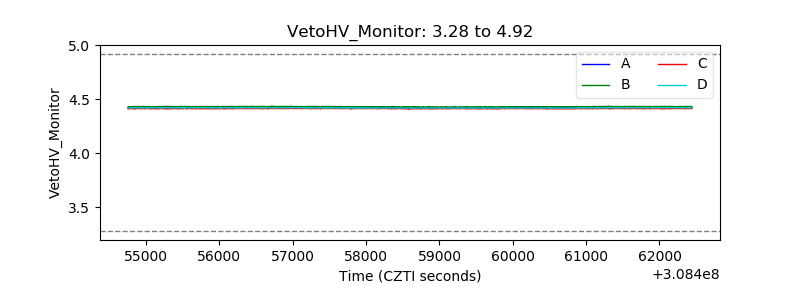 |
| Veto LLD | 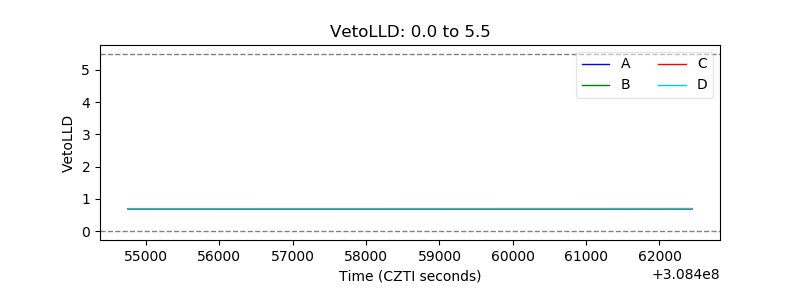 |
| Alpha Counter | 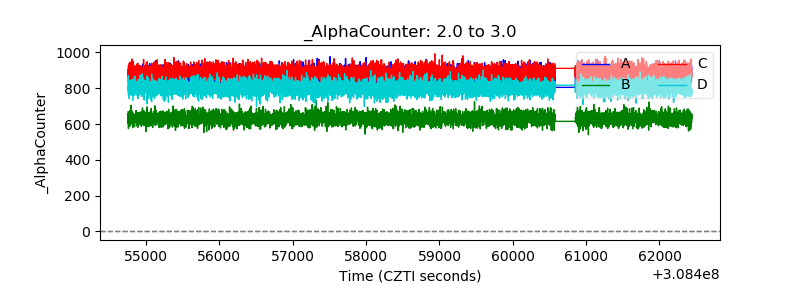 |
| _CPM_Rate | 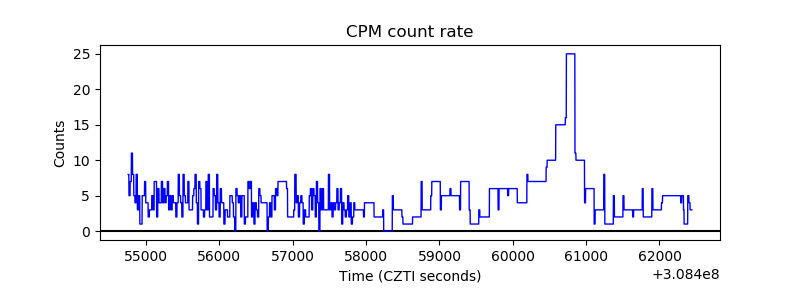 |
| CZT Counter | 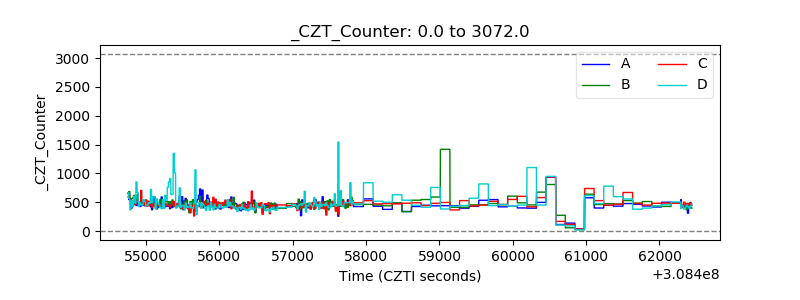 |
| +2.5 Volts monitor |  |
| +5 Volts monitor | 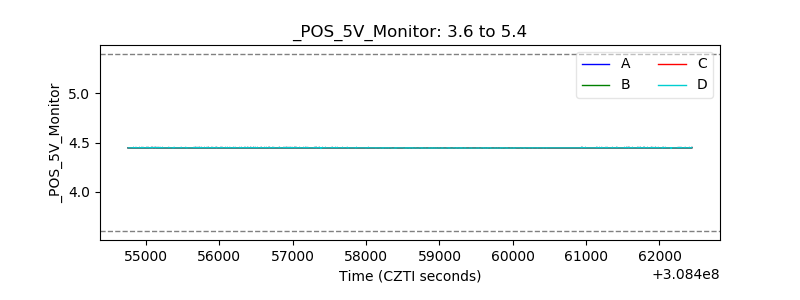 |
| _ROLL_ROT | 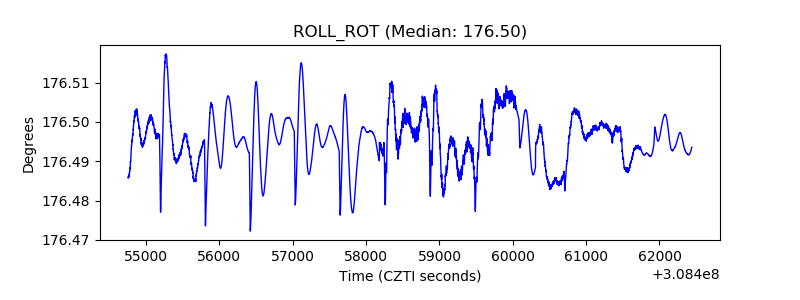 |
| _Roll_DEC | 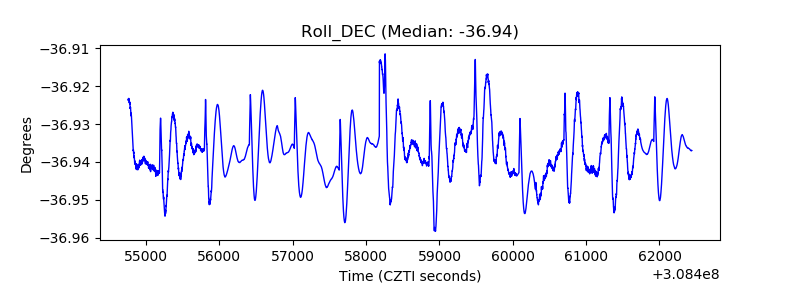 |
| _Roll_RA | 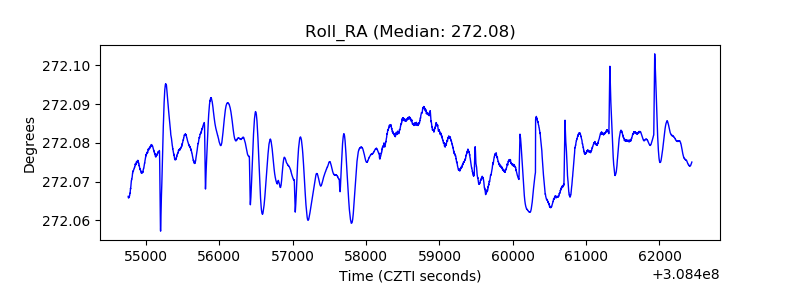 |
| Veto Counter | 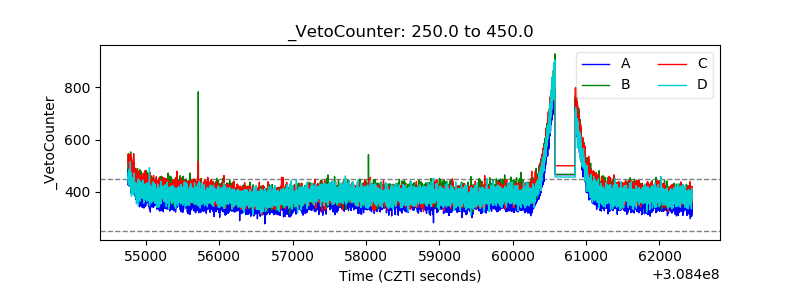 |