| Param | Original file | Final file |
|---|---|---|
| Filename | modeM0/AS1A07_004T01_9000003230_21819cztM0_level2.evt | modeM0/AS1A07_004T01_9000003230_21819cztM0_level2_quad_clean.evt |
| Size (bytes) | 571,944,960 | 94,665,600 |
| Size | 545.4 MB | 90.3 MB |
| Events in quadrant A | 4,419,719 | 570,617 |
| Events in quadrant B | 4,211,942 | 588,741 |
| Events in quadrant C | 4,069,582 | 570,172 |
| Events in quadrant D | 4,048,661 | 552,744 |
| Mode SS | |||
|---|---|---|---|
| Quadrant | BADHDUFLAG | Total packets | Discarded packets |
| A | 0 | 172 | 0 |
| B | 0 | 172 | 0 |
| C | 0 | 172 | 0 |
| D | 0 | 172 | 0 |
| Mode M0 | |||
|---|---|---|---|
| Quadrant | BADHDUFLAG | Total packets | Discarded packets |
| A | 0 | 18584 | 2 |
| B | 0 | 17726 | 2 |
| C | 0 | 17432 | 2 |
| D | 0 | 17815 | 2 |
| Mode M9 | |||
|---|---|---|---|
| Quadrant | BADHDUFLAG | Total packets | Discarded packets |
| A | 0 | 6 | 0 |
| B | 0 | 6 | 0 |
| C | 0 | 6 | 0 |
| D | 0 | 6 | 0 |
| Quadrant | Total seconds | Saturated seconds | Saturation percentage |
|---|---|---|---|
| A | 8414 | 359 | 4.266698% |
| B | 8415 | 297 | 3.529412% |
| C | 8415 | 312 | 3.707665% |
| D | 8415 | 233 | 2.768865% |
Noise dominated data is calculated using 1-second bins in cleaned event files. If a bin has >2000 counts, and if more than 50% of those come from <1% of pixels, then it is considered to be noise-dominated and hence unusable.
| Quadrant | # 1 sec bins | Bins with >0 counts | Bins with >2000 counts | High rate bins dominated by noise | Noise dominated (total time) | Noise dominated (detector-on time) | Marked lightcurve |
|---|---|---|---|---|---|---|---|
| A | 8989 | 8414 | 69 | 69 | 0.77% | 0.82% | 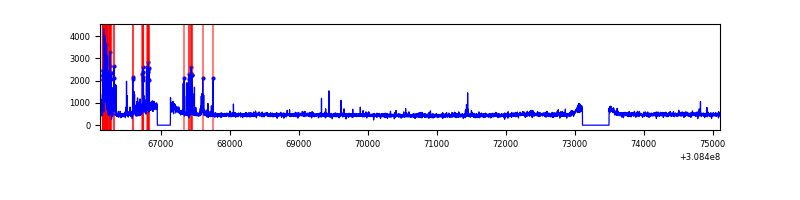 |
| B | 8990 | 8417 | 2 | 2 | 0.02% | 0.02% | 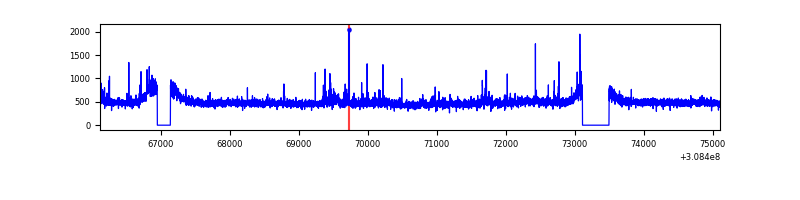 |
| C | 8990 | 8416 | 0 | 0 | 0.00% | 0.00% | 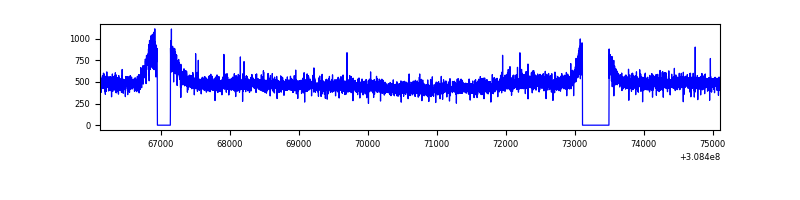 |
| D | 8990 | 8417 | 12 | 12 | 0.13% | 0.14% | 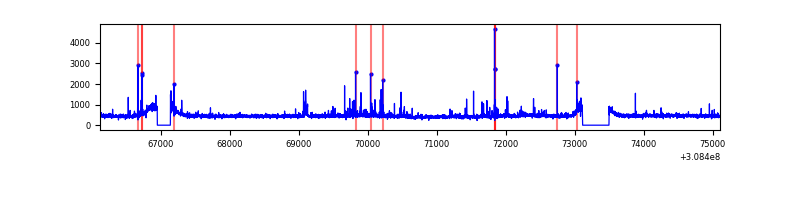 |
Top three noisy pixels from each quadrant. If the there are fewer than three noisy pixels in the level2.evt file, extra rows are filled as -1
| Pixel properties | Quadrant properties | ||||||
|---|---|---|---|---|---|---|---|
| Quadrant | DetID | PixID | Counts | Sigma | Mean | Median | Sigma |
| A | 4 | 2 | 383728 | 1835.18 | 1034 | 1008 | 208.5 |
| A | 5 | 16 | 32764 | 152.27 | 1034 | 1008 | 208.5 |
| A | 13 | 254 | 15717 | 70.53 | 1034 | 1008 | 208.5 |
| B | 3 | 64 | 33896 | 164.25 | 1038 | 1011 | 200.2 |
| B | 0 | 245 | 30317 | 146.37 | 1038 | 1011 | 200.2 |
| B | 0 | 197 | 29802 | 143.8 | 1038 | 1011 | 200.2 |
| C | 14 | 238 | 155428 | 652.07 | 1003 | 1008 | 236.8 |
| C | 13 | 61 | 6988 | 25.25 | 1003 | 1008 | 236.8 |
| C | 10 | 91 | 3677 | 11.27 | 1003 | 1008 | 236.8 |
| D | 13 | 172 | 57292 | 226.57 | 1014 | 983 | 248.5 |
| D | 13 | 104 | 50584 | 199.58 | 1014 | 983 | 248.5 |
| D | 2 | 234 | 37053 | 145.14 | 1014 | 983 | 248.5 |
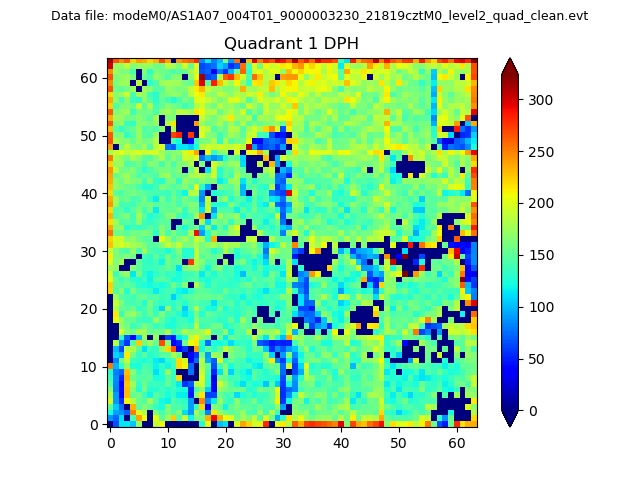
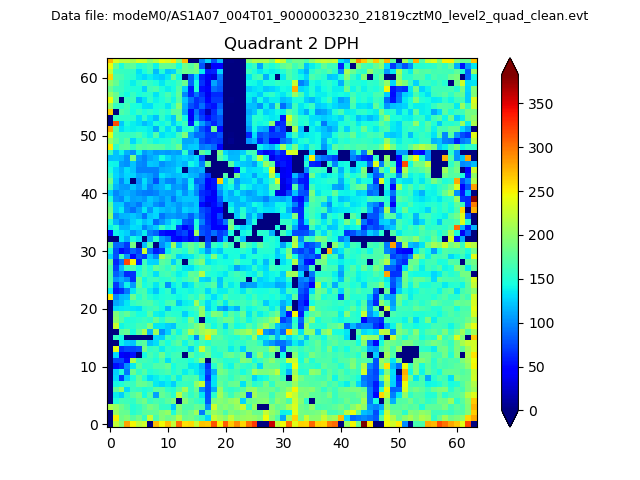
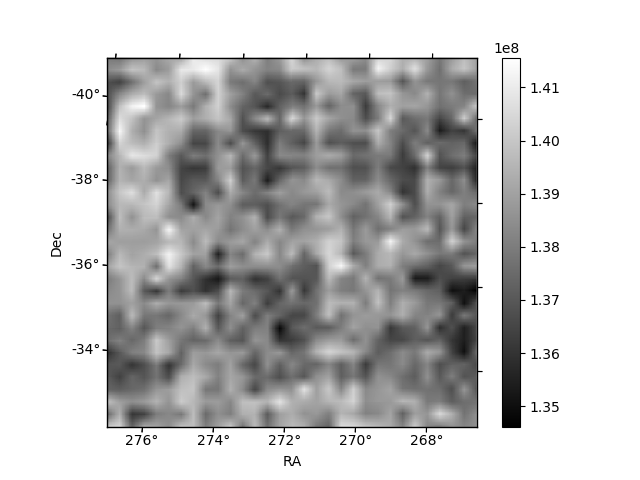
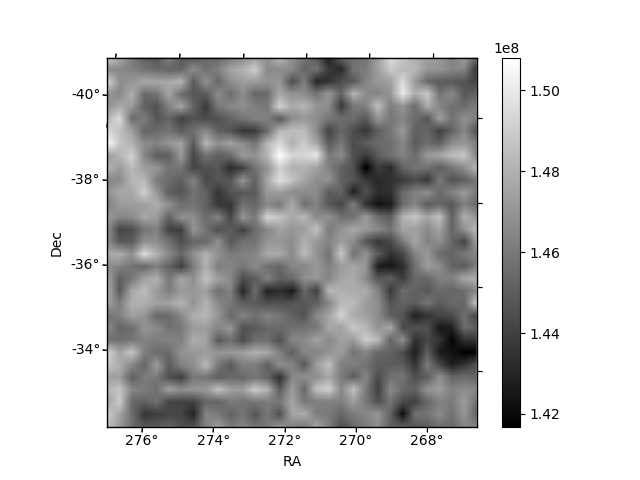
Histogram calculated using DETX and DETY for each event in the final _common_clean file
| Quadrant A |  |
 |
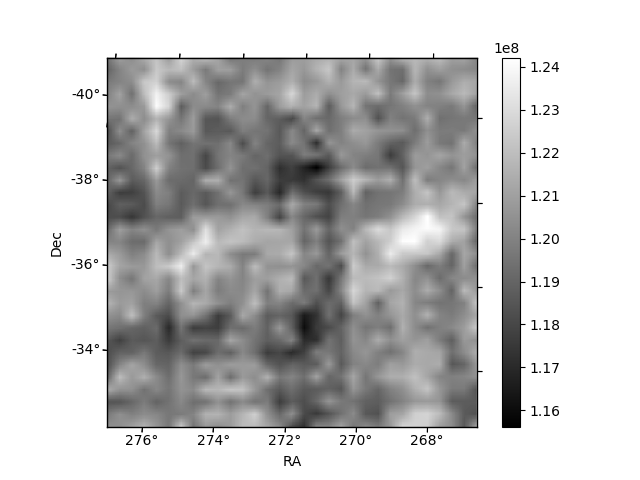
Quadrant B |
|---|---|---|---|
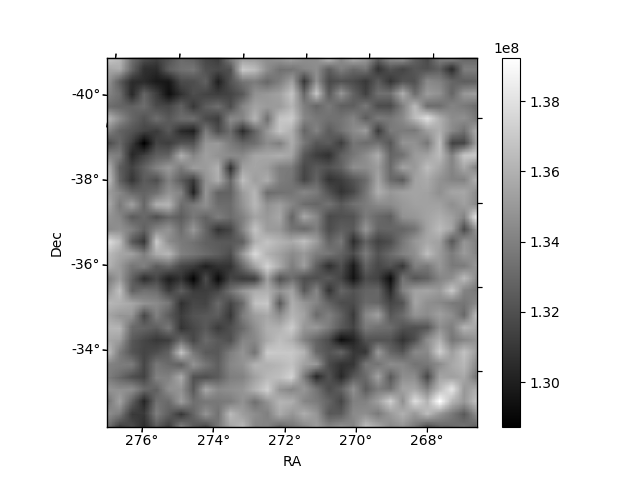
| Quadrant D |  |
 |
Quadrant C |
| Plot type | Count rate plots | Images |
|---|---|---|
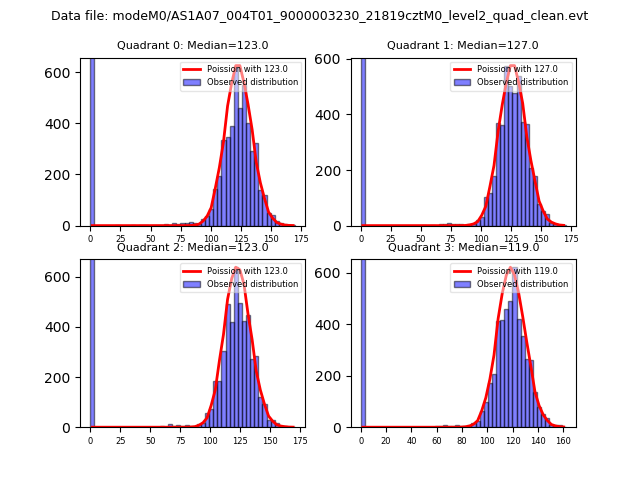
| Comparison with Poisson distribution Blue bars denote a histogram of data divided into 1 sec bins. Red curve is a Poisson curve with rate = median count rate of data. |
 |
 |
| Quadrant-wise count rates Data is divided into 100 sec bins |
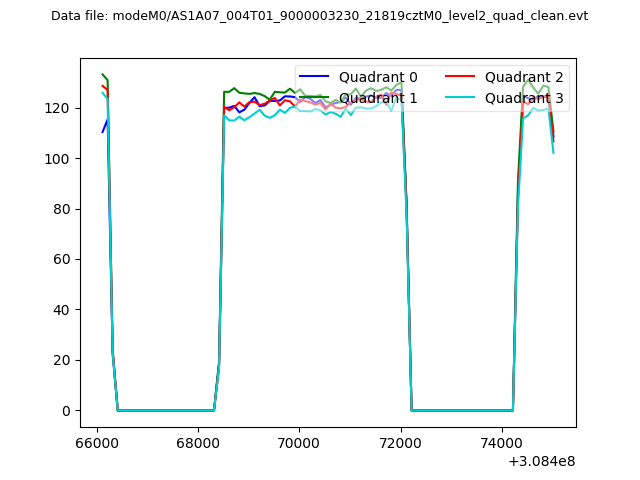 |
|
| Module-wise count rates for Quadrant A Data is divided into 100 sec bins |
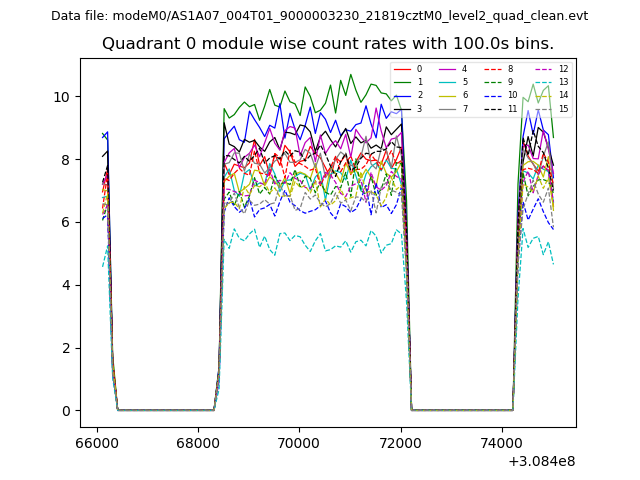 |
 |
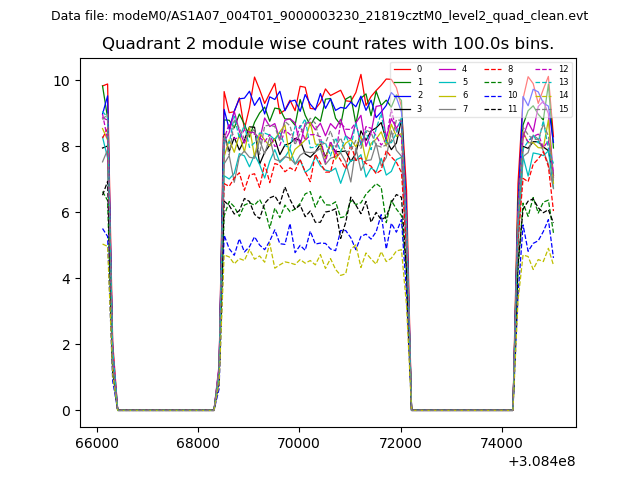
| Module-wise count rates for Quadrant B Data is divided into 100 sec bins |
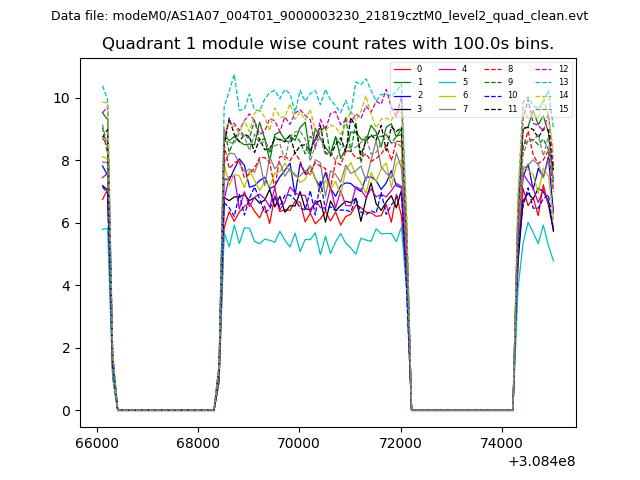 |
 |
| Module-wise count rates for Quadrant C Data is divided into 100 sec bins |
 |
 |
| Module-wise count rates for Quadrant D Data is divided into 100 sec bins |
 |
 |
| Parameter | Plot |
|---|---|
| CZT HV Monitor |  |
| D_VDD |  |
| Temperature 1 | 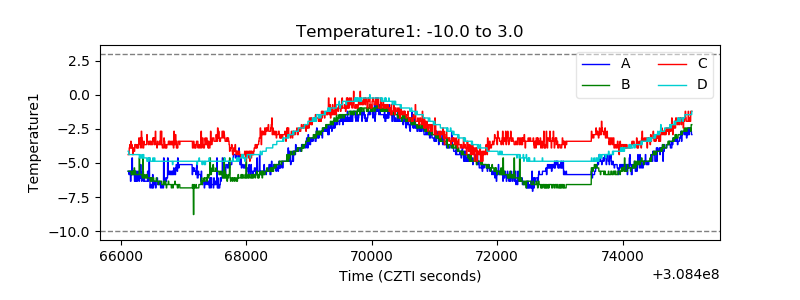 |
| Veto HV Monitor | 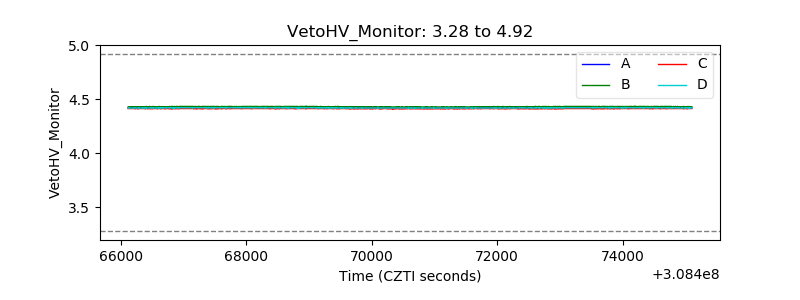 |
| Veto LLD | 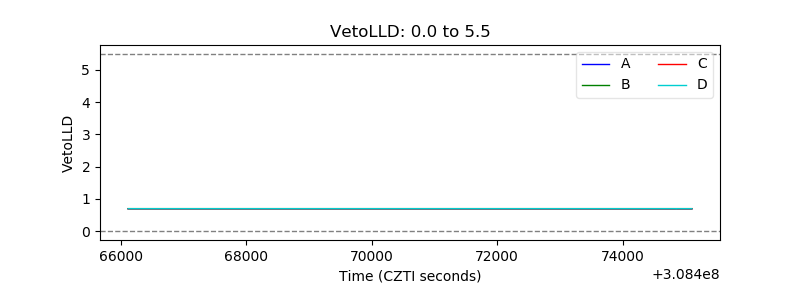 |
| Alpha Counter | 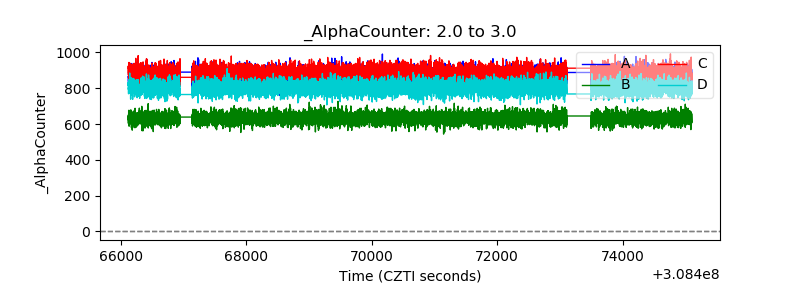 |
| _CPM_Rate | 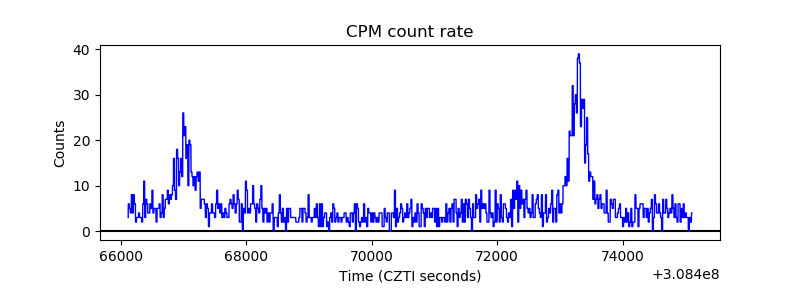 |
| CZT Counter | 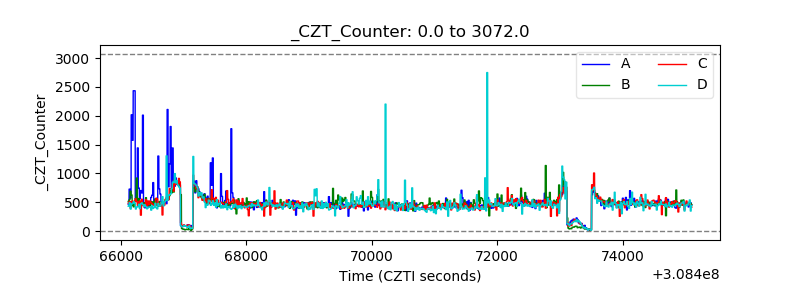 |
| +2.5 Volts monitor |  |
| +5 Volts monitor |  |
| _ROLL_ROT |  |
| _Roll_DEC | 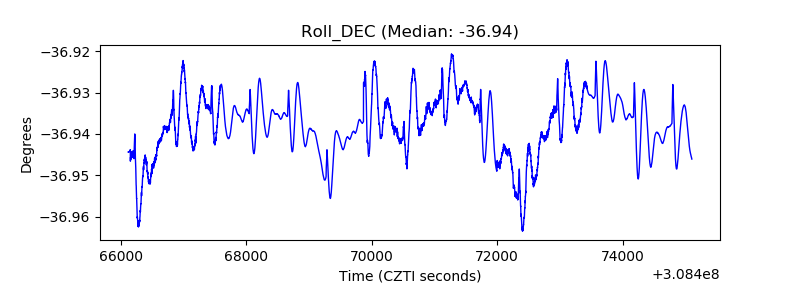 |
| _Roll_RA | 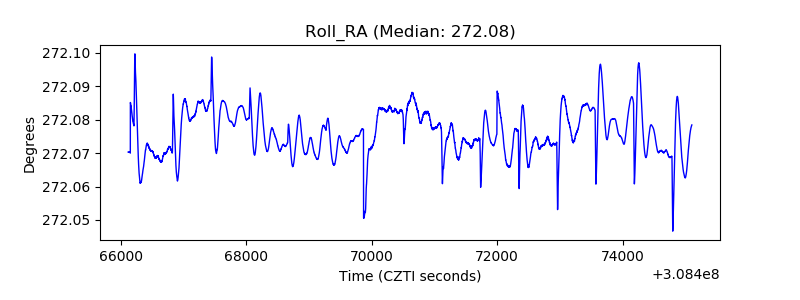 |
| Veto Counter | 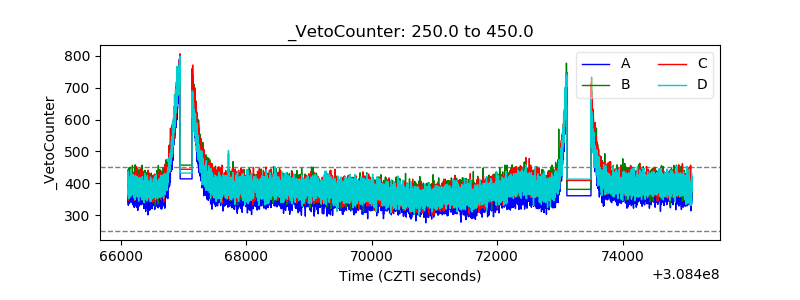 |