| Param | Original file | Final file |
|---|---|---|
| Filename | modeM0/AS1A07_004T01_9000003230_21821cztM0_level2.evt | modeM0/AS1A07_004T01_9000003230_21821cztM0_level2_quad_clean.evt |
| Size (bytes) | 913,844,160 | 175,682,880 |
| Size | 871.5 MB | 167.5 MB |
| Events in quadrant A | 6,366,023 | 1,106,896 |
| Events in quadrant B | 6,894,540 | 1,128,397 |
| Events in quadrant C | 6,395,790 | 1,095,822 |
| Events in quadrant D | 7,106,541 | 1,058,642 |
| Mode SS | |||
|---|---|---|---|
| Quadrant | BADHDUFLAG | Total packets | Discarded packets |
| A | 0 | 276 | 0 |
| B | 0 | 276 | 0 |
| C | 0 | 276 | 0 |
| D | 0 | 276 | 0 |
| Mode M0 | |||
|---|---|---|---|
| Quadrant | BADHDUFLAG | Total packets | Discarded packets |
| A | 0 | 27618 | 3 |
| B | 0 | 28747 | 3 |
| C | 0 | 27591 | 3 |
| D | 0 | 30154 | 3 |
| Mode M9 | |||
|---|---|---|---|
| Quadrant | BADHDUFLAG | Total packets | Discarded packets |
| A | 0 | 17 | 0 |
| B | 0 | 17 | 0 |
| C | 0 | 17 | 0 |
| D | 0 | 17 | 0 |
| Quadrant | Total seconds | Saturated seconds | Saturation percentage |
|---|---|---|---|
| A | 13478 | 198 | 1.469061% |
| B | 13479 | 220 | 1.632169% |
| C | 13479 | 235 | 1.743453% |
| D | 13479 | 240 | 1.780548% |
Noise dominated data is calculated using 1-second bins in cleaned event files. If a bin has >2000 counts, and if more than 50% of those come from <1% of pixels, then it is considered to be noise-dominated and hence unusable.
| Quadrant | # 1 sec bins | Bins with >0 counts | Bins with >2000 counts | High rate bins dominated by noise | Noise dominated (total time) | Noise dominated (detector-on time) | Marked lightcurve |
|---|---|---|---|---|---|---|---|
| A | 15198 | 13480 | 1 | 1 | 0.01% | 0.01% | 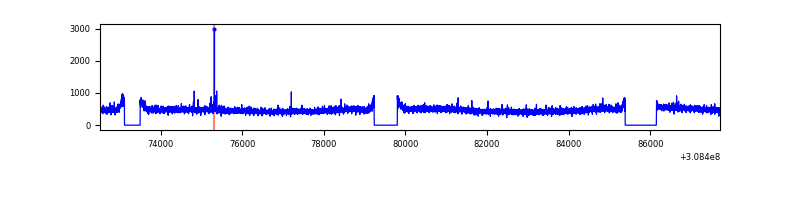 |
| B | 15199 | 13482 | 17 | 17 | 0.11% | 0.13% | 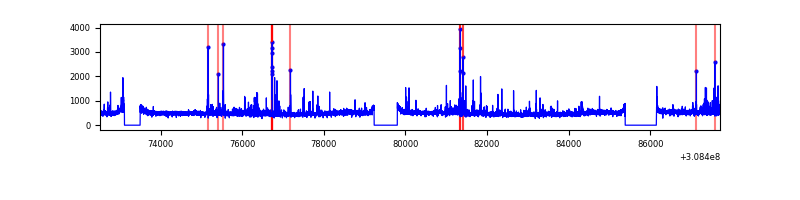 |
| C | 15199 | 13482 | 0 | 0 | 0.00% | 0.00% | 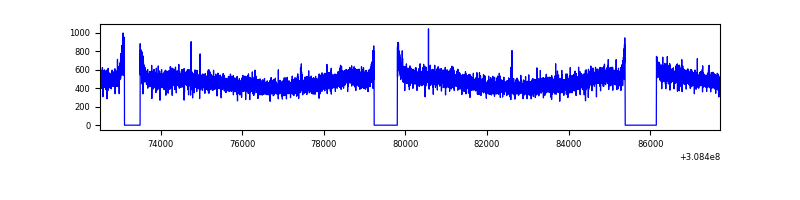 |
| D | 15199 | 13482 | 77 | 77 | 0.51% | 0.57% |  |
Top three noisy pixels from each quadrant. If the there are fewer than three noisy pixels in the level2.evt file, extra rows are filled as -1
| Pixel properties | Quadrant properties | ||||||
|---|---|---|---|---|---|---|---|
| Quadrant | DetID | PixID | Counts | Sigma | Mean | Median | Sigma |
| A | 4 | 2 | 28417 | 81.09 | 1638 | 1602 | 330.7 |
| A | 13 | 254 | 25143 | 71.19 | 1638 | 1602 | 330.7 |
| A | 0 | 226 | 14064 | 37.69 | 1638 | 1602 | 330.7 |
| B | 0 | 245 | 137720 | 434.12 | 1637 | 1593 | 313.6 |
| B | 3 | 64 | 102804 | 322.77 | 1637 | 1593 | 313.6 |
| B | 0 | 190 | 74457 | 232.37 | 1637 | 1593 | 313.6 |
| C | 14 | 238 | 245563 | 663.56 | 1571 | 1579 | 367.7 |
| C | 8 | 128 | 11655 | 27.4 | 1571 | 1579 | 367.7 |
| C | 13 | 61 | 10876 | 25.29 | 1571 | 1579 | 367.7 |
| D | 1 | 52 | 640042 | 1651.43 | 1589 | 1540 | 386.6 |
| D | 12 | 33 | 100209 | 255.2 | 1589 | 1540 | 386.6 |
| D | 12 | 32 | 88746 | 225.55 | 1589 | 1540 | 386.6 |
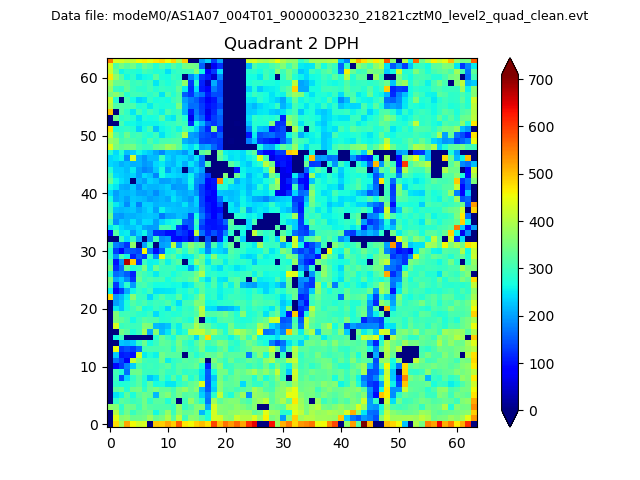
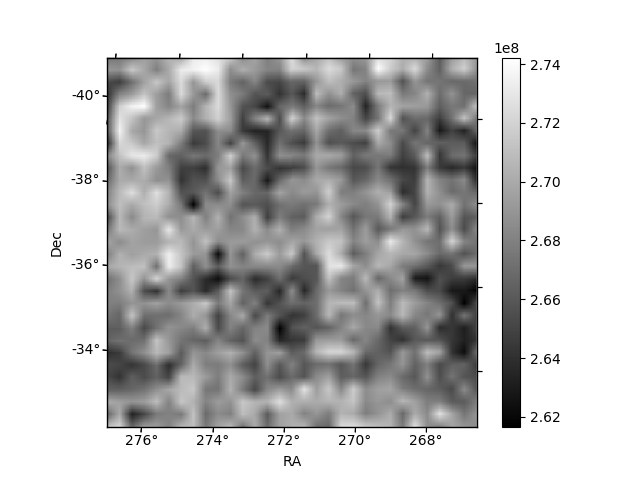
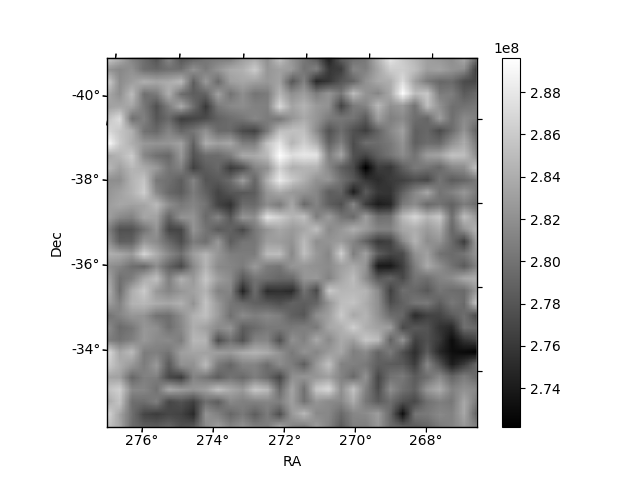
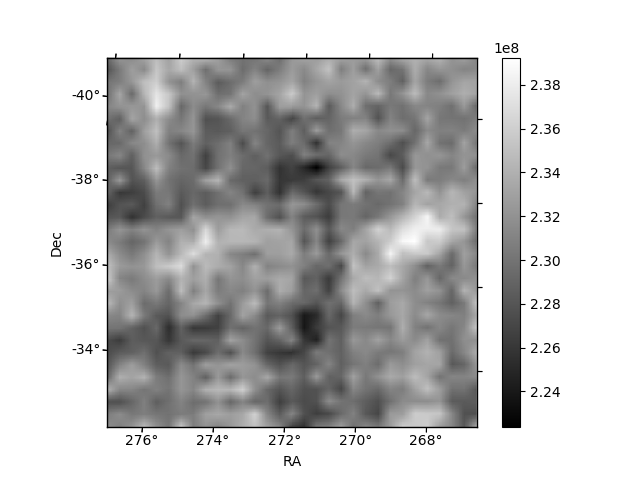
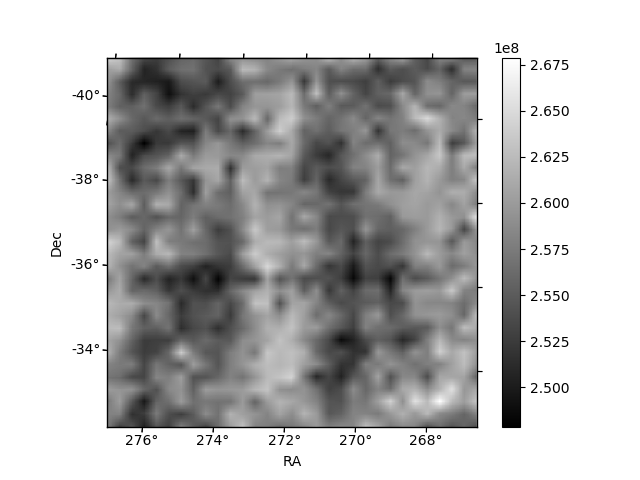
Histogram calculated using DETX and DETY for each event in the final _common_clean file
| Quadrant A | 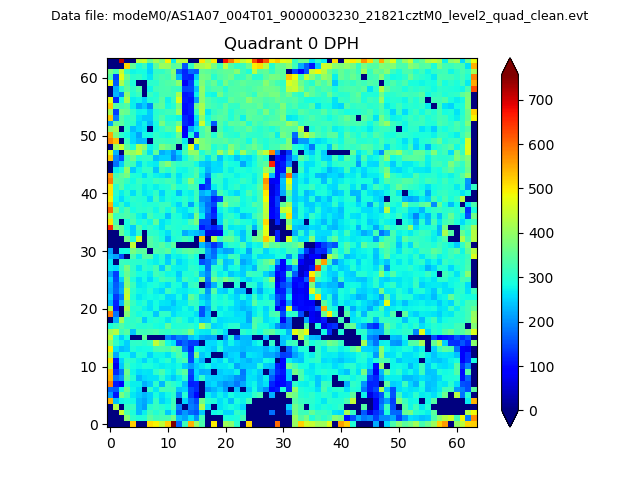 |
 |
Quadrant B |
|---|---|---|---|
| Quadrant D | 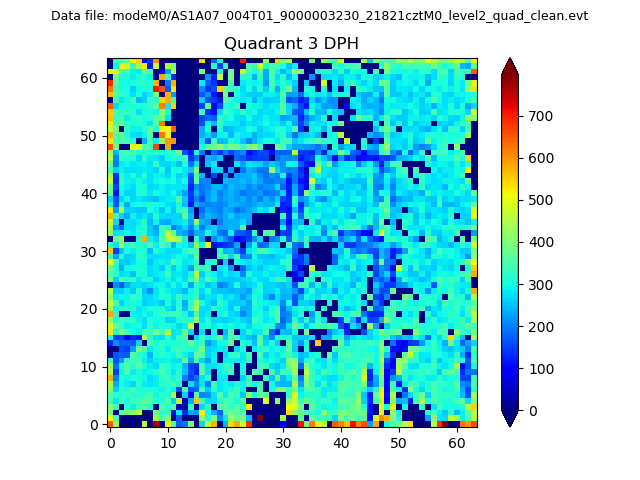 |
 |
Quadrant C |
| Plot type | Count rate plots | Images |
|---|---|---|
| Comparison with Poisson distribution Blue bars denote a histogram of data divided into 1 sec bins. Red curve is a Poisson curve with rate = median count rate of data. |
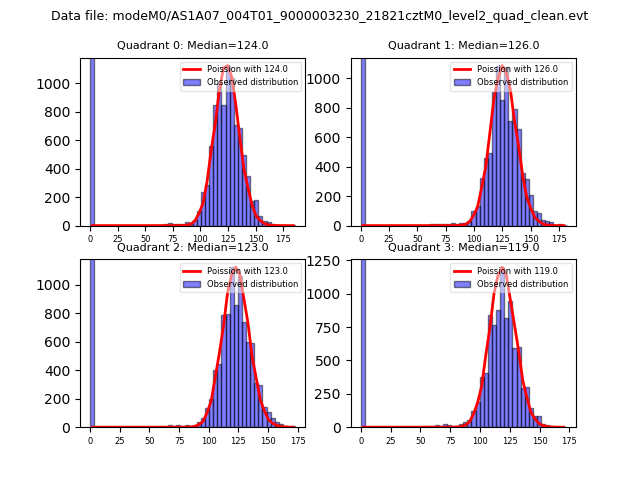 |
 |
| Quadrant-wise count rates Data is divided into 100 sec bins |
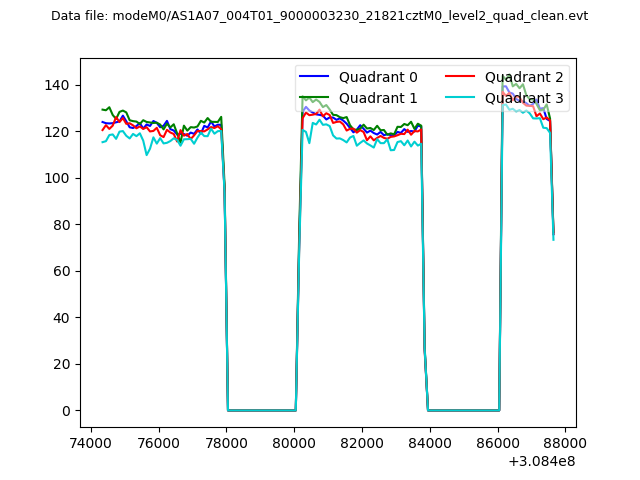 |
|
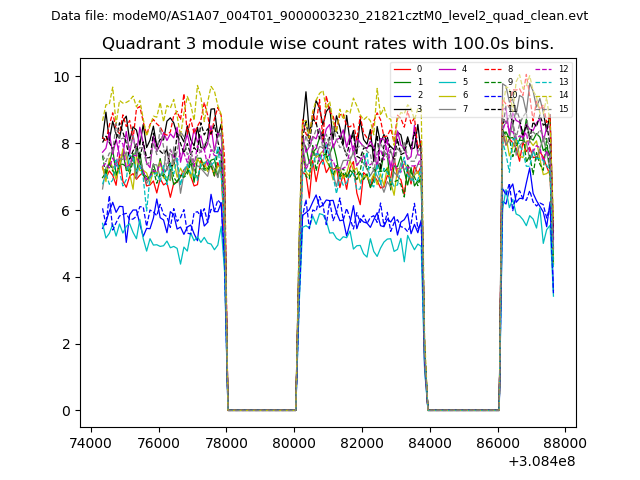
| Module-wise count rates for Quadrant A Data is divided into 100 sec bins |
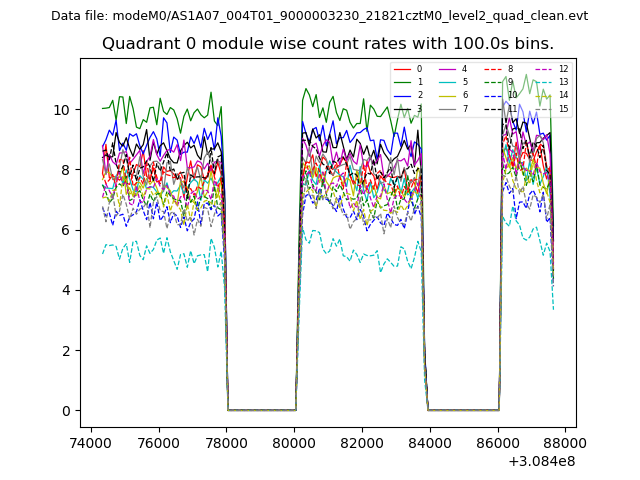 |
 |
| Module-wise count rates for Quadrant B Data is divided into 100 sec bins |
 |
 |
| Module-wise count rates for Quadrant C Data is divided into 100 sec bins |
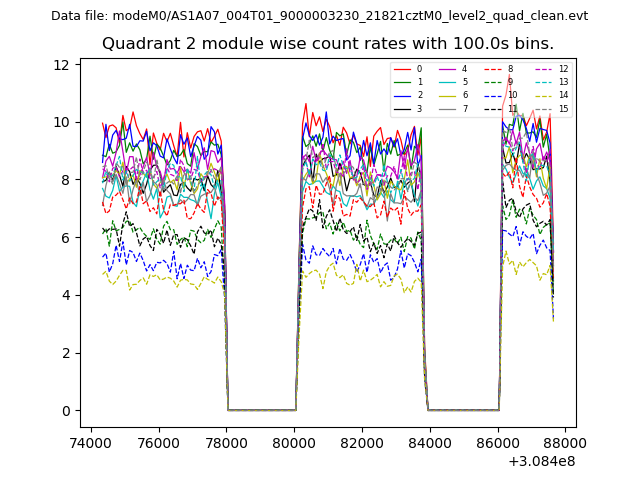 |
 |
| Module-wise count rates for Quadrant D Data is divided into 100 sec bins |
 |
 |
| Parameter | Plot |
|---|---|
| CZT HV Monitor | 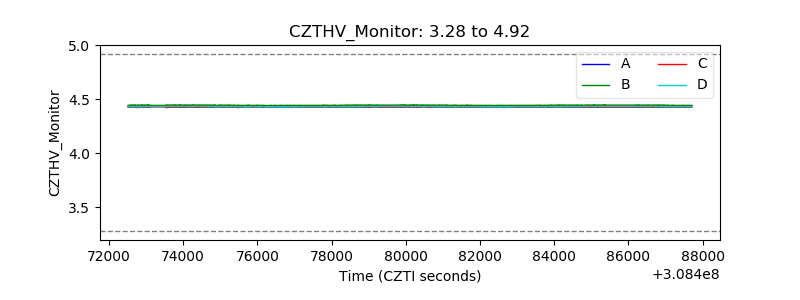 |
| D_VDD | 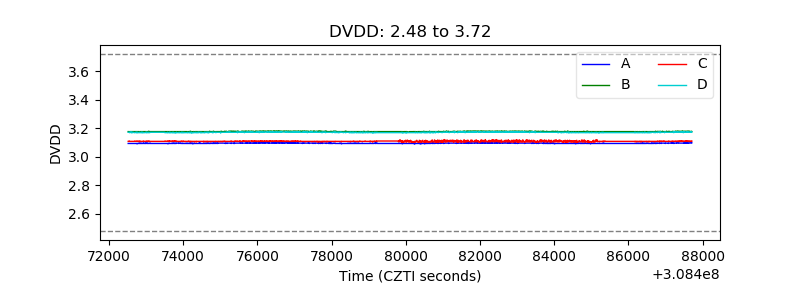 |
| Temperature 1 |  |
| Veto HV Monitor | 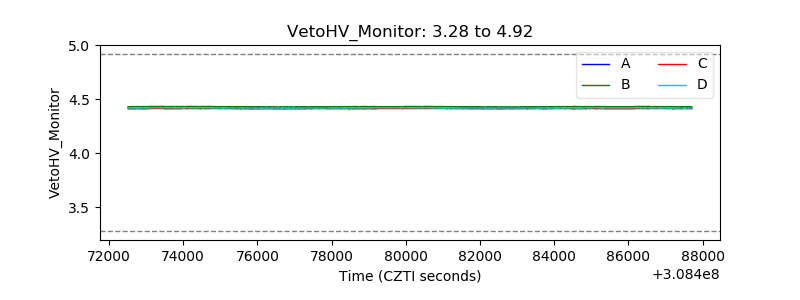 |
| Veto LLD | 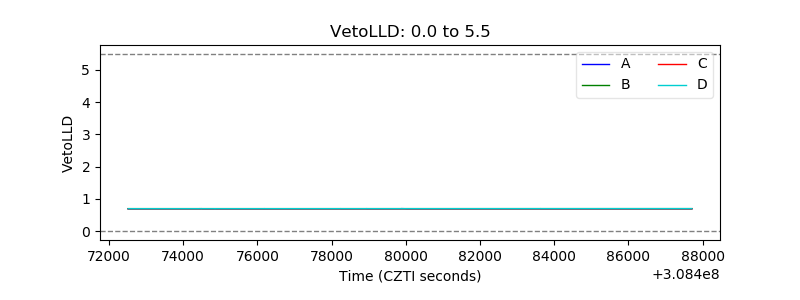 |
| Alpha Counter | 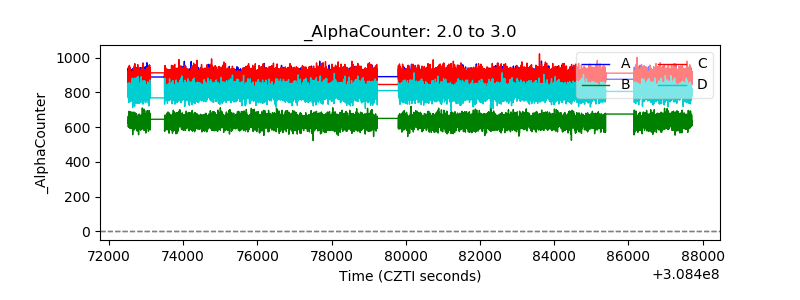 |
| _CPM_Rate | 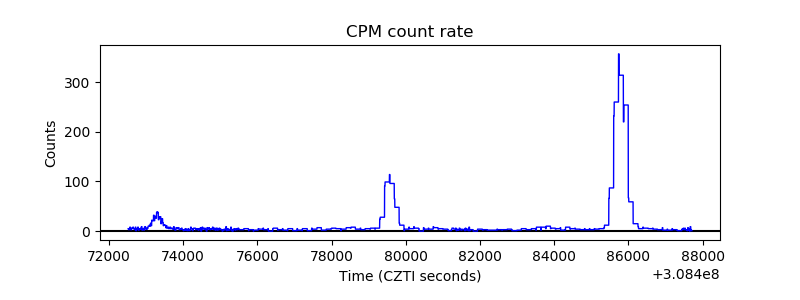 |
| CZT Counter |  |
| +2.5 Volts monitor | 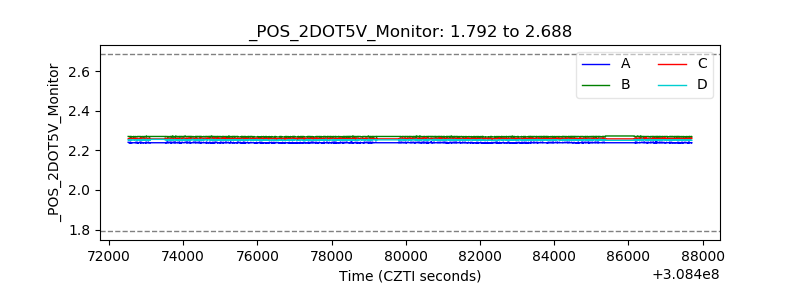 |
| +5 Volts monitor | 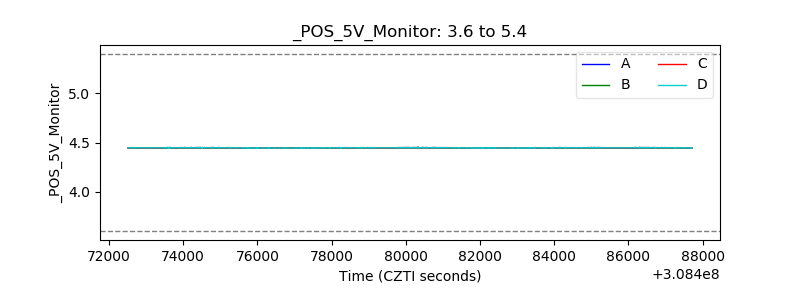 |
| _ROLL_ROT | 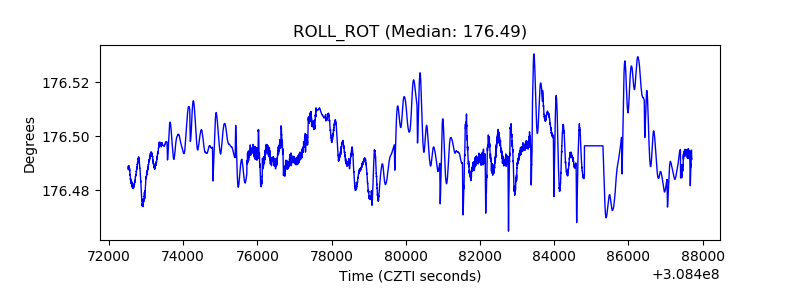 |
| _Roll_DEC | 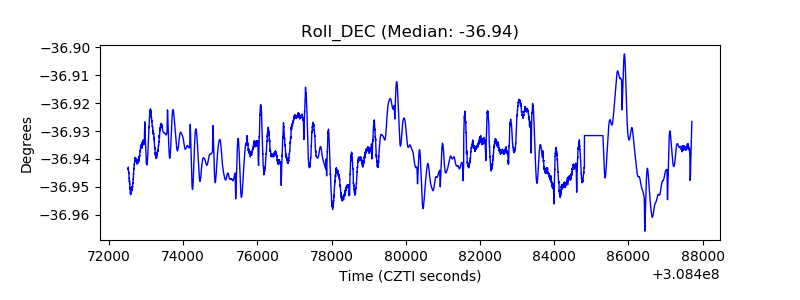 |
| _Roll_RA | 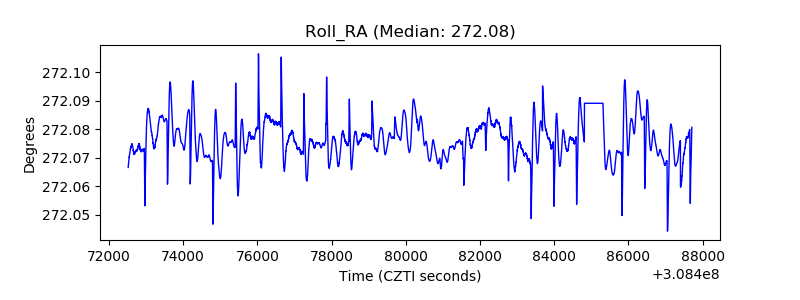 |
| Veto Counter | 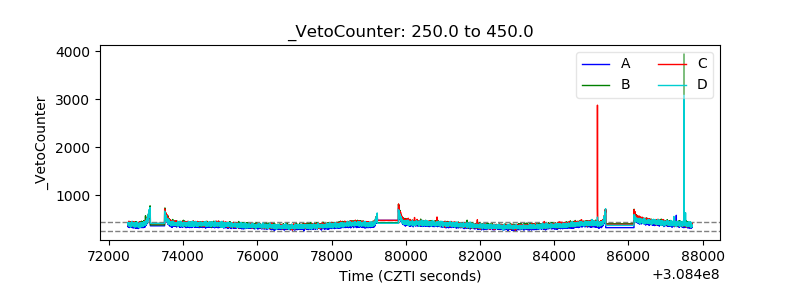 |