| Param | Original file | Final file |
|---|---|---|
| Filename | modeM0/AS1A07_004T01_9000003230_21822cztM0_level2.evt | modeM0/AS1A07_004T01_9000003230_21822cztM0_level2_quad_clean.evt |
| Size (bytes) | 492,834,240 | 101,894,400 |
| Size | 470.0 MB | 97.2 MB |
| Events in quadrant A | 3,337,336 | 662,736 |
| Events in quadrant B | 3,639,278 | 671,712 |
| Events in quadrant C | 3,300,267 | 647,319 |
| Events in quadrant D | 4,179,496 | 622,821 |
| Mode SS | |||
|---|---|---|---|
| Quadrant | BADHDUFLAG | Total packets | Discarded packets |
| A | 0 | 140 | 0 |
| B | 0 | 140 | 0 |
| C | 0 | 140 | 0 |
| D | 0 | 140 | 0 |
| Mode M0 | |||
|---|---|---|---|
| Quadrant | BADHDUFLAG | Total packets | Discarded packets |
| A | 0 | 14381 | 2 |
| B | 0 | 15129 | 2 |
| C | 0 | 14300 | 2 |
| D | 0 | 17104 | 2 |
| Mode M9 | |||
|---|---|---|---|
| Quadrant | BADHDUFLAG | Total packets | Discarded packets |
| A | 0 | 9 | 0 |
| B | 0 | 9 | 0 |
| C | 0 | 9 | 0 |
| D | 0 | 9 | 0 |
| Quadrant | Total seconds | Saturated seconds | Saturation percentage |
|---|---|---|---|
| A | 6909 | 64 | 0.926328% |
| B | 6910 | 87 | 1.259045% |
| C | 6910 | 81 | 1.172214% |
| D | 6910 | 181 | 2.619392% |
Noise dominated data is calculated using 1-second bins in cleaned event files. If a bin has >2000 counts, and if more than 50% of those come from <1% of pixels, then it is considered to be noise-dominated and hence unusable.
| Quadrant | # 1 sec bins | Bins with >0 counts | Bins with >2000 counts | High rate bins dominated by noise | Noise dominated (total time) | Noise dominated (detector-on time) | Marked lightcurve |
|---|---|---|---|---|---|---|---|
| A | 7799 | 6909 | 3 | 3 | 0.04% | 0.04% | 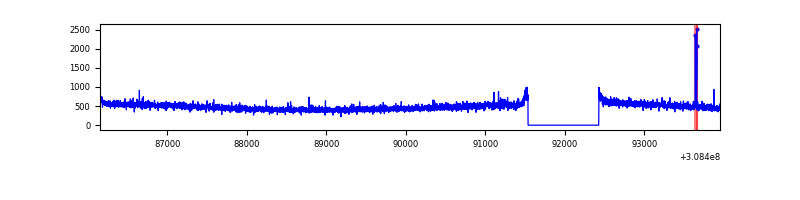 |
| B | 7800 | 6910 | 17 | 17 | 0.22% | 0.25% | 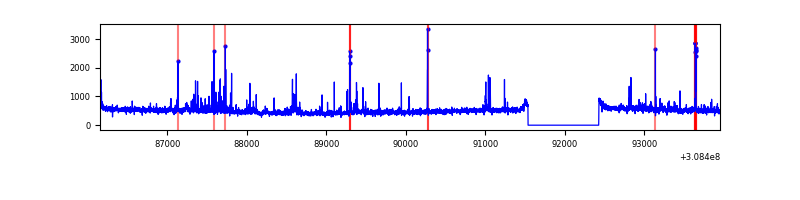 |
| C | 7800 | 6910 | 0 | 0 | 0.00% | 0.00% | 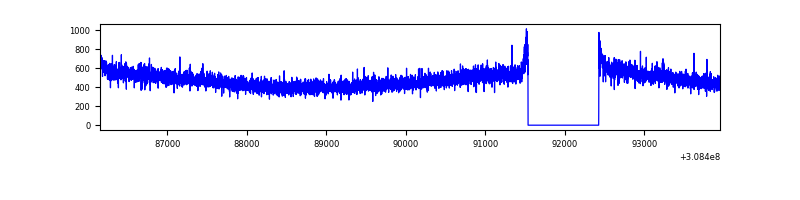 |
| D | 7800 | 6910 | 112 | 112 | 1.44% | 1.62% | 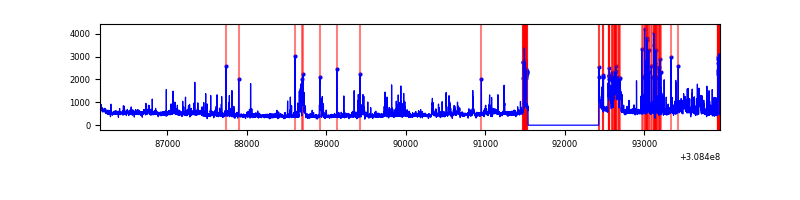 |
Top three noisy pixels from each quadrant. If the there are fewer than three noisy pixels in the level2.evt file, extra rows are filled as -1
| Pixel properties | Quadrant properties | ||||||
|---|---|---|---|---|---|---|---|
| Quadrant | DetID | PixID | Counts | Sigma | Mean | Median | Sigma |
| A | 2 | 79 | 18226 | 99.79 | 855 | 838 | 174.2 |
| A | 13 | 254 | 13133 | 70.56 | 855 | 838 | 174.2 |
| A | 13 | 252 | 9091 | 47.36 | 855 | 838 | 174.2 |
| B | 0 | 245 | 114487 | 692.63 | 848 | 825 | 164.1 |
| B | 3 | 64 | 94264 | 569.4 | 848 | 825 | 164.1 |
| B | 0 | 190 | 30853 | 182.98 | 848 | 825 | 164.1 |
| C | 14 | 238 | 126542 | 659.71 | 812 | 817 | 190.6 |
| C | 13 | 61 | 5604 | 25.12 | 812 | 817 | 190.6 |
| C | 3 | 248 | 4251 | 18.02 | 812 | 817 | 190.6 |
| D | 1 | 52 | 611017 | 3070.99 | 817 | 793 | 198.7 |
| D | 7 | 238 | 280567 | 1407.98 | 817 | 793 | 198.7 |
| D | 13 | 172 | 42885 | 211.83 | 817 | 793 | 198.7 |
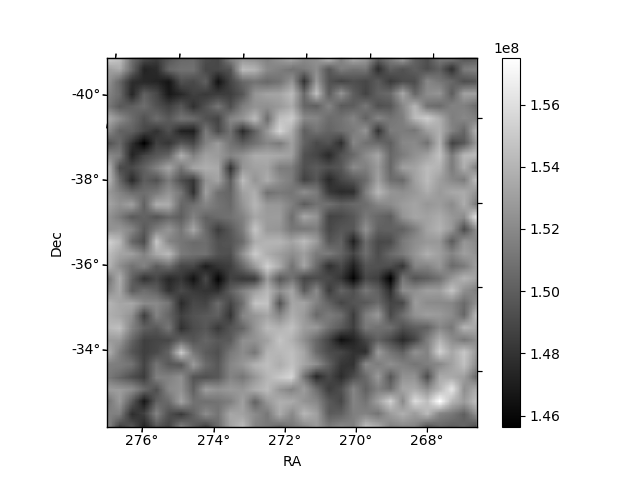
Histogram calculated using DETX and DETY for each event in the final _common_clean file
| Quadrant A | 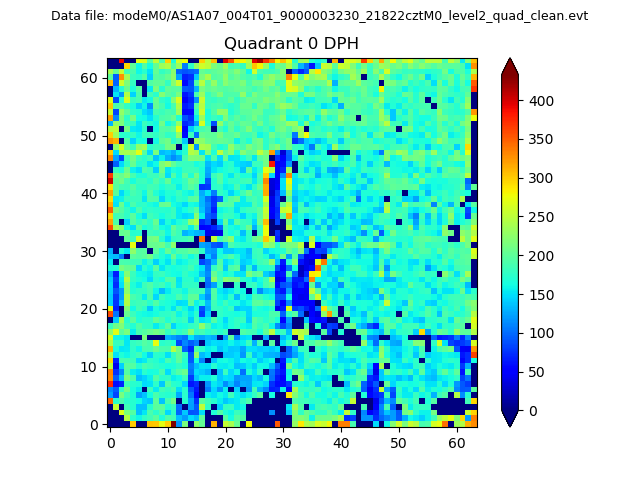 |
 |
Quadrant B |
|---|---|---|---|
| Quadrant D | 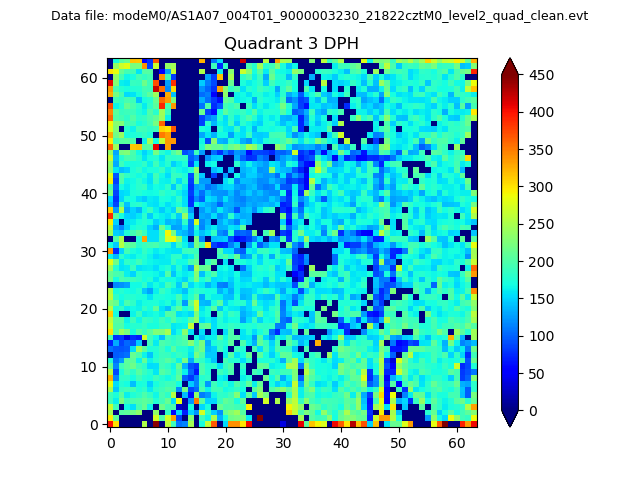 |
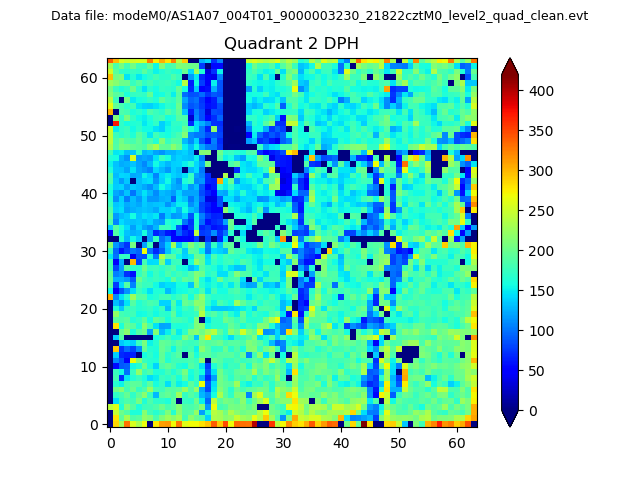 |
Quadrant C |
| Plot type | Count rate plots | Images |
|---|---|---|
| Comparison with Poisson distribution Blue bars denote a histogram of data divided into 1 sec bins. Red curve is a Poisson curve with rate = median count rate of data. |
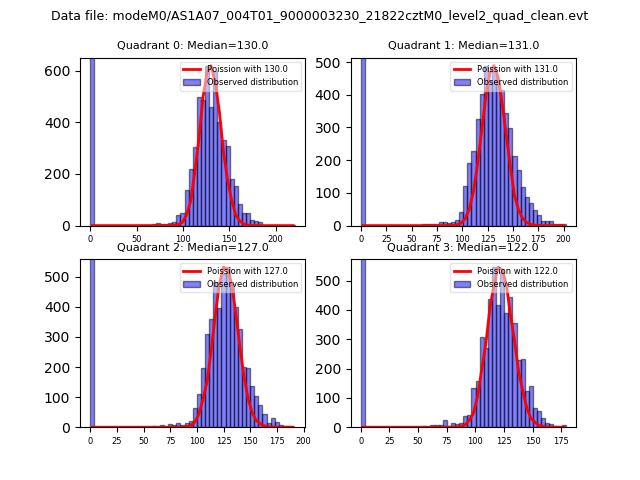 |
 |
| Quadrant-wise count rates Data is divided into 100 sec bins |
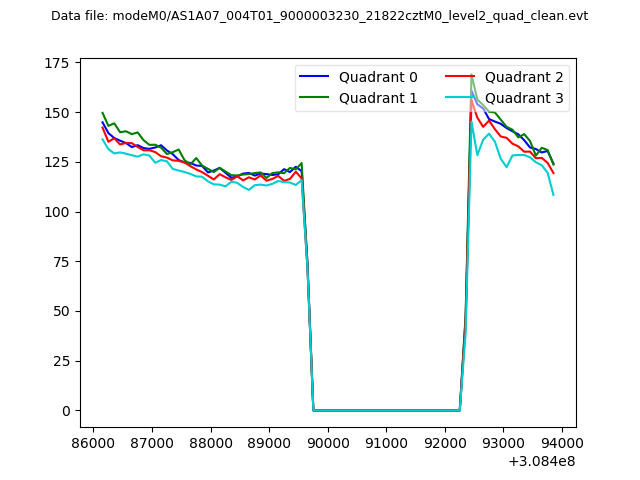 |
|
| Module-wise count rates for Quadrant A Data is divided into 100 sec bins |
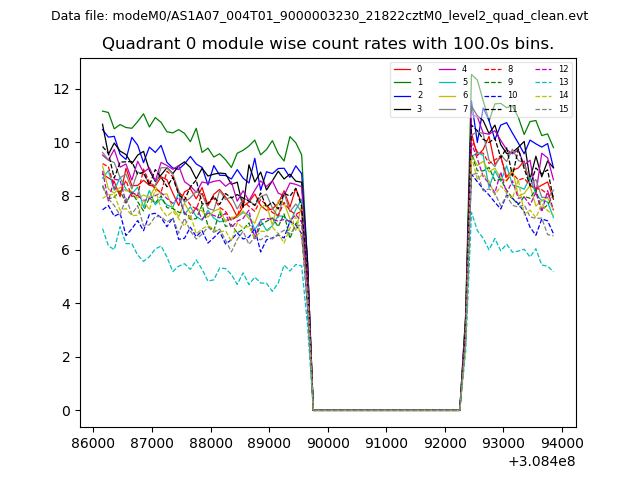 |
 |
| Module-wise count rates for Quadrant B Data is divided into 100 sec bins |
 |
 |
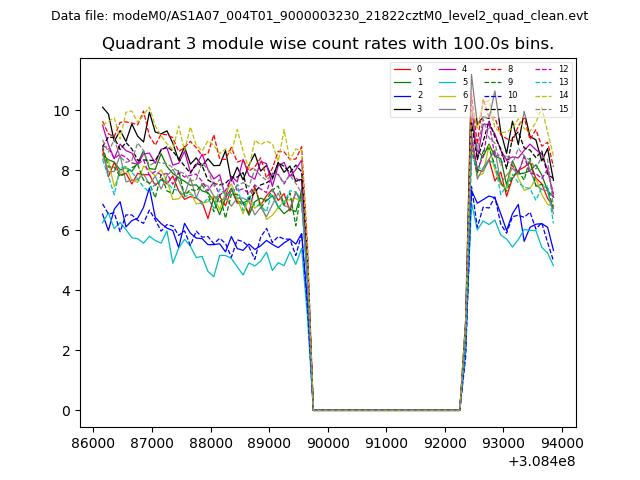
| Module-wise count rates for Quadrant C Data is divided into 100 sec bins |
 |
 |
| Module-wise count rates for Quadrant D Data is divided into 100 sec bins |
 |
 |
| Parameter | Plot |
|---|---|
| CZT HV Monitor | 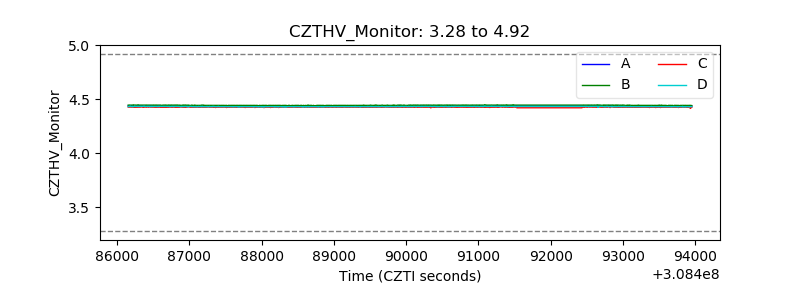 |
| D_VDD | 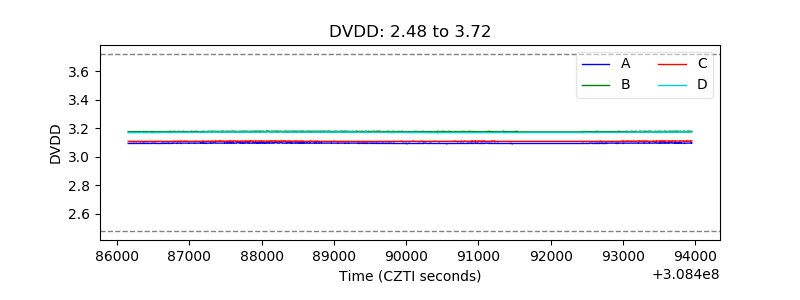 |
| Temperature 1 |  |
| Veto HV Monitor | 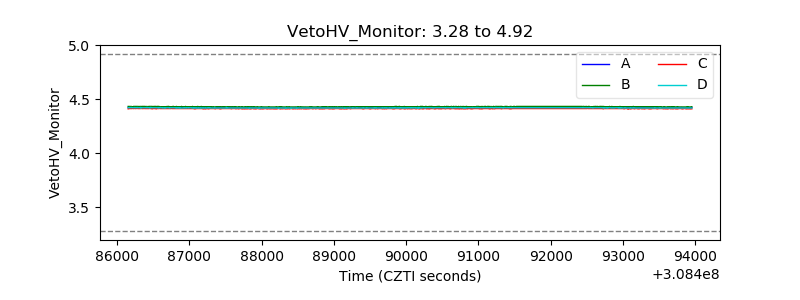 |
| Veto LLD | 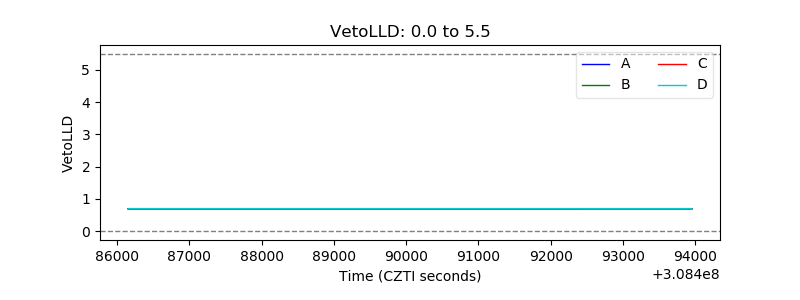 |
| Alpha Counter | 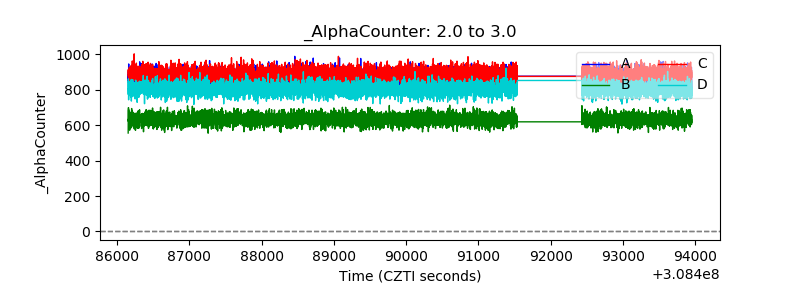 |
| _CPM_Rate | 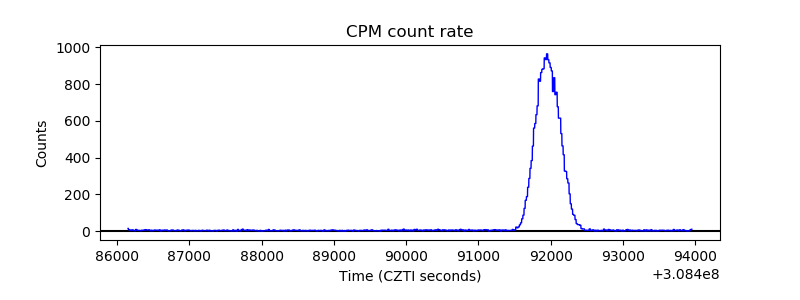 |
| CZT Counter |  |
| +2.5 Volts monitor |  |
| +5 Volts monitor |  |
| _ROLL_ROT | 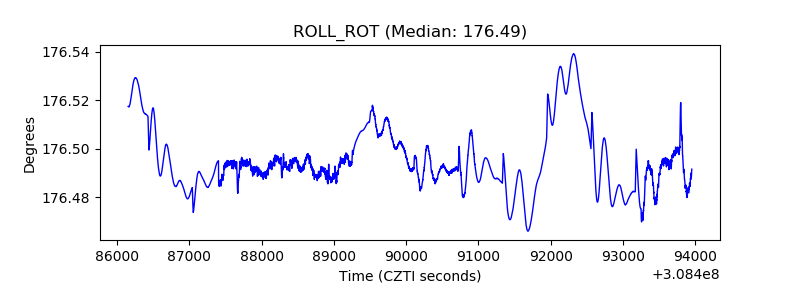 |
| _Roll_DEC | 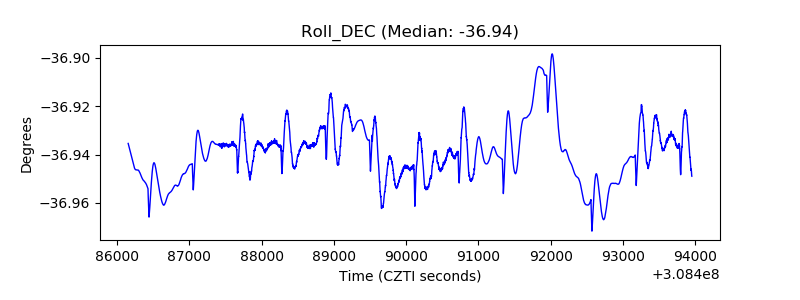 |
| _Roll_RA | 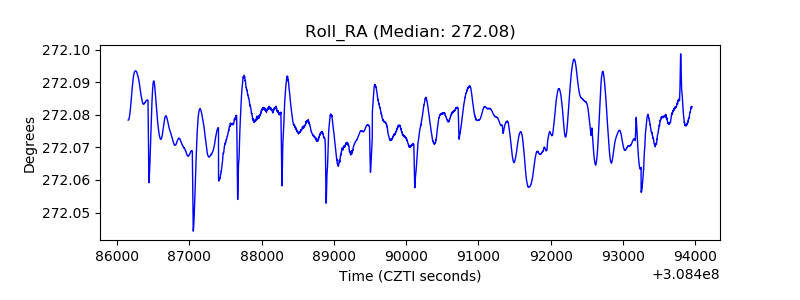 |
| Veto Counter | 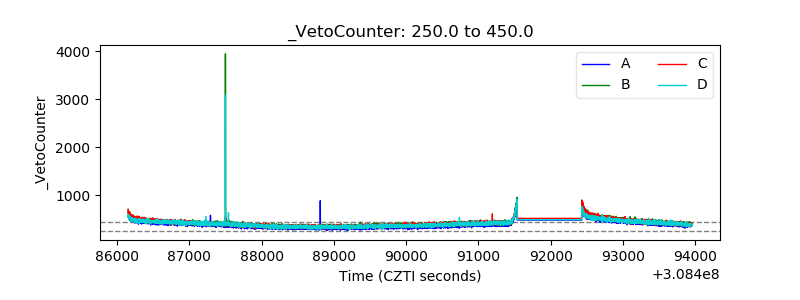 |