| Param | Original file | Final file |
|---|---|---|
| Filename | modeM0/AS1A07_004T01_9000003230_21826cztM0_level2.evt | modeM0/AS1A07_004T01_9000003230_21826cztM0_level2_quad_clean.evt |
| Size (bytes) | 452,203,200 | 94,127,040 |
| Size | 431.3 MB | 89.8 MB |
| Events in quadrant A | 3,134,005 | 618,462 |
| Events in quadrant B | 3,572,267 | 632,110 |
| Events in quadrant C | 3,110,973 | 598,063 |
| Events in quadrant D | 3,457,034 | 569,625 |
| Mode SS | |||
|---|---|---|---|
| Quadrant | BADHDUFLAG | Total packets | Discarded packets |
| A | 0 | 124 | 0 |
| B | 0 | 124 | 0 |
| C | 0 | 124 | 0 |
| D | 0 | 124 | 0 |
| Mode M0 | |||
|---|---|---|---|
| Quadrant | BADHDUFLAG | Total packets | Discarded packets |
| A | 0 | 13272 | 2 |
| B | 0 | 14593 | 2 |
| C | 0 | 13114 | 2 |
| D | 0 | 14477 | 2 |
| Mode M9 | |||
|---|---|---|---|
| Quadrant | BADHDUFLAG | Total packets | Discarded packets |
| A | 0 | 20 | 0 |
| B | 0 | 21 | 0 |
| C | 0 | 21 | 0 |
| D | 0 | 21 | 0 |
| Quadrant | Total seconds | Saturated seconds | Saturation percentage |
|---|---|---|---|
| A | 6202 | 42 | 0.677201% |
| B | 6202 | 97 | 1.564012% |
| C | 6202 | 70 | 1.128668% |
| D | 6202 | 83 | 1.338278% |
Noise dominated data is calculated using 1-second bins in cleaned event files. If a bin has >2000 counts, and if more than 50% of those come from <1% of pixels, then it is considered to be noise-dominated and hence unusable.
| Quadrant | # 1 sec bins | Bins with >0 counts | Bins with >2000 counts | High rate bins dominated by noise | Noise dominated (total time) | Noise dominated (detector-on time) | Marked lightcurve |
|---|---|---|---|---|---|---|---|
| A | 7477 | 6203 | 0 | 0 | 0.00% | 0.00% | 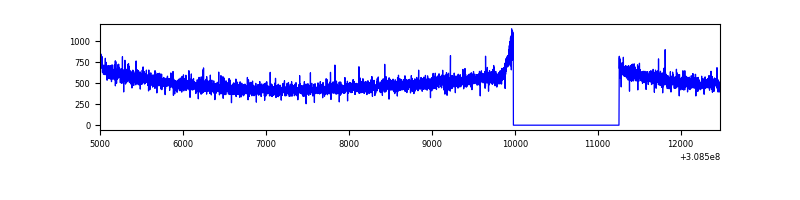 |
| B | 7477 | 6203 | 33 | 33 | 0.44% | 0.53% | 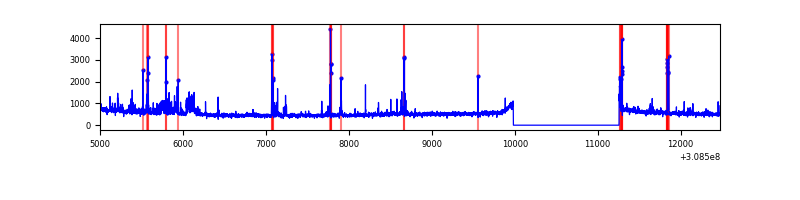 |
| C | 7477 | 6202 | 1 | 1 | 0.01% | 0.02% | 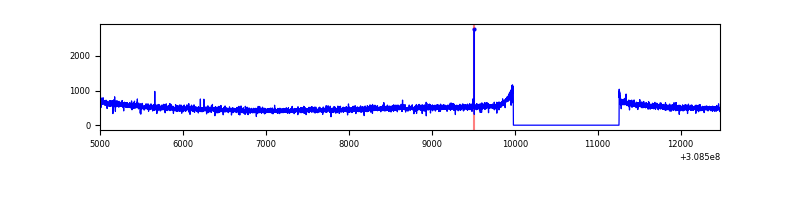 |
| D | 7477 | 6203 | 51 | 51 | 0.68% | 0.82% | 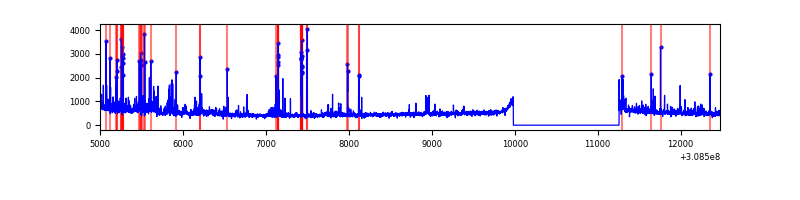 |
Top three noisy pixels from each quadrant. If the there are fewer than three noisy pixels in the level2.evt file, extra rows are filled as -1
| Pixel properties | Quadrant properties | ||||||
|---|---|---|---|---|---|---|---|
| Quadrant | DetID | PixID | Counts | Sigma | Mean | Median | Sigma |
| A | 13 | 252 | 14250 | 82.94 | 807 | 793 | 162.3 |
| A | 13 | 254 | 11933 | 68.66 | 807 | 793 | 162.3 |
| A | 0 | 226 | 7224 | 39.63 | 807 | 793 | 162.3 |
| B | 0 | 245 | 201984 | 1333.02 | 808 | 792 | 150.9 |
| B | 3 | 64 | 100847 | 662.92 | 808 | 792 | 150.9 |
| B | 5 | 172 | 57900 | 378.37 | 808 | 792 | 150.9 |
| C | 14 | 238 | 121444 | 674.93 | 765 | 772 | 178.8 |
| C | 13 | 61 | 5609 | 27.05 | 765 | 772 | 178.8 |
| C | 10 | 23 | 3537 | 15.46 | 765 | 772 | 178.8 |
| D | 1 | 52 | 373744 | 2030.13 | 763 | 738 | 183.7 |
| D | 13 | 172 | 45888 | 245.73 | 763 | 738 | 183.7 |
| D | 15 | 145 | 32976 | 175.46 | 763 | 738 | 183.7 |
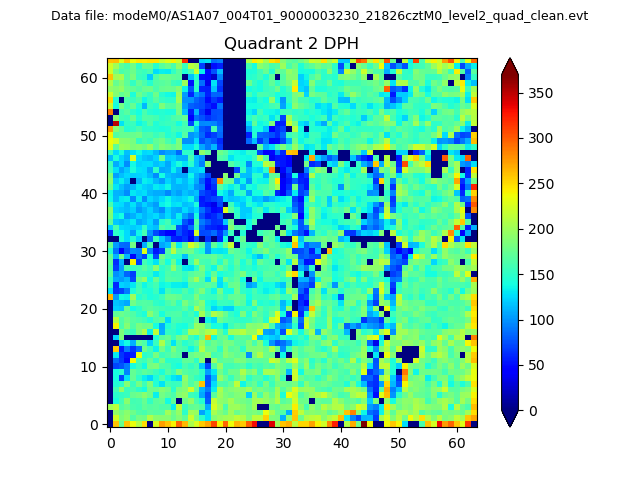
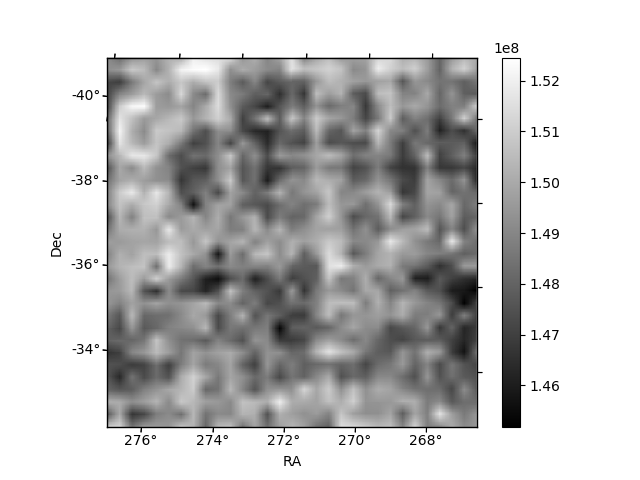
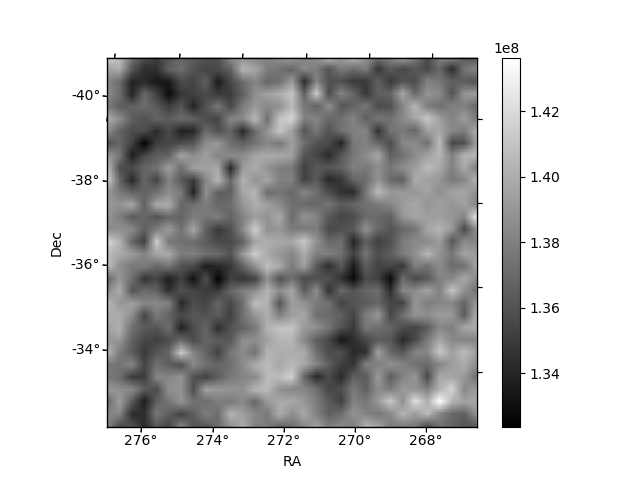
Histogram calculated using DETX and DETY for each event in the final _common_clean file
| Quadrant A |  |
 |
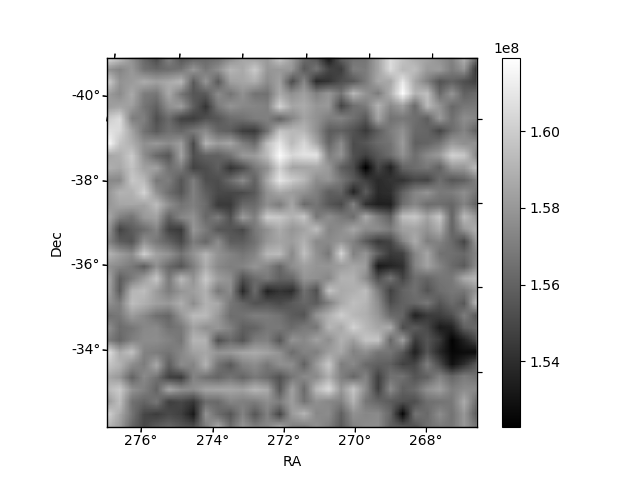
Quadrant B |
|---|---|---|---|
| Quadrant D | 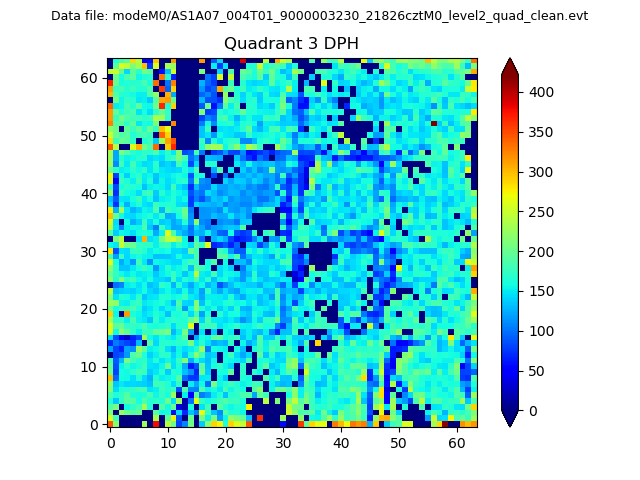 |
 |
Quadrant C |
| Plot type | Count rate plots | Images |
|---|---|---|
| Comparison with Poisson distribution Blue bars denote a histogram of data divided into 1 sec bins. Red curve is a Poisson curve with rate = median count rate of data. |
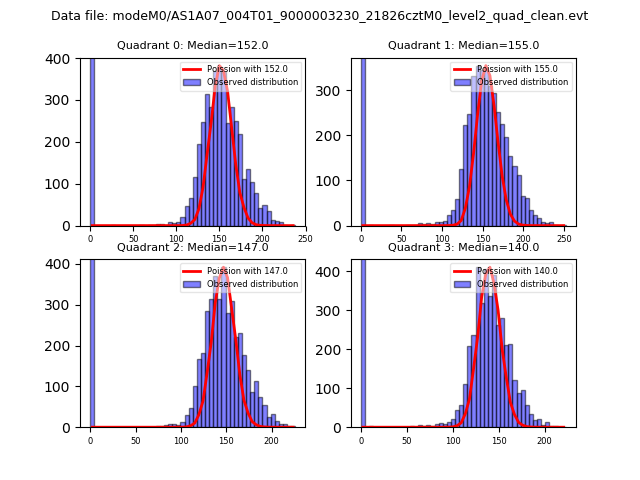 |
 |
| Quadrant-wise count rates Data is divided into 100 sec bins |
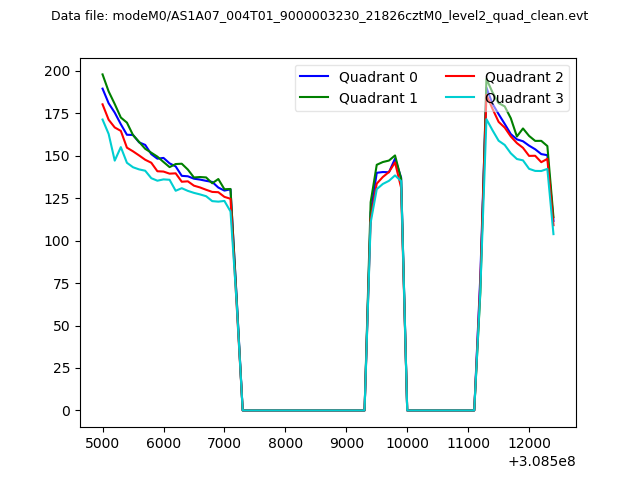 |
|
| Module-wise count rates for Quadrant A Data is divided into 100 sec bins |
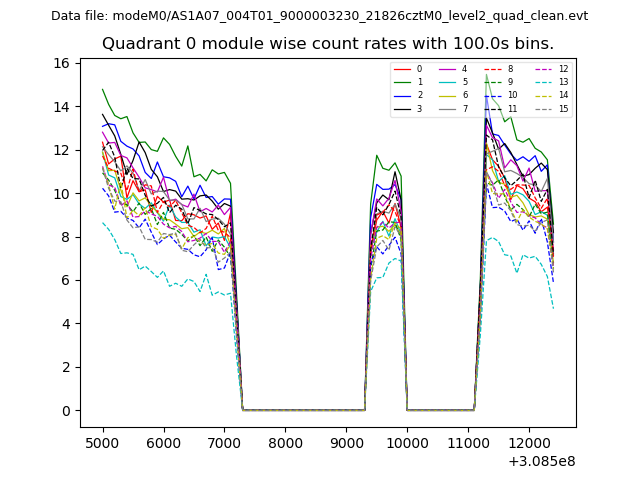 |
 |
| Module-wise count rates for Quadrant B Data is divided into 100 sec bins |
 |
 |
| Module-wise count rates for Quadrant C Data is divided into 100 sec bins |
 |
 |
| Module-wise count rates for Quadrant D Data is divided into 100 sec bins |
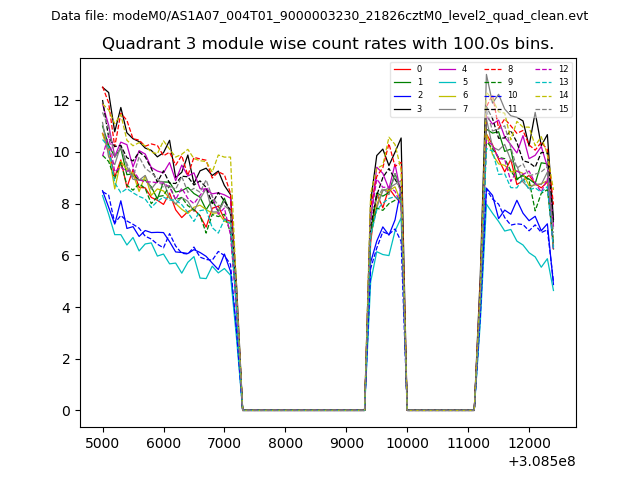 |
 |
| Parameter | Plot |
|---|---|
| CZT HV Monitor | 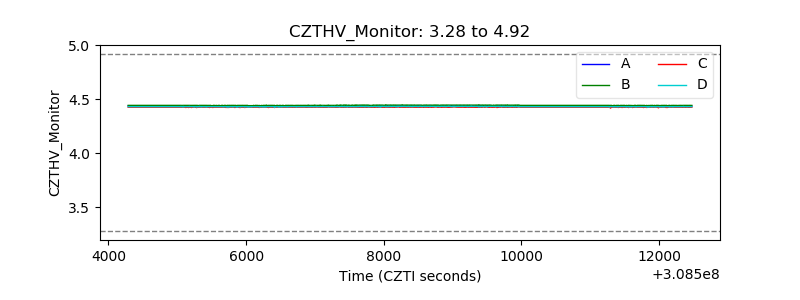 |
| D_VDD | 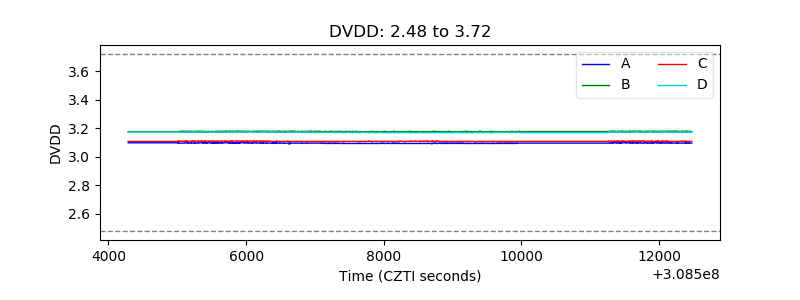 |
| Temperature 1 | 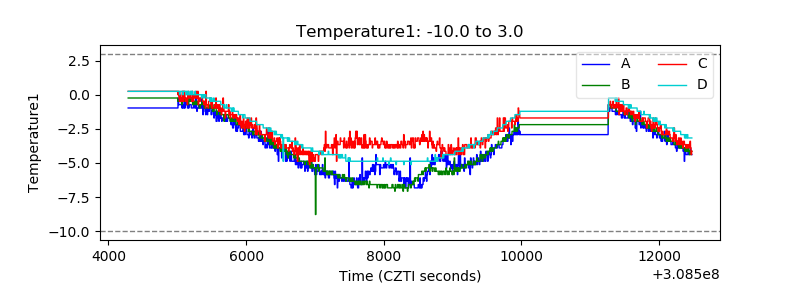 |
| Veto HV Monitor | 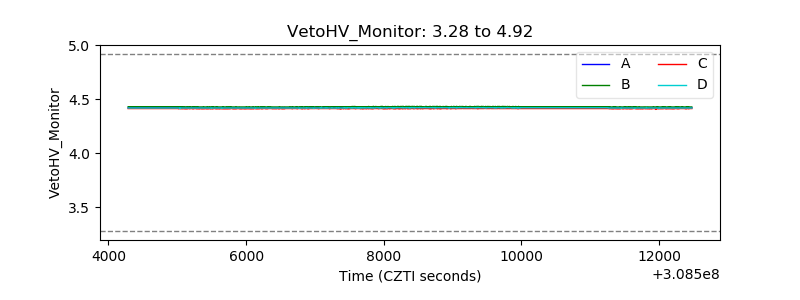 |
| Veto LLD | 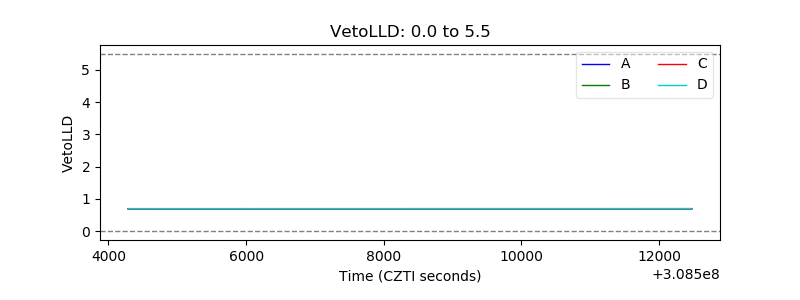 |
| Alpha Counter | 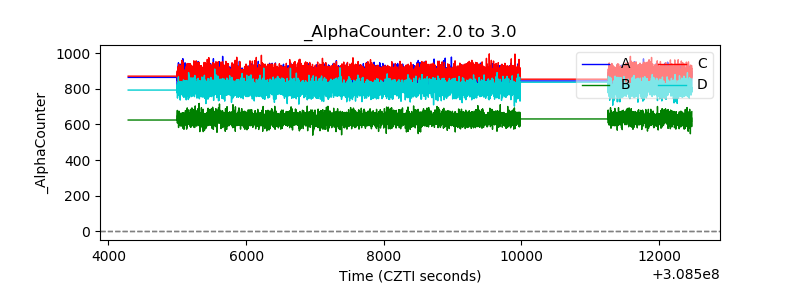 |
| _CPM_Rate | 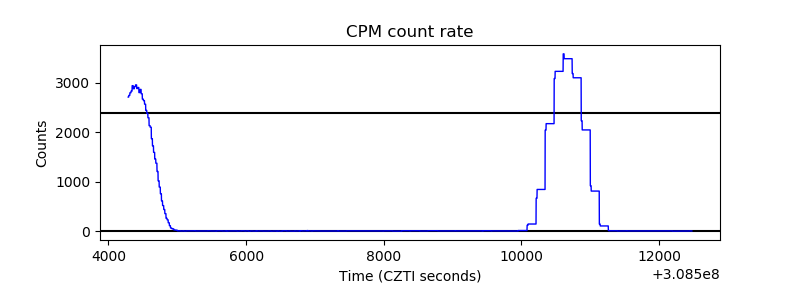 |
| CZT Counter | 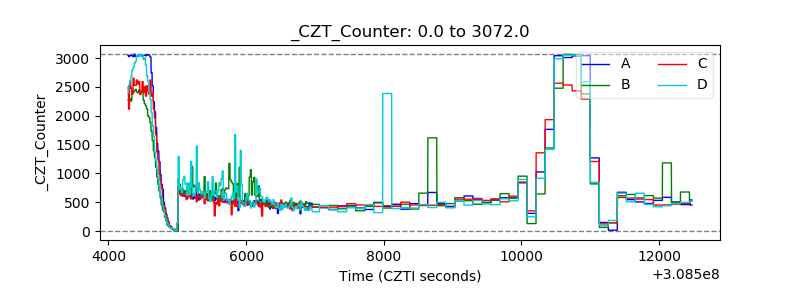 |
| +2.5 Volts monitor |  |
| +5 Volts monitor | 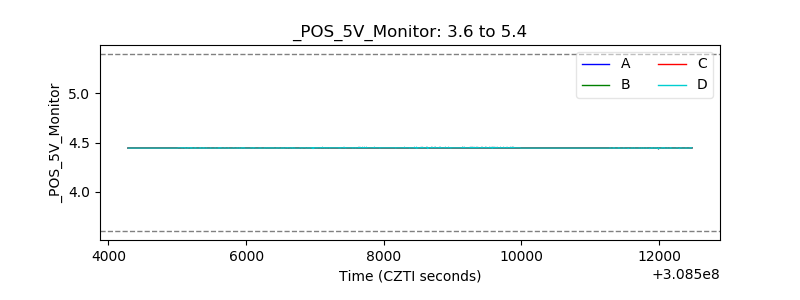 |
| _ROLL_ROT | 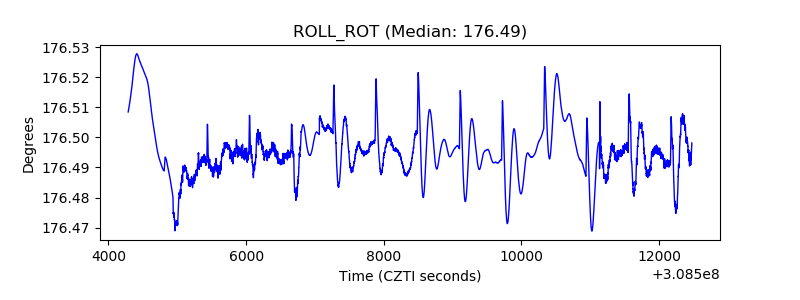 |
| _Roll_DEC | 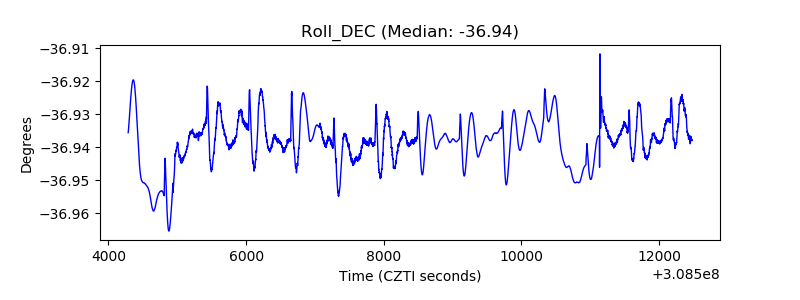 |
| _Roll_RA | 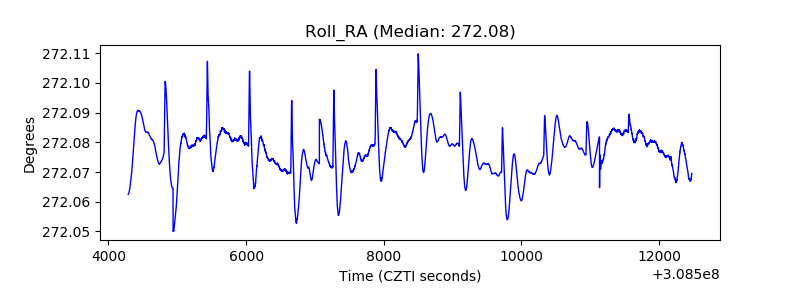 |
| Veto Counter | 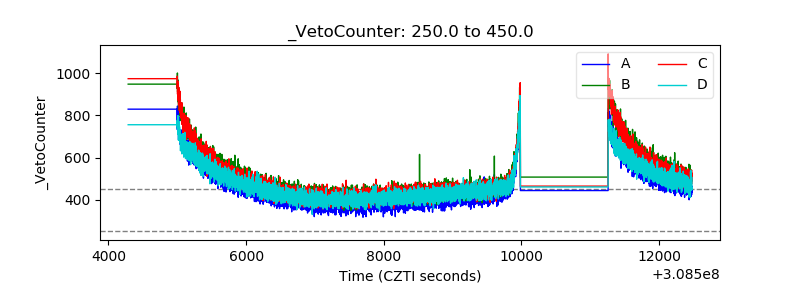 |