| Param | Original file | Final file |
|---|---|---|
| Filename | modeM0/AS1A07_004T01_9000003230_21827cztM0_level2.evt | modeM0/AS1A07_004T01_9000003230_21827cztM0_level2_quad_clean.evt |
| Size (bytes) | 475,061,760 | 95,400,000 |
| Size | 453.1 MB | 91.0 MB |
| Events in quadrant A | 3,171,583 | 630,341 |
| Events in quadrant B | 3,473,239 | 651,280 |
| Events in quadrant C | 3,182,961 | 617,864 |
| Events in quadrant D | 4,137,654 | 555,905 |
| Mode SS | |||
|---|---|---|---|
| Quadrant | BADHDUFLAG | Total packets | Discarded packets |
| A | 0 | 126 | 0 |
| B | 0 | 126 | 0 |
| C | 0 | 126 | 0 |
| D | 0 | 126 | 0 |
| Mode M0 | |||
|---|---|---|---|
| Quadrant | BADHDUFLAG | Total packets | Discarded packets |
| A | 0 | 13251 | 2 |
| B | 0 | 14061 | 2 |
| C | 0 | 13194 | 2 |
| D | 0 | 16340 | 2 |
| Mode M9 | |||
|---|---|---|---|
| Quadrant | BADHDUFLAG | Total packets | Discarded packets |
| A | 0 | 15 | 0 |
| B | 0 | 16 | 0 |
| C | 0 | 16 | 0 |
| D | 0 | 16 | 0 |
| Quadrant | Total seconds | Saturated seconds | Saturation percentage |
|---|---|---|---|
| A | 6214 | 46 | 0.740264% |
| B | 6214 | 107 | 1.721918% |
| C | 6214 | 86 | 1.383972% |
| D | 6214 | 355 | 5.712906% |
Noise dominated data is calculated using 1-second bins in cleaned event files. If a bin has >2000 counts, and if more than 50% of those come from <1% of pixels, then it is considered to be noise-dominated and hence unusable.
| Quadrant | # 1 sec bins | Bins with >0 counts | Bins with >2000 counts | High rate bins dominated by noise | Noise dominated (total time) | Noise dominated (detector-on time) | Marked lightcurve |
|---|---|---|---|---|---|---|---|
| A | 7524 | 6215 | 0 | 0 | 0.00% | 0.00% | 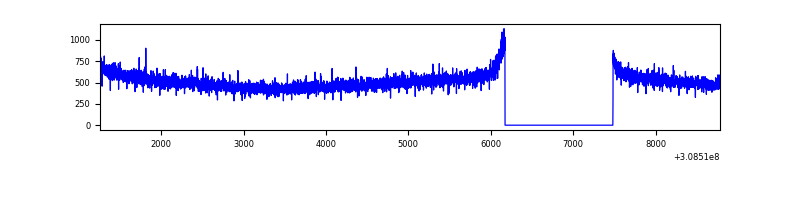 |
| B | 7524 | 6215 | 29 | 29 | 0.39% | 0.47% | 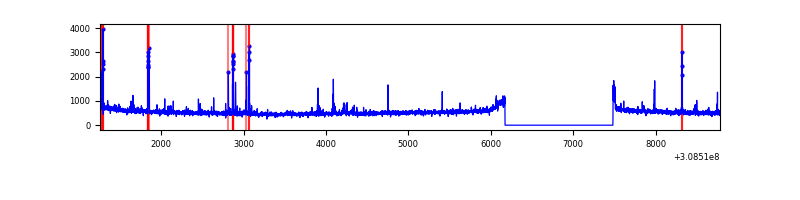 |
| C | 7524 | 6215 | 0 | 0 | 0.00% | 0.00% | 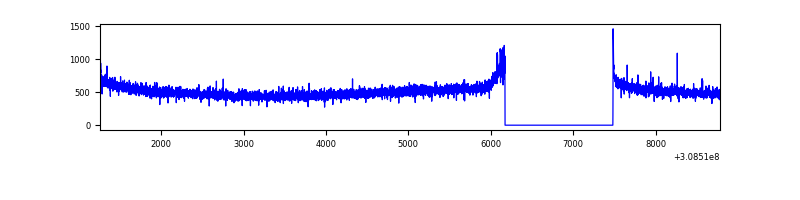 |
| D | 7524 | 6215 | 277 | 277 | 3.68% | 4.46% | 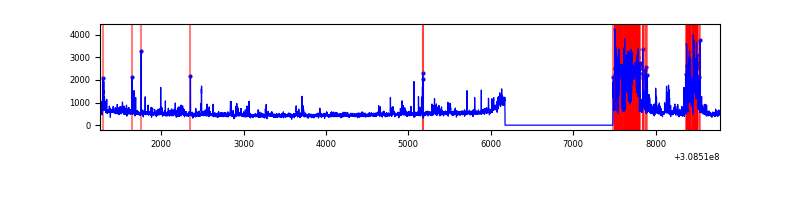 |
Top three noisy pixels from each quadrant. If the there are fewer than three noisy pixels in the level2.evt file, extra rows are filled as -1
| Pixel properties | Quadrant properties | ||||||
|---|---|---|---|---|---|---|---|
| Quadrant | DetID | PixID | Counts | Sigma | Mean | Median | Sigma |
| A | 13 | 254 | 12039 | 67.75 | 818 | 805 | 165.8 |
| A | 0 | 226 | 7499 | 40.37 | 818 | 805 | 165.8 |
| A | 3 | 137 | 6390 | 33.68 | 818 | 805 | 165.8 |
| B | 3 | 64 | 101065 | 651.63 | 824 | 807 | 153.9 |
| B | 5 | 172 | 52052 | 333.07 | 824 | 807 | 153.9 |
| B | 0 | 190 | 23335 | 146.42 | 824 | 807 | 153.9 |
| C | 14 | 238 | 123480 | 673.87 | 781 | 789 | 182.1 |
| C | 5 | 112 | 7046 | 34.37 | 781 | 789 | 182.1 |
| C | 0 | 10 | 6920 | 33.67 | 781 | 789 | 182.1 |
| D | 13 | 104 | 529212 | 2874.84 | 757 | 735 | 183.8 |
| D | 1 | 52 | 367680 | 1996.13 | 757 | 735 | 183.8 |
| D | 7 | 38 | 235895 | 1279.24 | 757 | 735 | 183.8 |
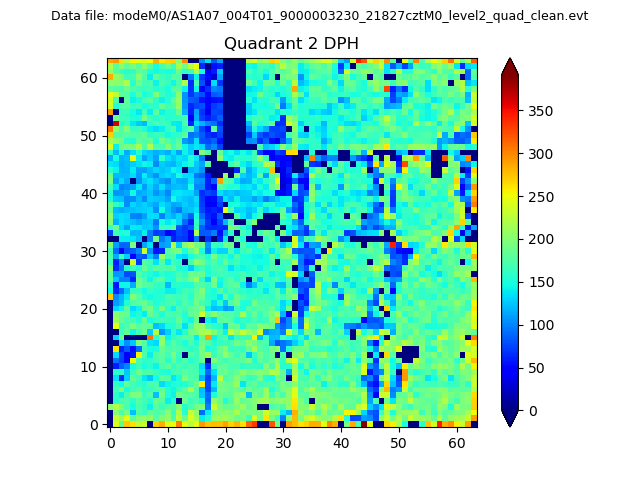
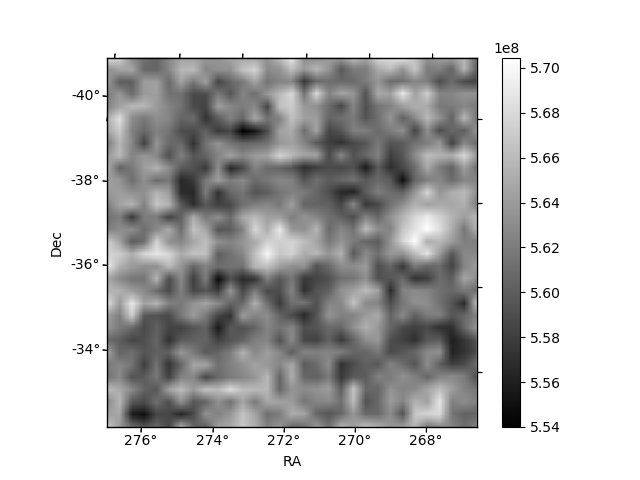
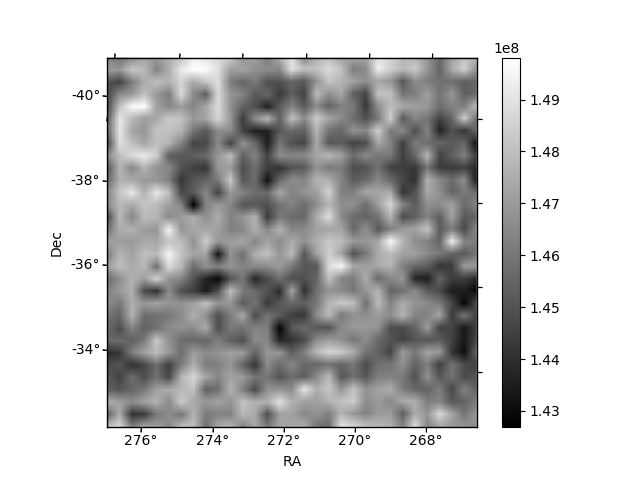
Histogram calculated using DETX and DETY for each event in the final _common_clean file
| Quadrant A | 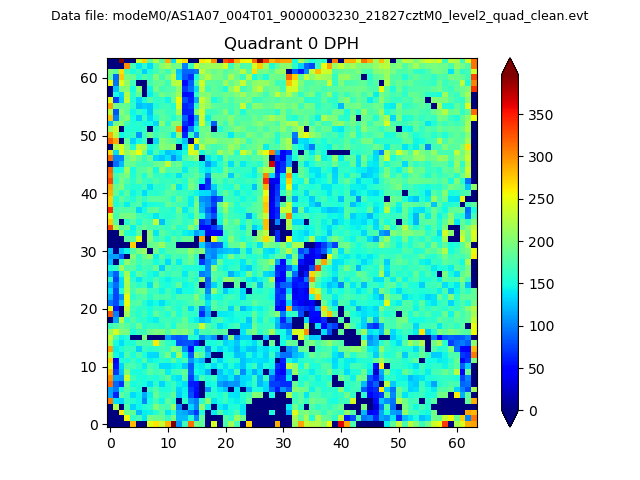 |
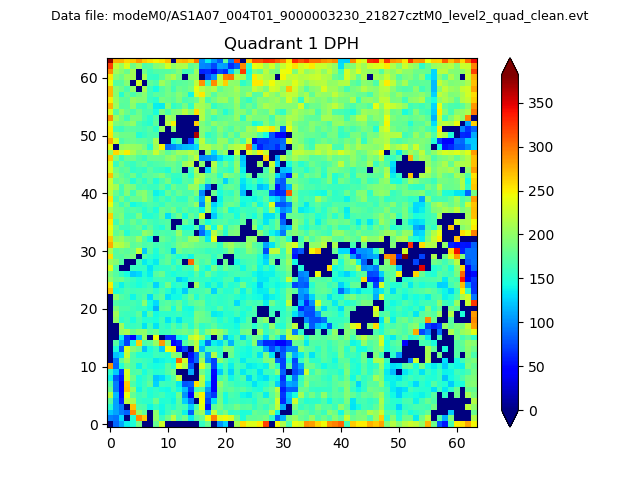 |
Quadrant B |
|---|---|---|---|
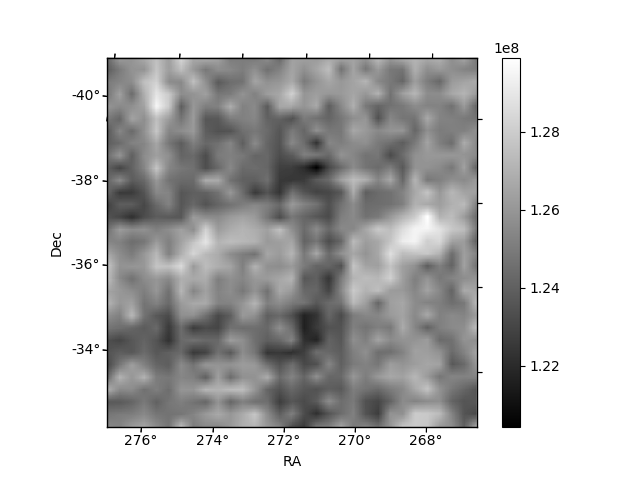
| Quadrant D | 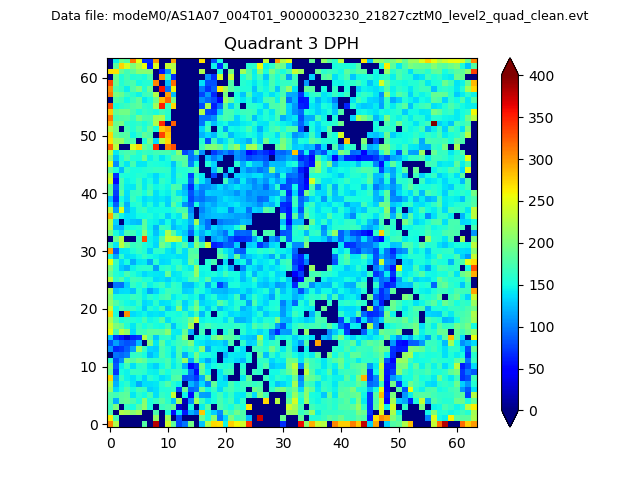 |
 |
Quadrant C |
| Plot type | Count rate plots | Images |
|---|---|---|
| Comparison with Poisson distribution Blue bars denote a histogram of data divided into 1 sec bins. Red curve is a Poisson curve with rate = median count rate of data. |
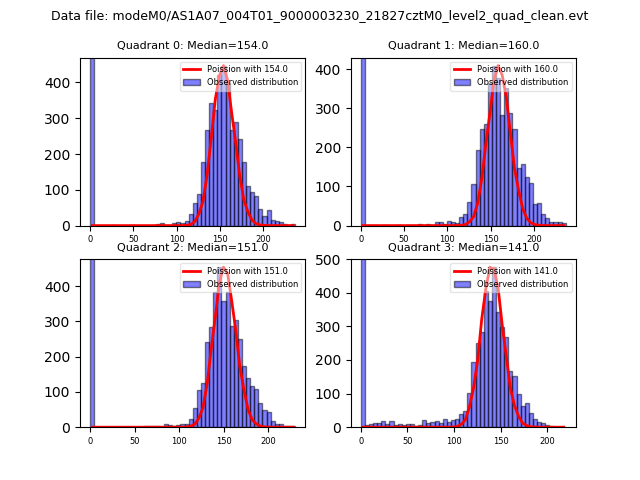 |
 |
| Quadrant-wise count rates Data is divided into 100 sec bins |
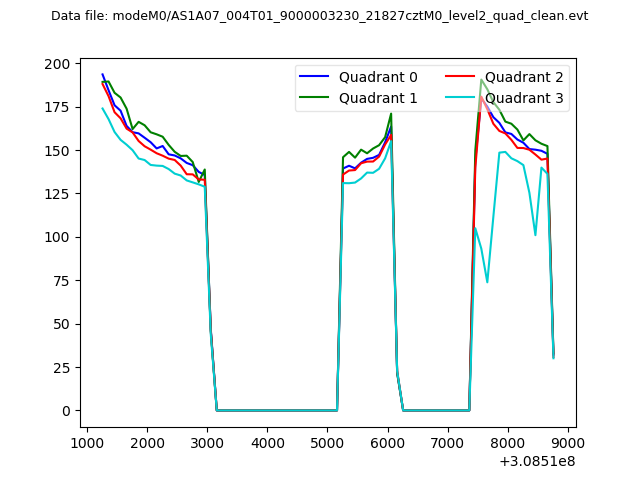 |
|
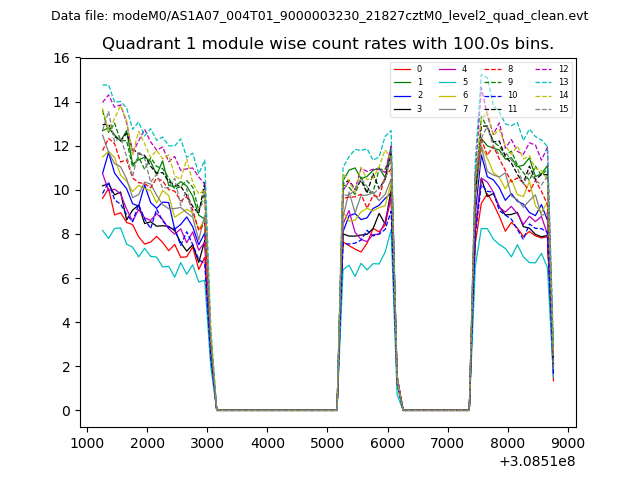
| Module-wise count rates for Quadrant A Data is divided into 100 sec bins |
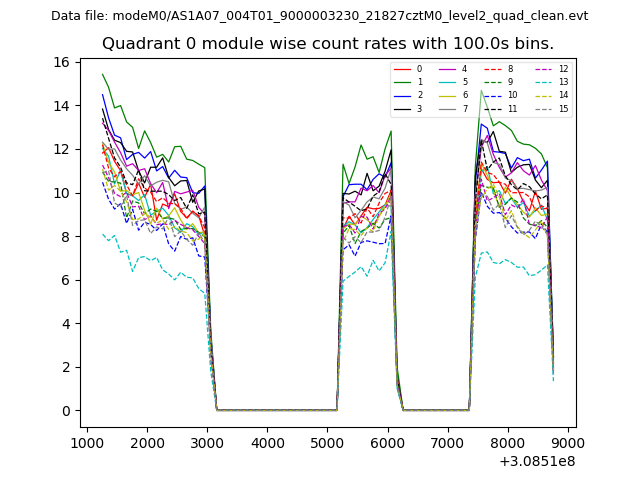 |
 |
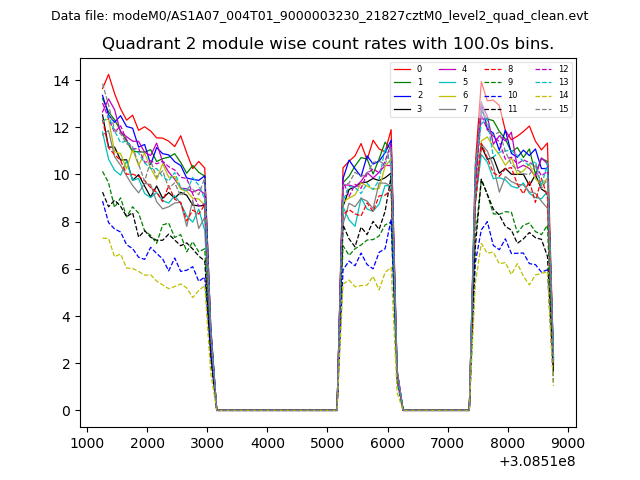
| Module-wise count rates for Quadrant B Data is divided into 100 sec bins |
 |
 |
| Module-wise count rates for Quadrant C Data is divided into 100 sec bins |
 |
 |
| Module-wise count rates for Quadrant D Data is divided into 100 sec bins |
 |
 |
| Parameter | Plot |
|---|---|
| CZT HV Monitor | 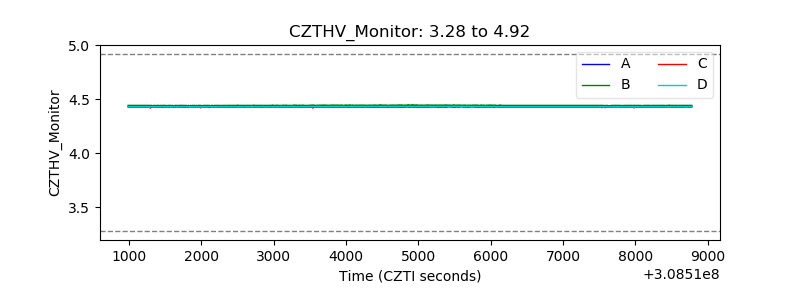 |
| D_VDD | 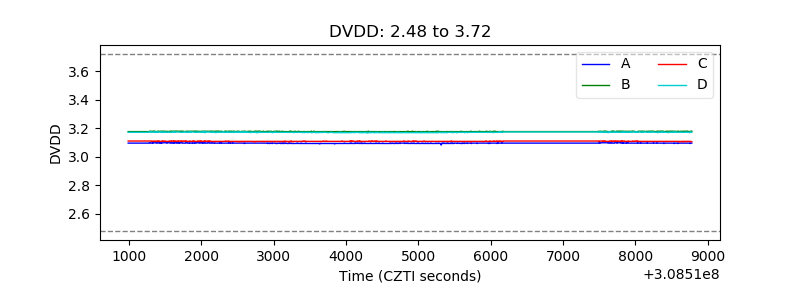 |
| Temperature 1 | 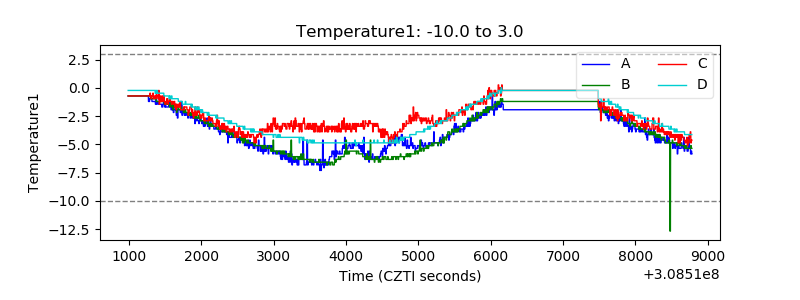 |
| Veto HV Monitor | 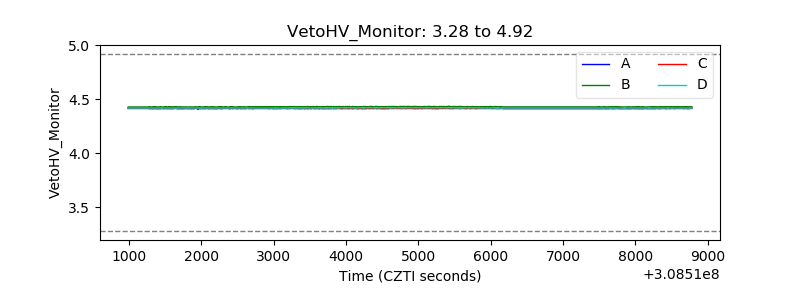 |
| Veto LLD | 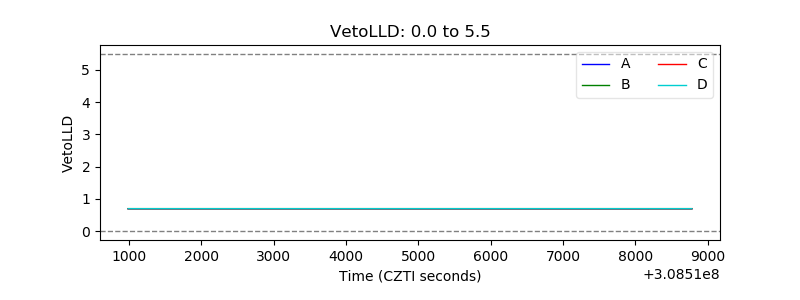 |
| Alpha Counter | 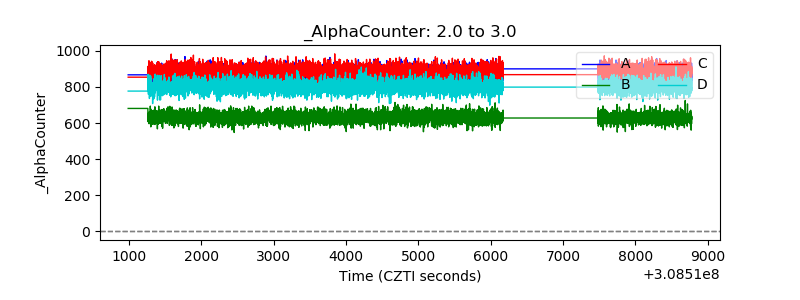 |
| _CPM_Rate | 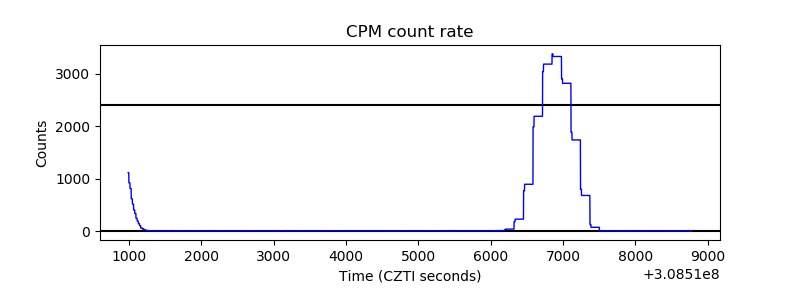 |
| CZT Counter | 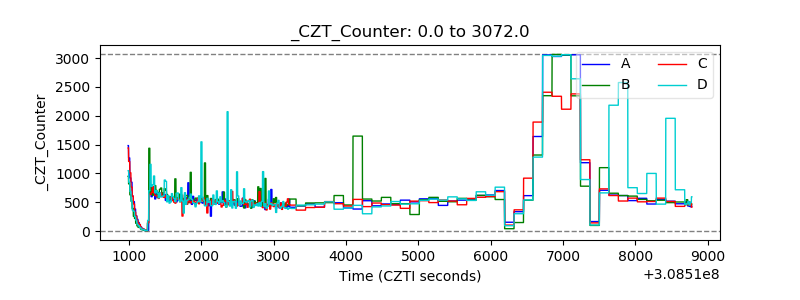 |
| +2.5 Volts monitor |  |
| +5 Volts monitor |  |
| _ROLL_ROT | 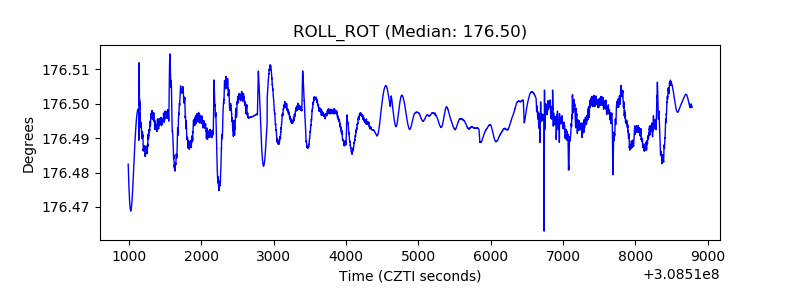 |
| _Roll_DEC | 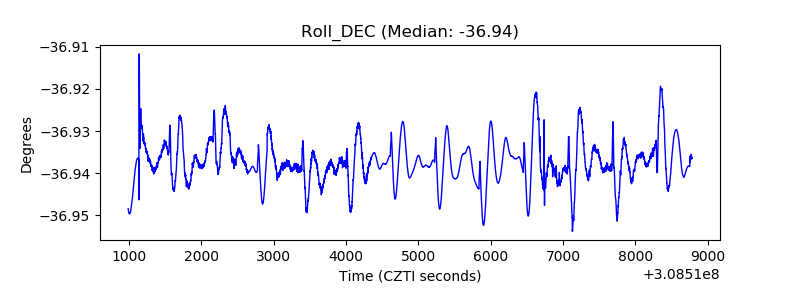 |
| _Roll_RA | 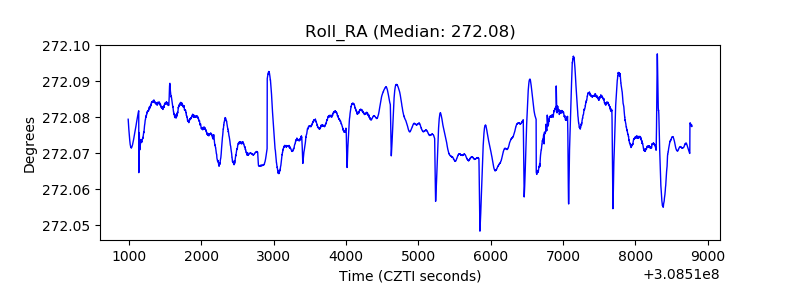 |
| Veto Counter | 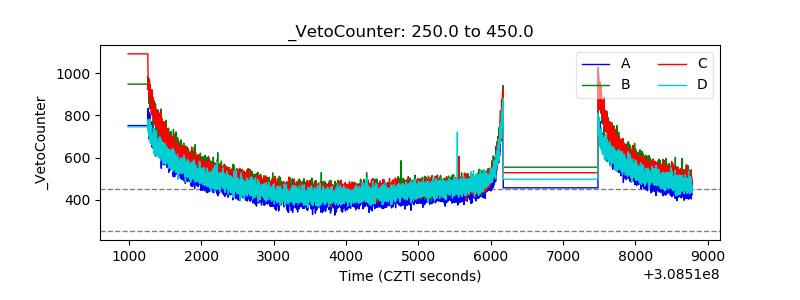 |