| Param | Original file | Final file |
|---|---|---|
| Filename | modeM0/AS1A07_004T01_9000003230_21829cztM0_level2.evt | modeM0/AS1A07_004T01_9000003230_21829cztM0_level2_quad_clean.evt |
| Size (bytes) | 450,270,720 | 81,630,720 |
| Size | 429.4 MB | 77.8 MB |
| Events in quadrant A | 3,121,447 | 511,946 |
| Events in quadrant B | 3,502,971 | 527,367 |
| Events in quadrant C | 3,172,801 | 506,446 |
| Events in quadrant D | 3,404,134 | 479,321 |
| Mode SS | |||
|---|---|---|---|
| Quadrant | BADHDUFLAG | Total packets | Discarded packets |
| A | 0 | 130 | 0 |
| B | 0 | 130 | 0 |
| C | 0 | 130 | 0 |
| D | 0 | 130 | 0 |
| Mode M0 | |||
|---|---|---|---|
| Quadrant | BADHDUFLAG | Total packets | Discarded packets |
| A | 0 | 13231 | 2 |
| B | 0 | 14314 | 2 |
| C | 0 | 13238 | 2 |
| D | 0 | 14349 | 2 |
| Mode M9 | |||
|---|---|---|---|
| Quadrant | BADHDUFLAG | Total packets | Discarded packets |
| A | 0 | 23 | 0 |
| B | 0 | 24 | 0 |
| C | 0 | 24 | 0 |
| D | 0 | 24 | 0 |
| Quadrant | Total seconds | Saturated seconds | Saturation percentage |
|---|---|---|---|
| A | 6403 | 28 | 0.437295% |
| B | 6403 | 107 | 1.671092% |
| C | 6403 | 61 | 0.952678% |
| D | 6403 | 55 | 0.858972% |
Noise dominated data is calculated using 1-second bins in cleaned event files. If a bin has >2000 counts, and if more than 50% of those come from <1% of pixels, then it is considered to be noise-dominated and hence unusable.
| Quadrant | # 1 sec bins | Bins with >0 counts | Bins with >2000 counts | High rate bins dominated by noise | Noise dominated (total time) | Noise dominated (detector-on time) | Marked lightcurve |
|---|---|---|---|---|---|---|---|
| A | 7623 | 6404 | 0 | 0 | 0.00% | 0.00% | 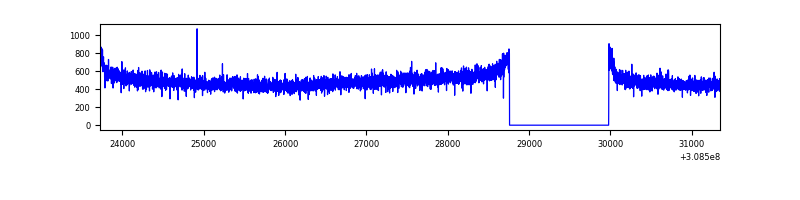 |
| B | 7623 | 6404 | 52 | 52 | 0.68% | 0.81% | 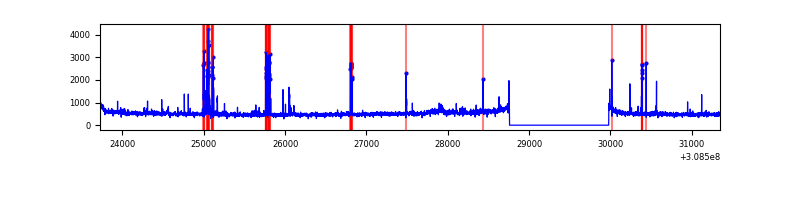 |
| C | 7623 | 6404 | 0 | 0 | 0.00% | 0.00% | 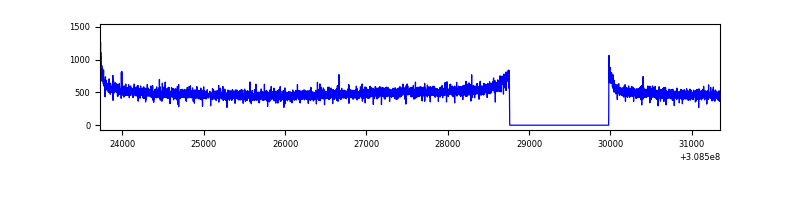 |
| D | 7623 | 6404 | 30 | 30 | 0.39% | 0.47% | 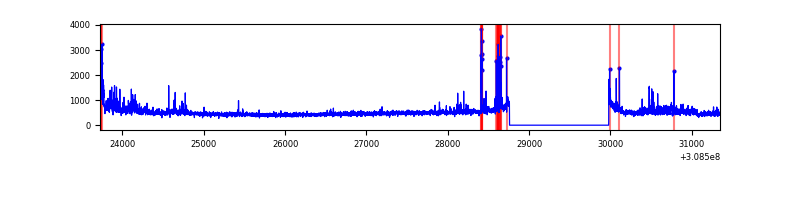 |
Top three noisy pixels from each quadrant. If the there are fewer than three noisy pixels in the level2.evt file, extra rows are filled as -1
| Pixel properties | Quadrant properties | ||||||
|---|---|---|---|---|---|---|---|
| Quadrant | DetID | PixID | Counts | Sigma | Mean | Median | Sigma |
| A | 13 | 254 | 12280 | 71.09 | 809 | 794 | 161.6 |
| A | 0 | 226 | 6979 | 38.28 | 809 | 794 | 161.6 |
| A | 3 | 137 | 6554 | 35.65 | 809 | 794 | 161.6 |
| B | 3 | 64 | 232084 | 1510.77 | 815 | 797 | 153.1 |
| B | 0 | 230 | 27781 | 176.26 | 815 | 797 | 153.1 |
| B | 12 | 111 | 17787 | 110.98 | 815 | 797 | 153.1 |
| C | 14 | 238 | 123285 | 678.3 | 779 | 784 | 180.6 |
| C | 0 | 10 | 7061 | 34.76 | 779 | 784 | 180.6 |
| C | 13 | 61 | 5512 | 26.18 | 779 | 784 | 180.6 |
| D | 1 | 52 | 210675 | 1117.15 | 778 | 755 | 187.9 |
| D | 5 | 32 | 65591 | 345.04 | 778 | 755 | 187.9 |
| D | 12 | 238 | 42368 | 221.46 | 778 | 755 | 187.9 |
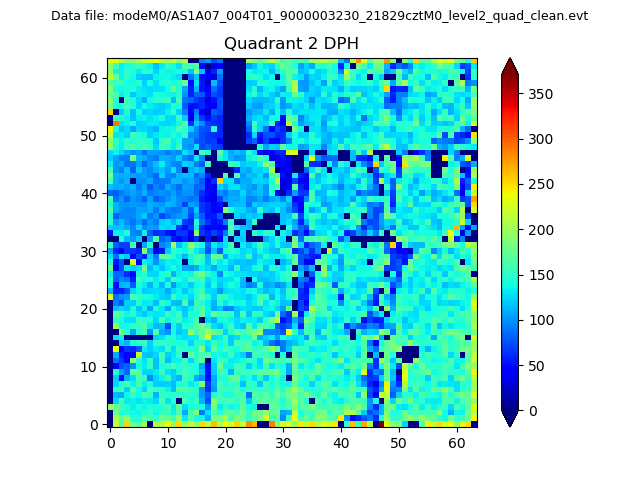
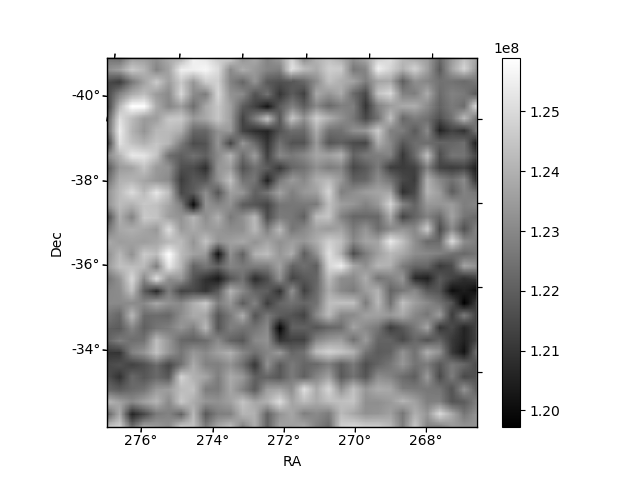
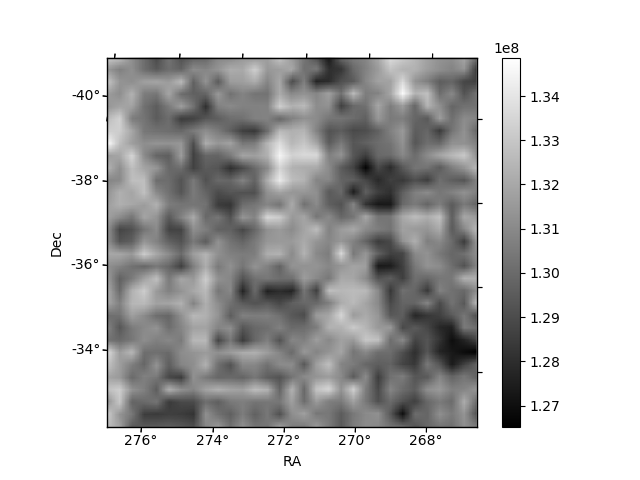
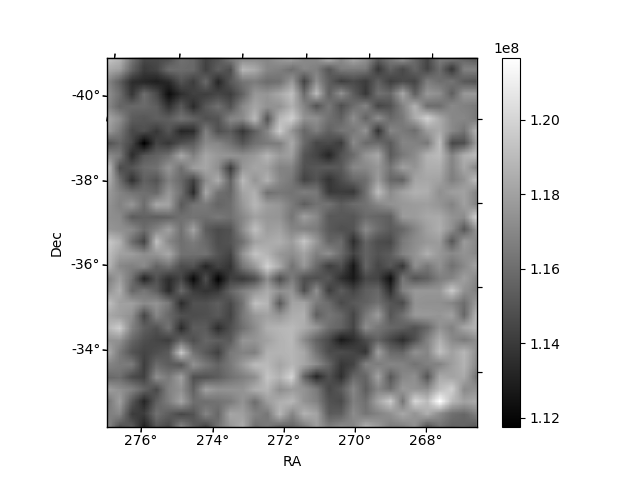
Histogram calculated using DETX and DETY for each event in the final _common_clean file
| Quadrant A |  |
 |
Quadrant B |
|---|---|---|---|
| Quadrant D | 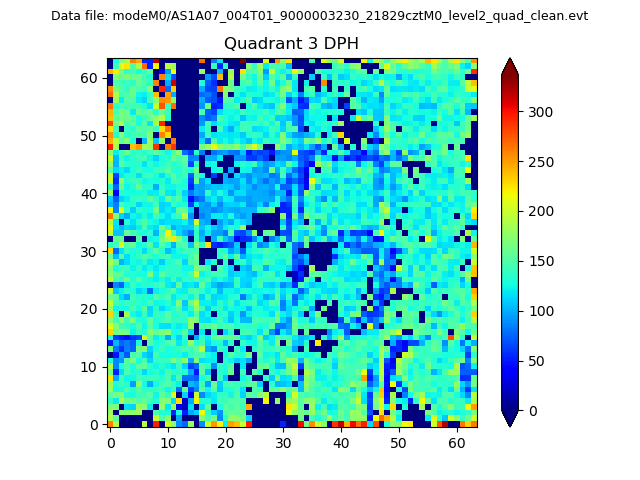 |
 |
Quadrant C |
| Plot type | Count rate plots | Images |
|---|---|---|
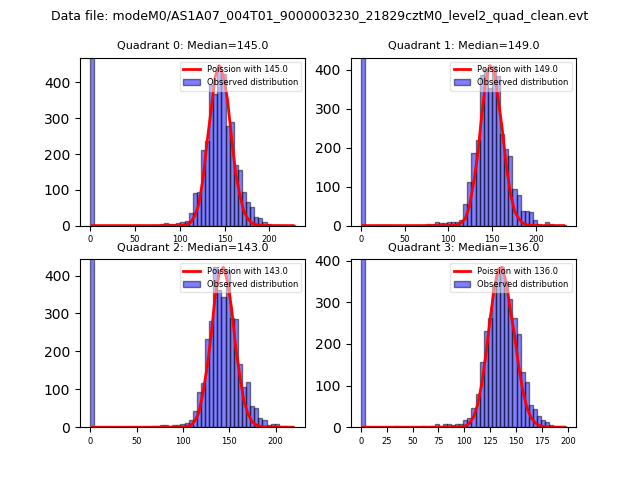
| Comparison with Poisson distribution Blue bars denote a histogram of data divided into 1 sec bins. Red curve is a Poisson curve with rate = median count rate of data. |
 |
 |
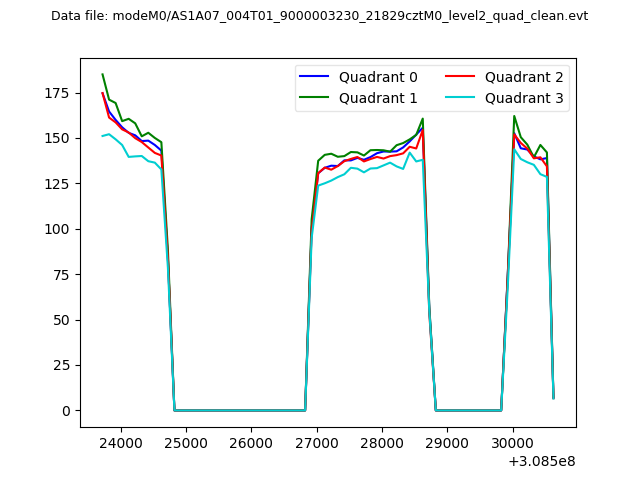
| Quadrant-wise count rates Data is divided into 100 sec bins |
 |
|
| Module-wise count rates for Quadrant A Data is divided into 100 sec bins |
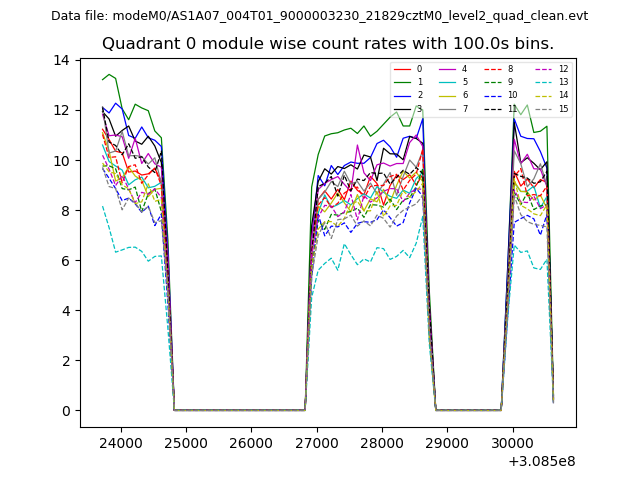 |
 |
| Module-wise count rates for Quadrant B Data is divided into 100 sec bins |
 |
 |
| Module-wise count rates for Quadrant C Data is divided into 100 sec bins |
 |
 |
| Module-wise count rates for Quadrant D Data is divided into 100 sec bins |
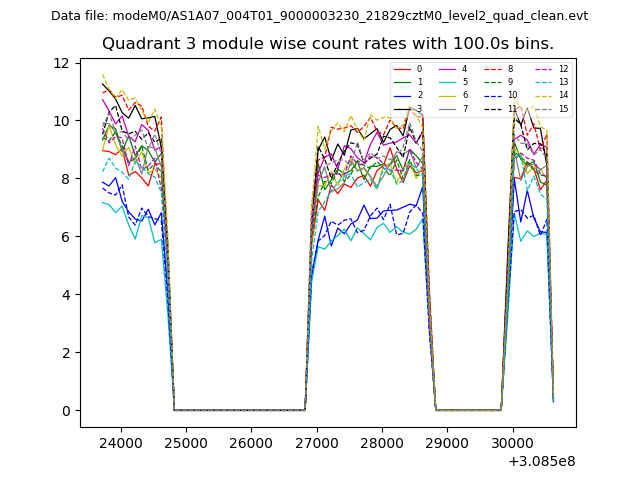 |
 |
| Parameter | Plot |
|---|---|
| CZT HV Monitor | 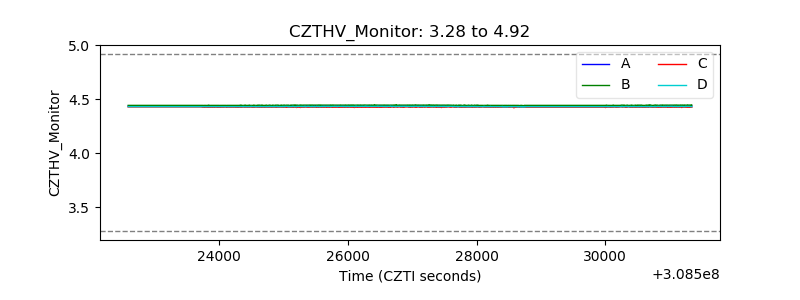 |
| D_VDD | 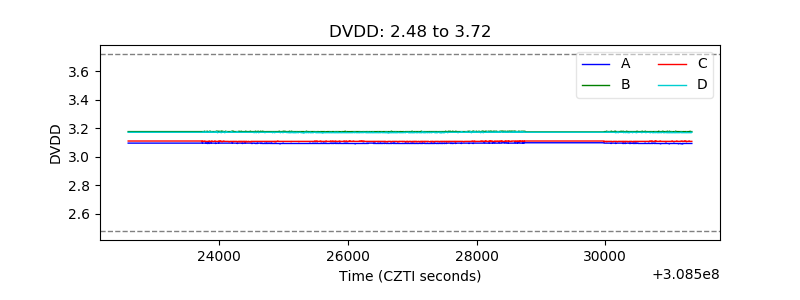 |
| Temperature 1 | 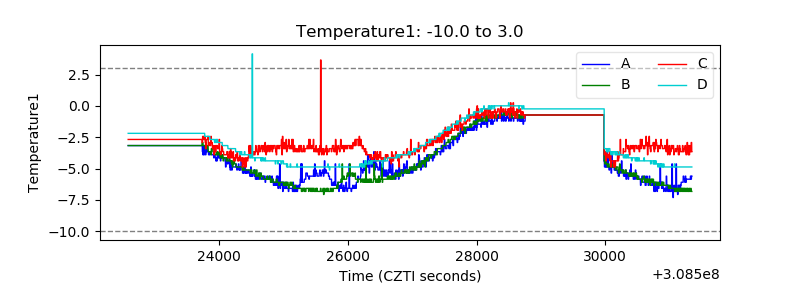 |
| Veto HV Monitor | 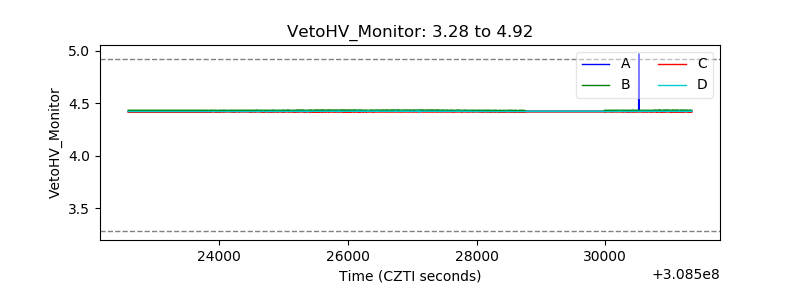 |
| Veto LLD | 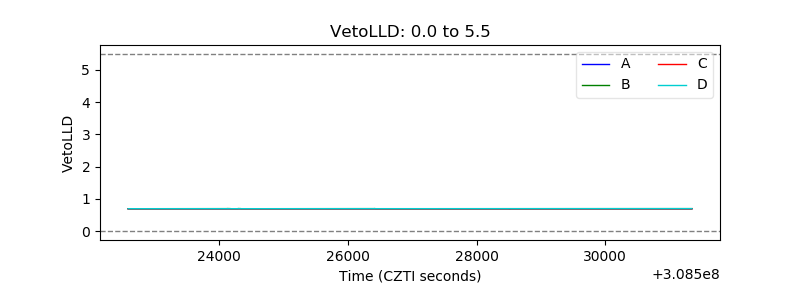 |
| Alpha Counter | 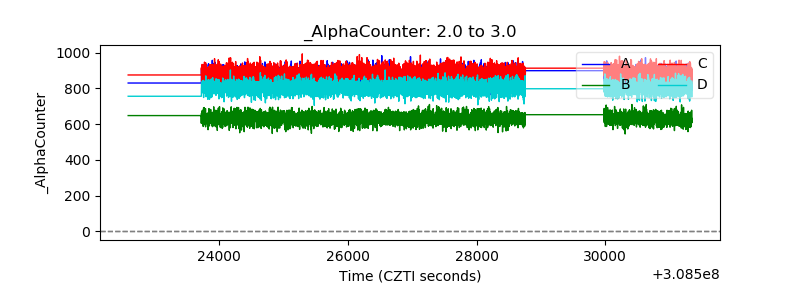 |
| _CPM_Rate | 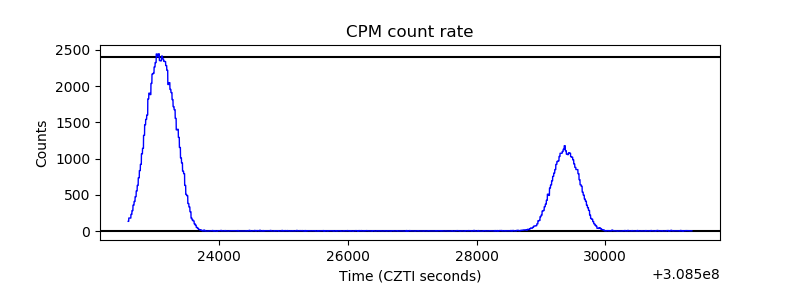 |
| CZT Counter | 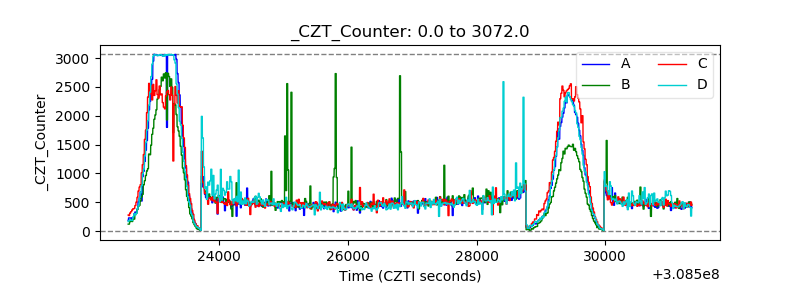 |
| +2.5 Volts monitor |  |
| +5 Volts monitor | 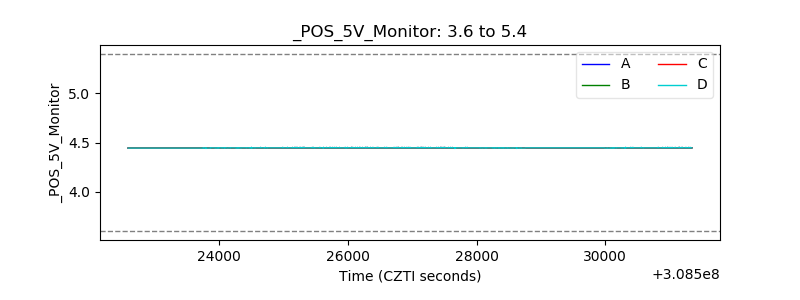 |
| _ROLL_ROT | 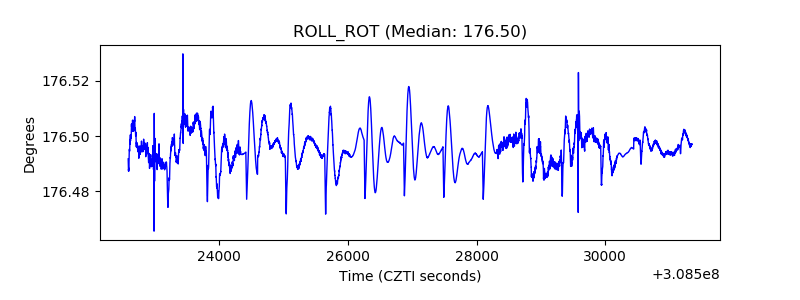 |
| _Roll_DEC | 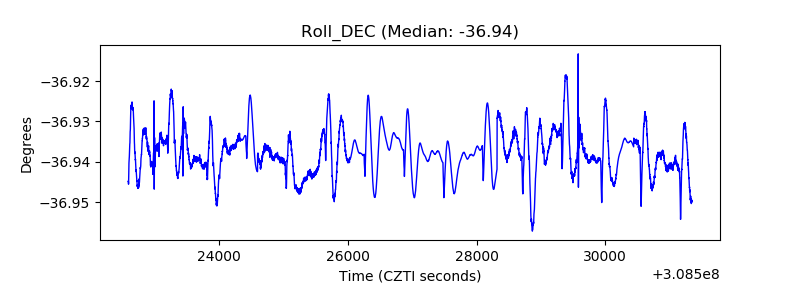 |
| _Roll_RA | 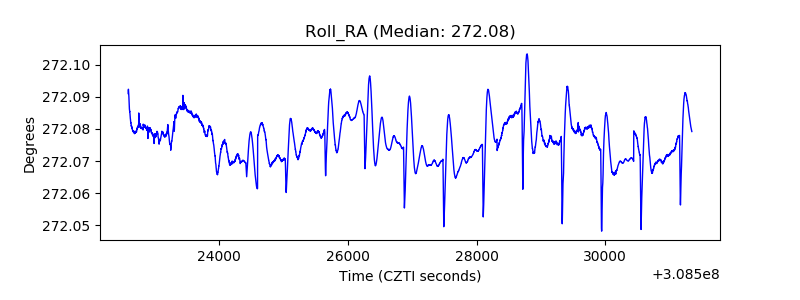 |
| Veto Counter | 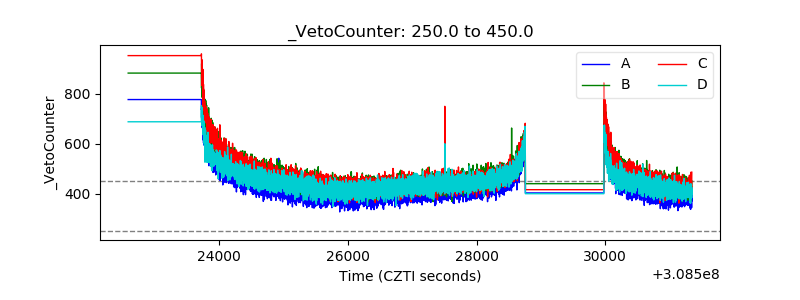 |