| Param | Original file | Final file |
|---|---|---|
| Filename | modeM0/AS1A07_004T01_9000003230_21830cztM0_level2.evt | modeM0/AS1A07_004T01_9000003230_21830cztM0_level2_quad_clean.evt |
| Size (bytes) | 496,987,200 | 76,639,680 |
| Size | 474.0 MB | 73.1 MB |
| Events in quadrant A | 3,277,547 | 464,499 |
| Events in quadrant B | 3,501,096 | 476,608 |
| Events in quadrant C | 3,334,402 | 459,573 |
| Events in quadrant D | 4,466,477 | 435,756 |
| Mode SS | |||
|---|---|---|---|
| Quadrant | BADHDUFLAG | Total packets | Discarded packets |
| A | 0 | 140 | 0 |
| B | 0 | 140 | 0 |
| C | 0 | 140 | 0 |
| D | 0 | 140 | 0 |
| Mode M0 | |||
|---|---|---|---|
| Quadrant | BADHDUFLAG | Total packets | Discarded packets |
| A | 0 | 14174 | 2 |
| B | 0 | 14632 | 2 |
| C | 0 | 14179 | 2 |
| D | 0 | 17941 | 2 |
| Mode M9 | |||
|---|---|---|---|
| Quadrant | BADHDUFLAG | Total packets | Discarded packets |
| A | 0 | 15 | 0 |
| B | 0 | 16 | 0 |
| C | 0 | 16 | 0 |
| D | 0 | 16 | 0 |
| Quadrant | Total seconds | Saturated seconds | Saturation percentage |
|---|---|---|---|
| A | 6953 | 10 | 0.143823% |
| B | 6953 | 42 | 0.604056% |
| C | 6953 | 43 | 0.618438% |
| D | 6953 | 161 | 2.315547% |
Noise dominated data is calculated using 1-second bins in cleaned event files. If a bin has >2000 counts, and if more than 50% of those come from <1% of pixels, then it is considered to be noise-dominated and hence unusable.
| Quadrant | # 1 sec bins | Bins with >0 counts | Bins with >2000 counts | High rate bins dominated by noise | Noise dominated (total time) | Noise dominated (detector-on time) | Marked lightcurve |
|---|---|---|---|---|---|---|---|
| A | 7903 | 6954 | 0 | 0 | 0.00% | 0.00% | 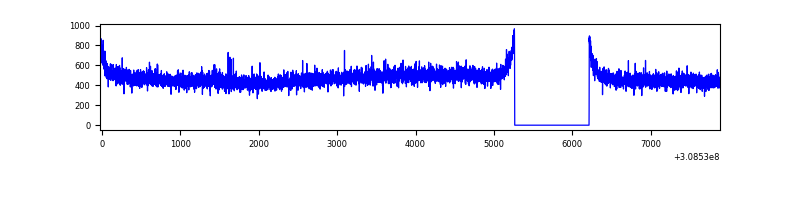 |
| B | 7903 | 6954 | 12 | 12 | 0.15% | 0.17% | 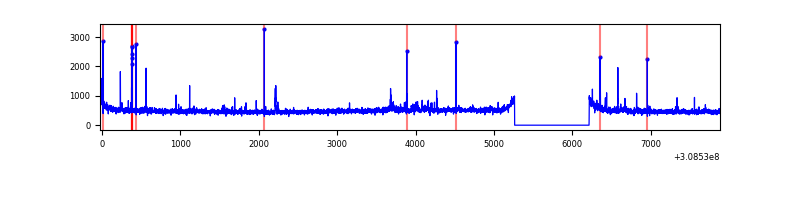 |
| C | 7903 | 6954 | 0 | 0 | 0.00% | 0.00% | 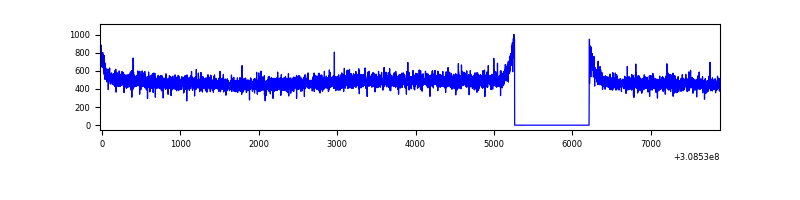 |
| D | 7903 | 6954 | 149 | 149 | 1.89% | 2.14% | 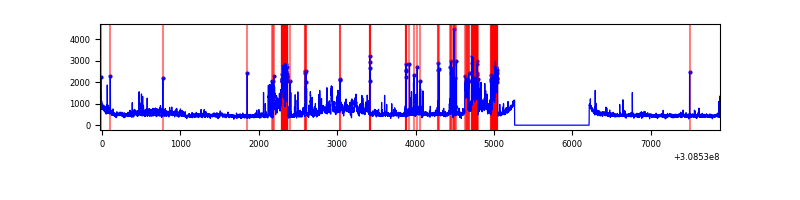 |
Top three noisy pixels from each quadrant. If the there are fewer than three noisy pixels in the level2.evt file, extra rows are filled as -1
| Pixel properties | Quadrant properties | ||||||
|---|---|---|---|---|---|---|---|
| Quadrant | DetID | PixID | Counts | Sigma | Mean | Median | Sigma |
| A | 13 | 254 | 13206 | 71.93 | 849 | 831 | 172.0 |
| A | 0 | 226 | 7428 | 38.34 | 849 | 831 | 172.0 |
| A | 3 | 137 | 6989 | 35.79 | 849 | 831 | 172.0 |
| B | 3 | 64 | 56465 | 334.37 | 858 | 836 | 166.4 |
| B | 0 | 197 | 22014 | 127.29 | 858 | 836 | 166.4 |
| B | 12 | 111 | 19131 | 109.97 | 858 | 836 | 166.4 |
| C | 14 | 238 | 129600 | 668.01 | 821 | 825 | 192.8 |
| C | 13 | 61 | 5660 | 25.08 | 821 | 825 | 192.8 |
| C | 3 | 248 | 2696 | 9.7 | 821 | 825 | 192.8 |
| D | 1 | 52 | 625581 | 3123.09 | 820 | 797 | 200.1 |
| D | 13 | 223 | 437848 | 2184.68 | 820 | 797 | 200.1 |
| D | 12 | 33 | 120355 | 597.63 | 820 | 797 | 200.1 |
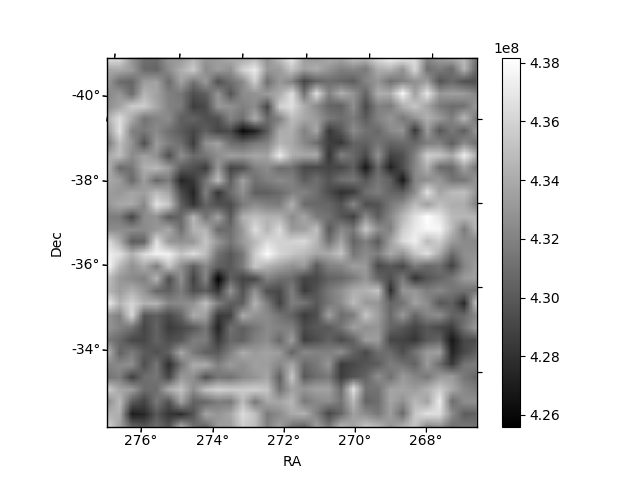
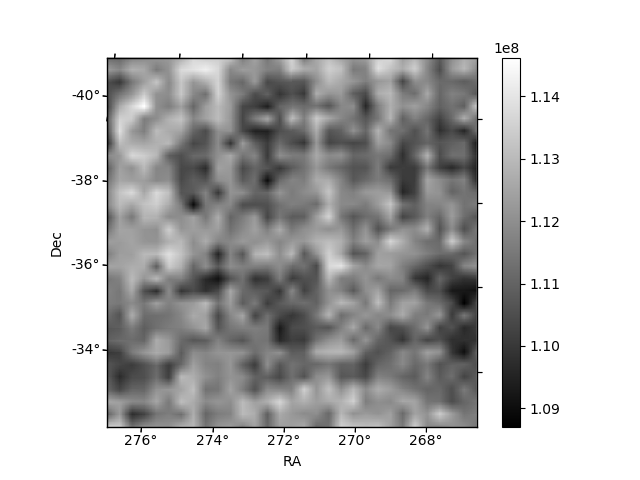
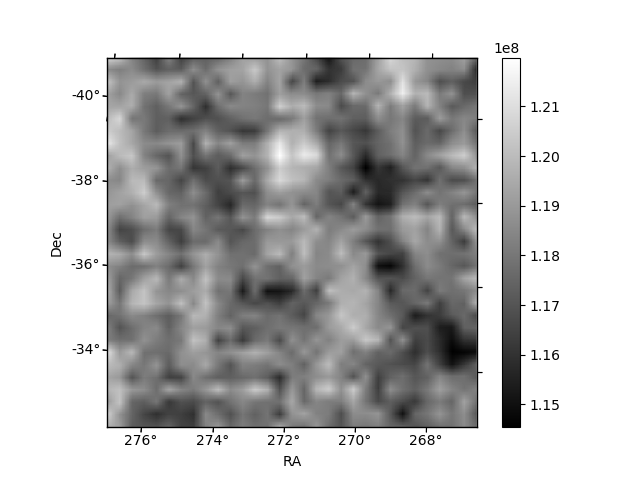
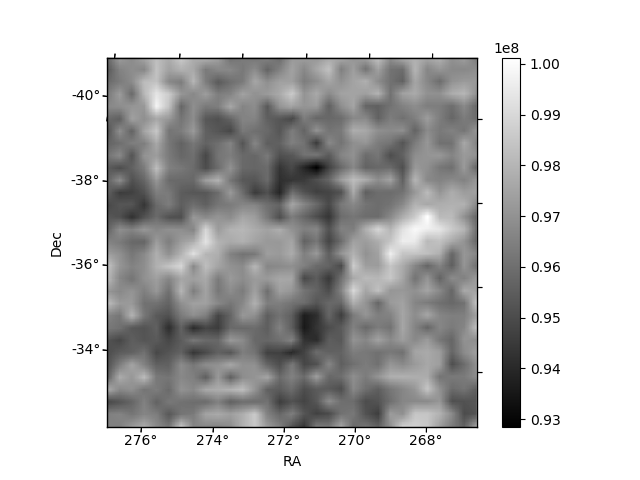
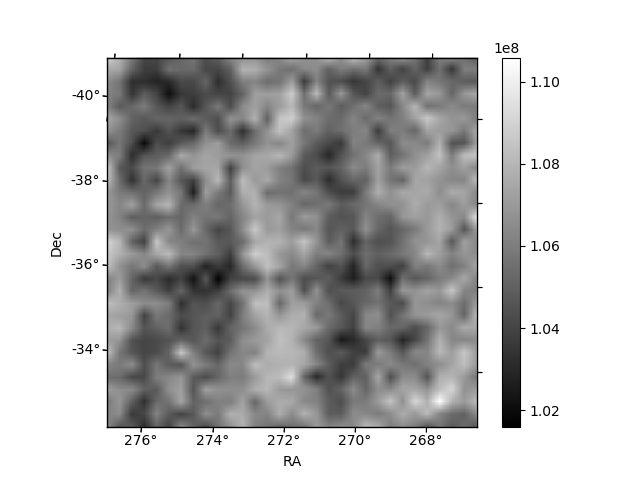
Histogram calculated using DETX and DETY for each event in the final _common_clean file
| Quadrant A | 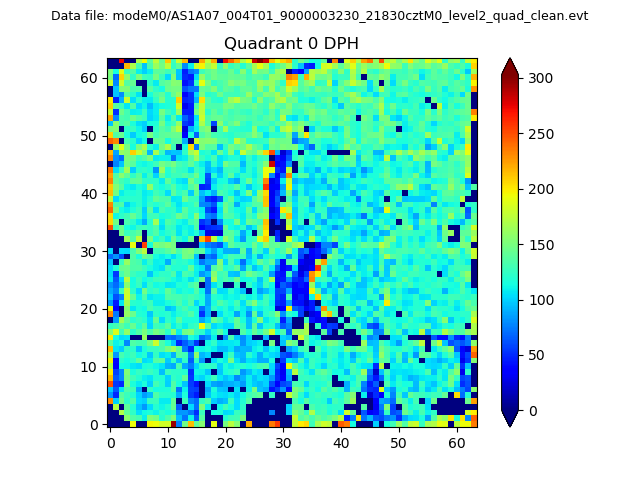 |
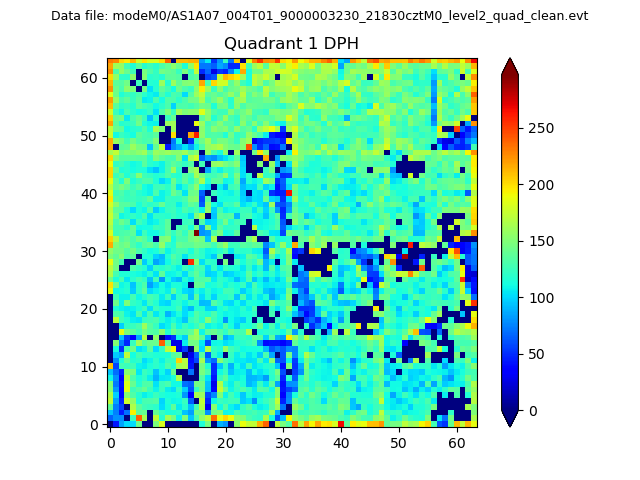 |
Quadrant B |
|---|---|---|---|
| Quadrant D | 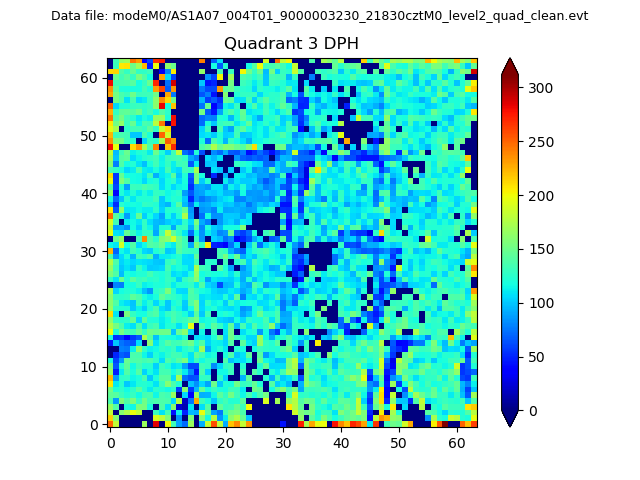 |
 |
Quadrant C |
| Plot type | Count rate plots | Images |
|---|---|---|
| Comparison with Poisson distribution Blue bars denote a histogram of data divided into 1 sec bins. Red curve is a Poisson curve with rate = median count rate of data. |
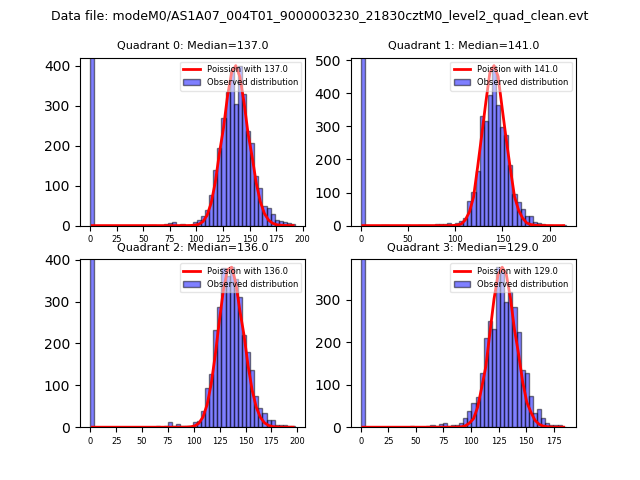 |
 |
| Quadrant-wise count rates Data is divided into 100 sec bins |
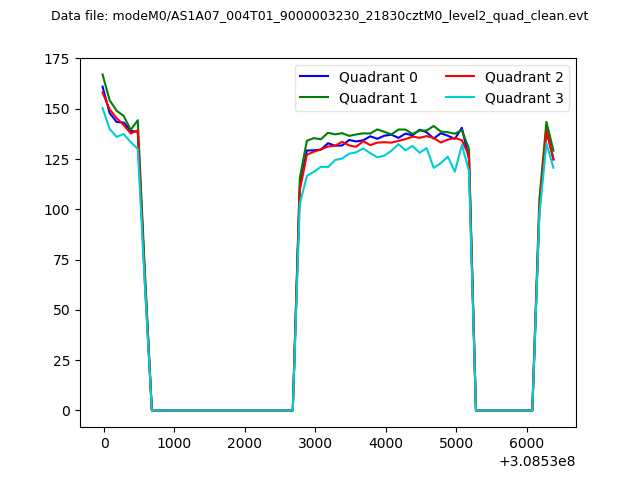 |
|
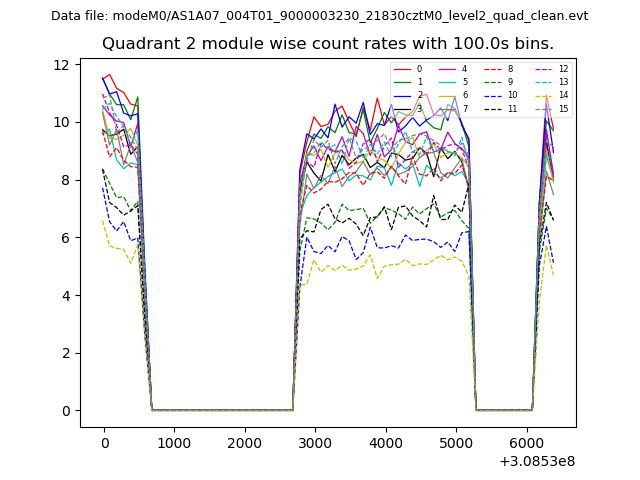
| Module-wise count rates for Quadrant A Data is divided into 100 sec bins |
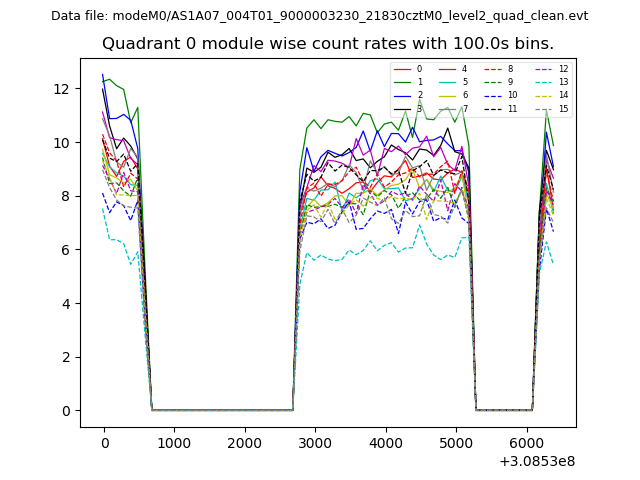 |
 |
| Module-wise count rates for Quadrant B Data is divided into 100 sec bins |
 |
 |
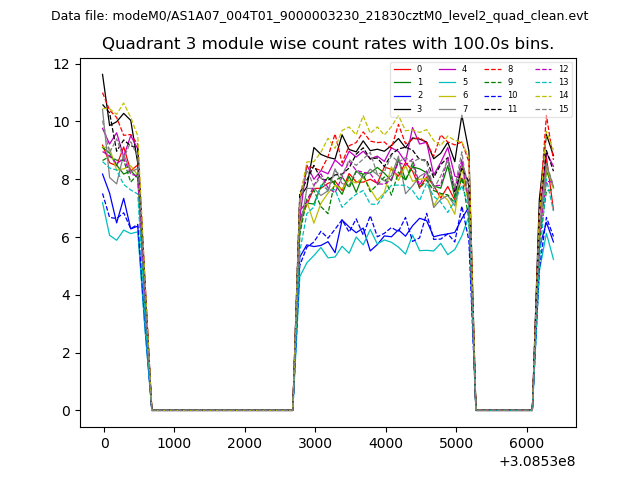
| Module-wise count rates for Quadrant C Data is divided into 100 sec bins |
 |
 |
| Module-wise count rates for Quadrant D Data is divided into 100 sec bins |
 |
 |
| Parameter | Plot |
|---|---|
| CZT HV Monitor | 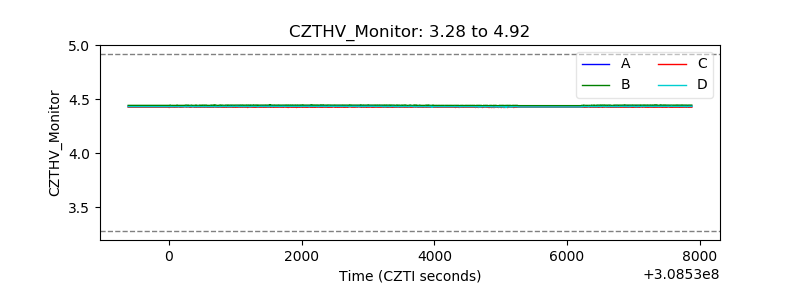 |
| D_VDD | 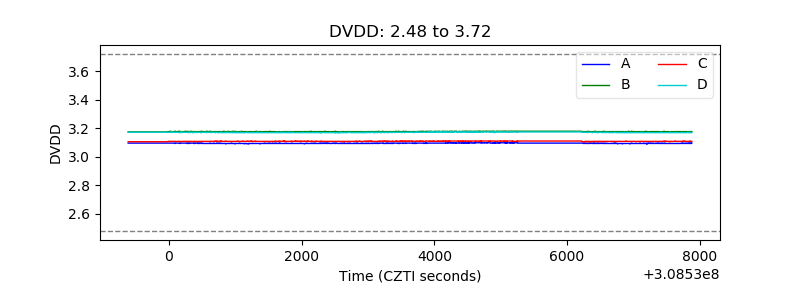 |
| Temperature 1 | 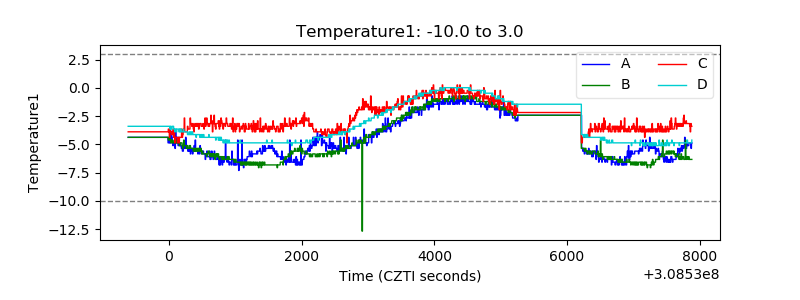 |
| Veto HV Monitor | 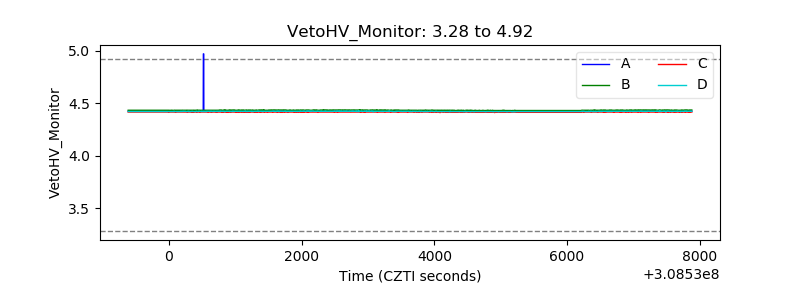 |
| Veto LLD | 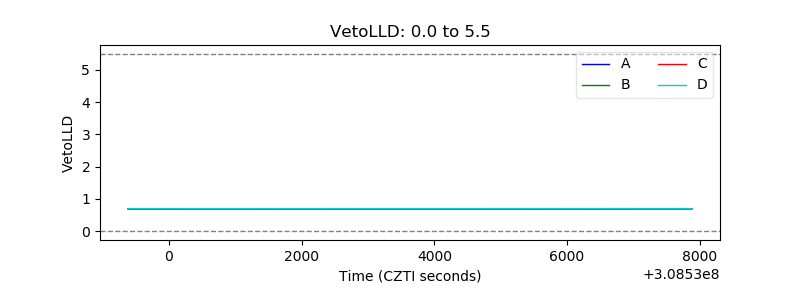 |
| Alpha Counter | 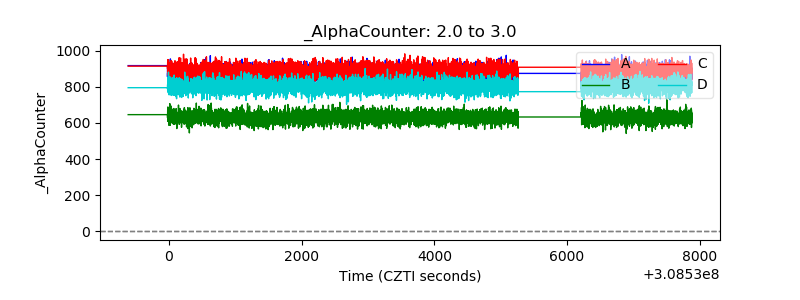 |
| _CPM_Rate | 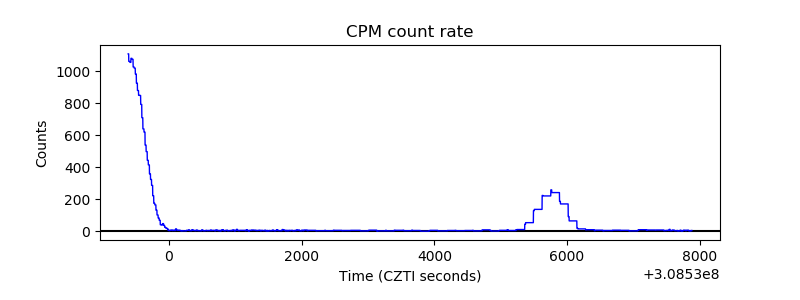 |
| CZT Counter |  |
| +2.5 Volts monitor |  |
| +5 Volts monitor |  |
| _ROLL_ROT | 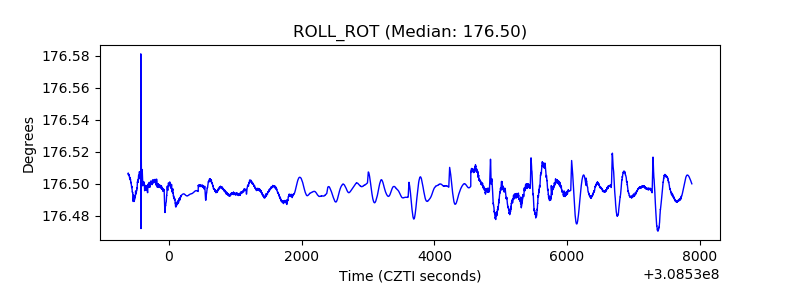 |
| _Roll_DEC | 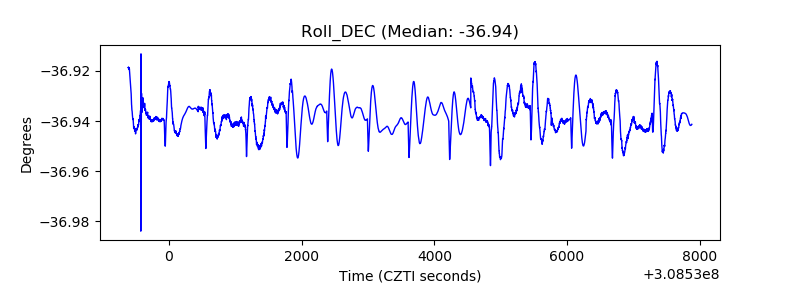 |
| _Roll_RA |  |
| Veto Counter | 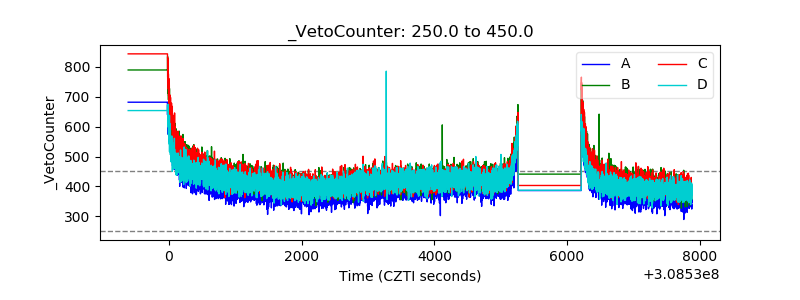 |