| Param | Original file | Final file |
|---|---|---|
| Filename | modeM0/AS1A07_004T01_9000003230_21831cztM0_level2.evt | modeM0/AS1A07_004T01_9000003230_21831cztM0_level2_quad_clean.evt |
| Size (bytes) | 500,656,320 | 76,204,800 |
| Size | 477.5 MB | 72.7 MB |
| Events in quadrant A | 3,445,304 | 454,550 |
| Events in quadrant B | 3,705,244 | 464,213 |
| Events in quadrant C | 3,486,171 | 450,920 |
| Events in quadrant D | 4,034,238 | 434,049 |
| Mode SS | |||
|---|---|---|---|
| Quadrant | BADHDUFLAG | Total packets | Discarded packets |
| A | 0 | 148 | 0 |
| B | 0 | 148 | 0 |
| C | 0 | 148 | 0 |
| D | 0 | 148 | 0 |
| Mode M0 | |||
|---|---|---|---|
| Quadrant | BADHDUFLAG | Total packets | Discarded packets |
| A | 0 | 14988 | 2 |
| B | 0 | 15538 | 2 |
| C | 0 | 14991 | 2 |
| D | 0 | 16774 | 2 |
| Mode M9 | |||
|---|---|---|---|
| Quadrant | BADHDUFLAG | Total packets | Discarded packets |
| A | 0 | 4 | 0 |
| B | 0 | 4 | 0 |
| C | 0 | 4 | 0 |
| D | 0 | 4 | 0 |
| Quadrant | Total seconds | Saturated seconds | Saturation percentage |
|---|---|---|---|
| A | 7229 | 148 | 2.047309% |
| B | 7230 | 182 | 2.517289% |
| C | 7230 | 186 | 2.572614% |
| D | 7229 | 159 | 2.199474% |
Noise dominated data is calculated using 1-second bins in cleaned event files. If a bin has >2000 counts, and if more than 50% of those come from <1% of pixels, then it is considered to be noise-dominated and hence unusable.
| Quadrant | # 1 sec bins | Bins with >0 counts | Bins with >2000 counts | High rate bins dominated by noise | Noise dominated (total time) | Noise dominated (detector-on time) | Marked lightcurve |
|---|---|---|---|---|---|---|---|
| A | 7649 | 7230 | 0 | 0 | 0.00% | 0.00% | 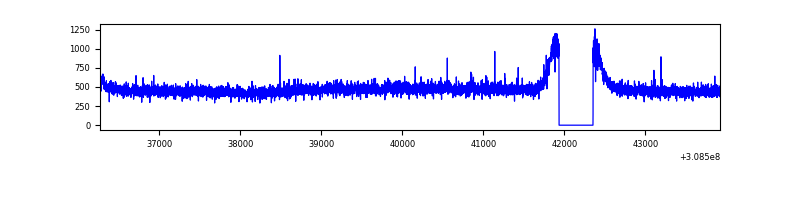 |
| B | 7650 | 7231 | 10 | 10 | 0.13% | 0.14% | 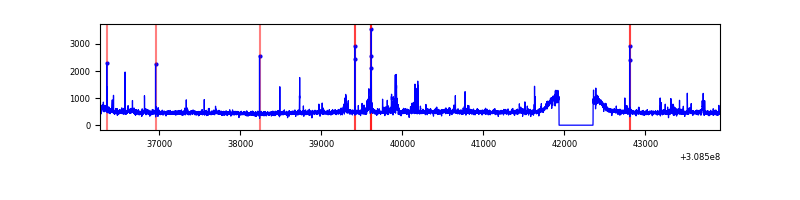 |
| C | 7650 | 7230 | 0 | 0 | 0.00% | 0.00% | 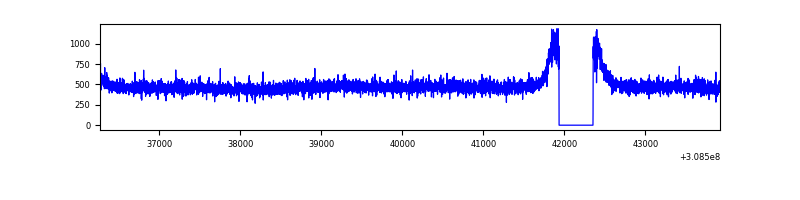 |
| D | 7649 | 7229 | 19 | 19 | 0.25% | 0.26% | 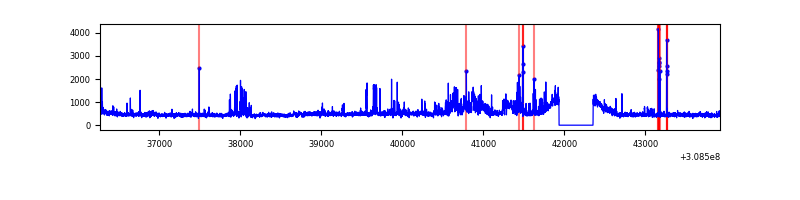 |
Top three noisy pixels from each quadrant. If the there are fewer than three noisy pixels in the level2.evt file, extra rows are filled as -1
| Pixel properties | Quadrant properties | ||||||
|---|---|---|---|---|---|---|---|
| Quadrant | DetID | PixID | Counts | Sigma | Mean | Median | Sigma |
| A | 13 | 254 | 13605 | 70.41 | 891 | 871 | 180.9 |
| A | 0 | 226 | 7544 | 36.9 | 891 | 871 | 180.9 |
| A | 3 | 137 | 7453 | 36.39 | 891 | 871 | 180.9 |
| B | 3 | 64 | 78561 | 451.01 | 894 | 873 | 172.3 |
| B | 0 | 190 | 32559 | 183.95 | 894 | 873 | 172.3 |
| B | 0 | 230 | 28705 | 161.58 | 894 | 873 | 172.3 |
| C | 14 | 238 | 132132 | 647.88 | 858 | 863 | 202.6 |
| C | 13 | 61 | 6127 | 25.98 | 858 | 863 | 202.6 |
| C | 3 | 248 | 4746 | 19.16 | 858 | 863 | 202.6 |
| D | 1 | 52 | 568160 | 2678.01 | 865 | 841 | 211.8 |
| D | 7 | 38 | 96298 | 450.6 | 865 | 841 | 211.8 |
| D | 2 | 234 | 34243 | 157.67 | 865 | 841 | 211.8 |
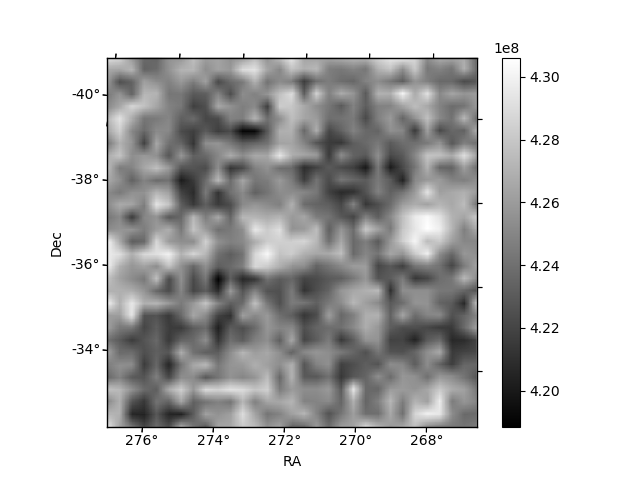
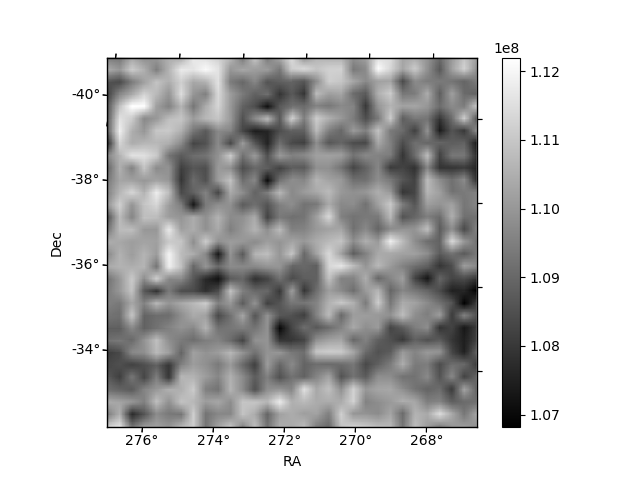
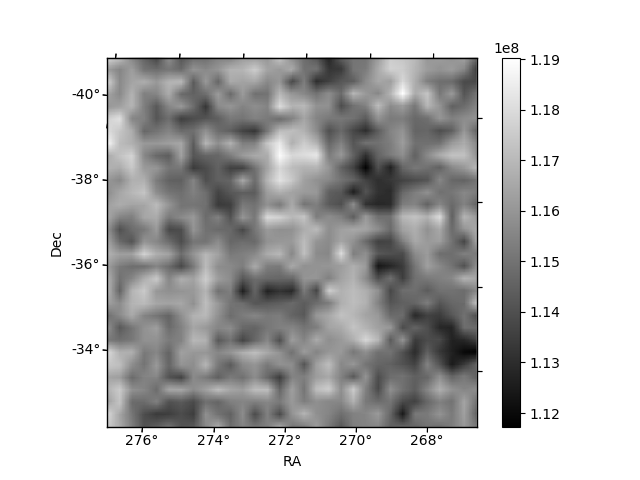
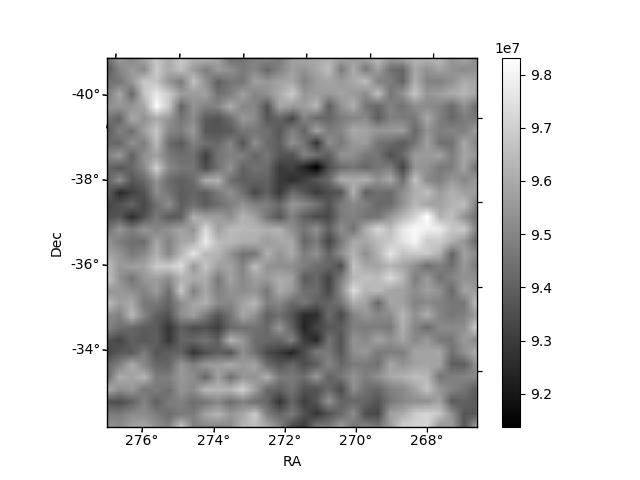
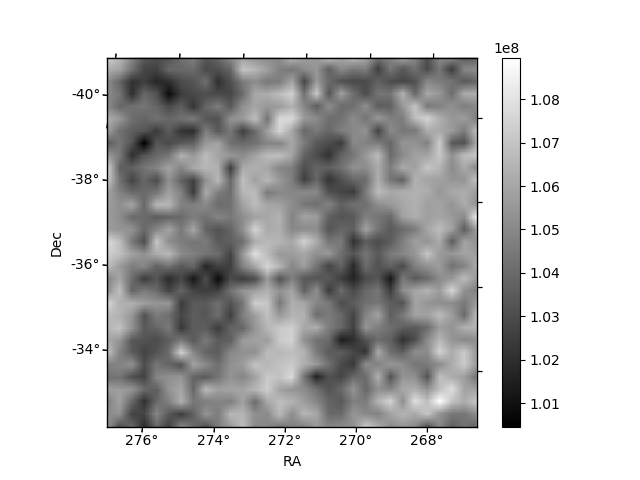
Histogram calculated using DETX and DETY for each event in the final _common_clean file
| Quadrant A | 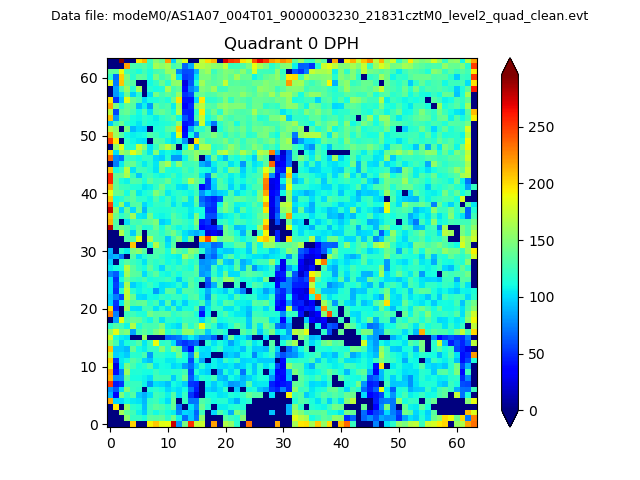 |
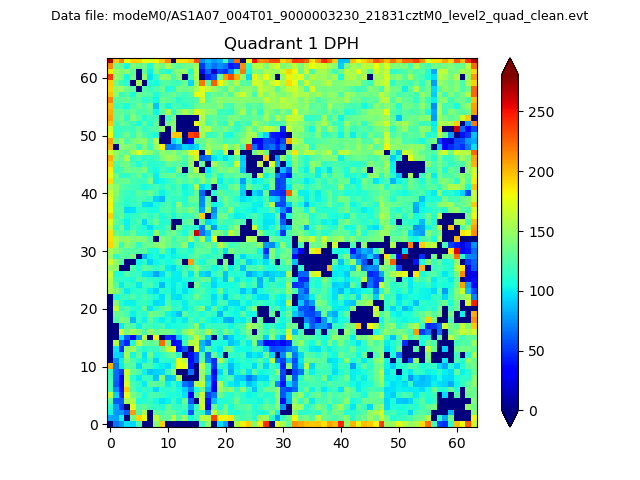 |
Quadrant B |
|---|---|---|---|
| Quadrant D | 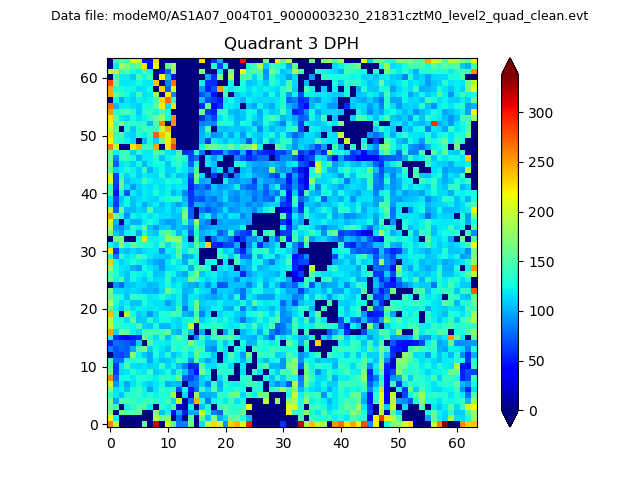 |
 |
Quadrant C |
| Plot type | Count rate plots | Images |
|---|---|---|
| Comparison with Poisson distribution Blue bars denote a histogram of data divided into 1 sec bins. Red curve is a Poisson curve with rate = median count rate of data. |
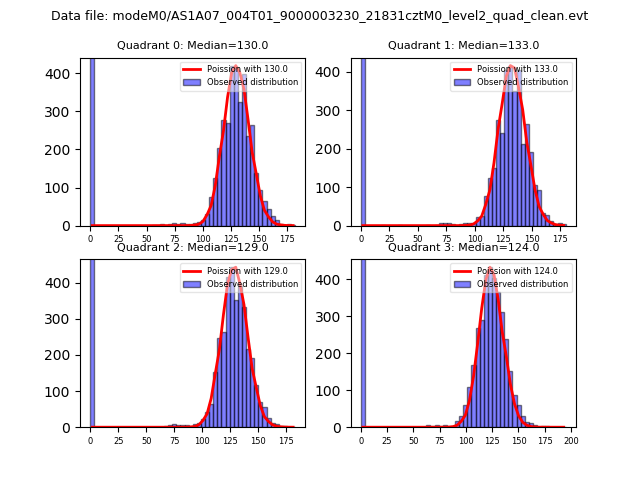 |
 |
| Quadrant-wise count rates Data is divided into 100 sec bins |
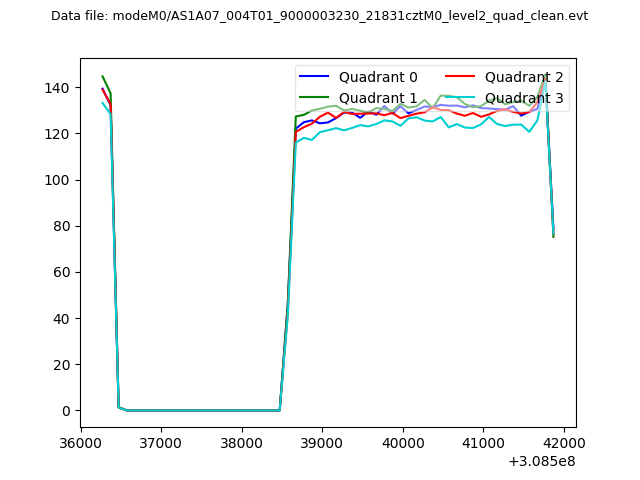 |
|
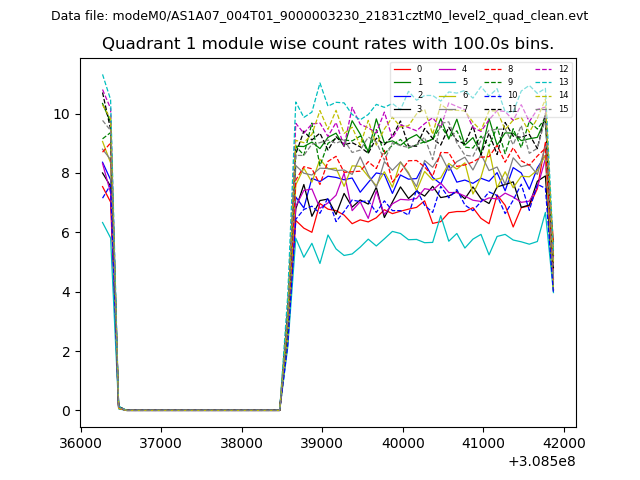
| Module-wise count rates for Quadrant A Data is divided into 100 sec bins |
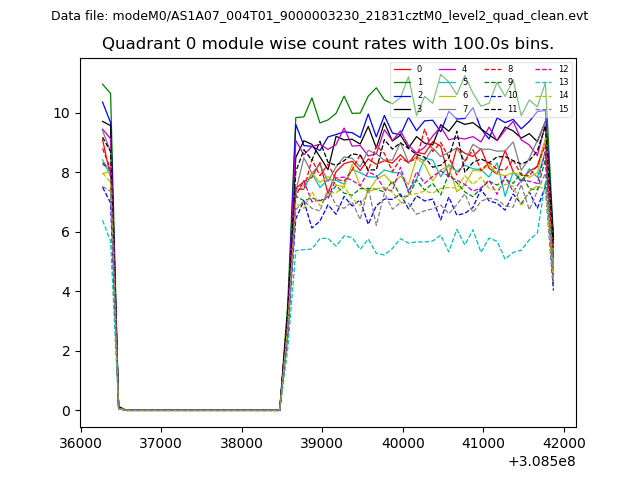 |
 |
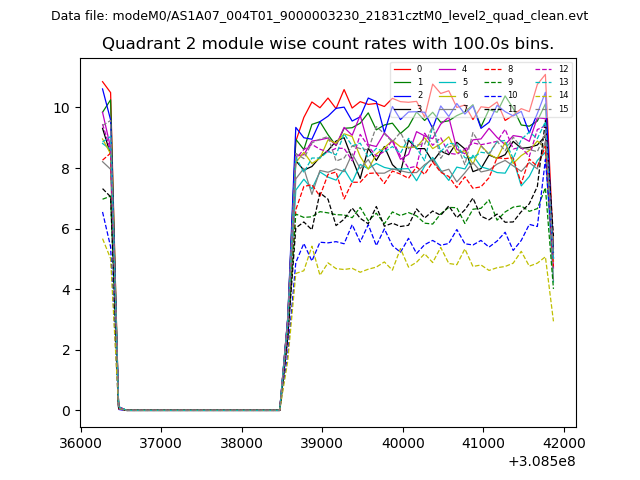
| Module-wise count rates for Quadrant B Data is divided into 100 sec bins |
 |
 |
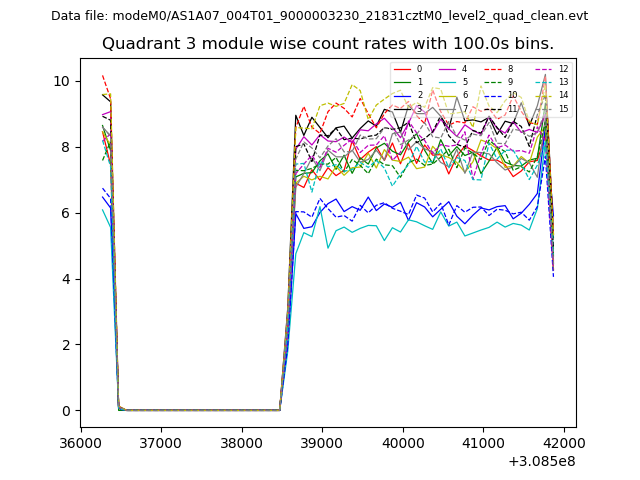
| Module-wise count rates for Quadrant C Data is divided into 100 sec bins |
 |
 |
| Module-wise count rates for Quadrant D Data is divided into 100 sec bins |
 |
 |
| Parameter | Plot |
|---|---|
| CZT HV Monitor | 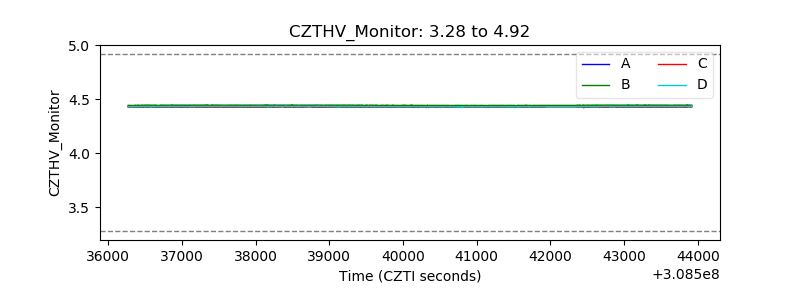 |
| D_VDD | 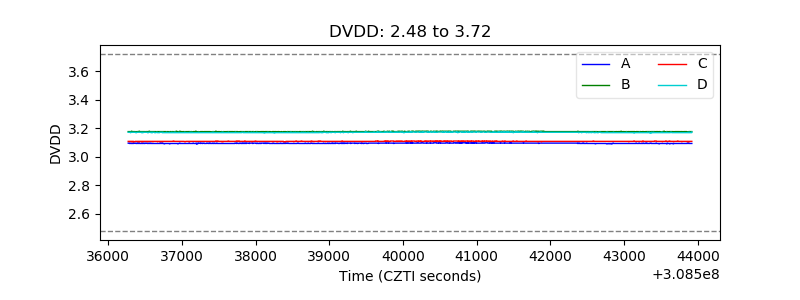 |
| Temperature 1 | 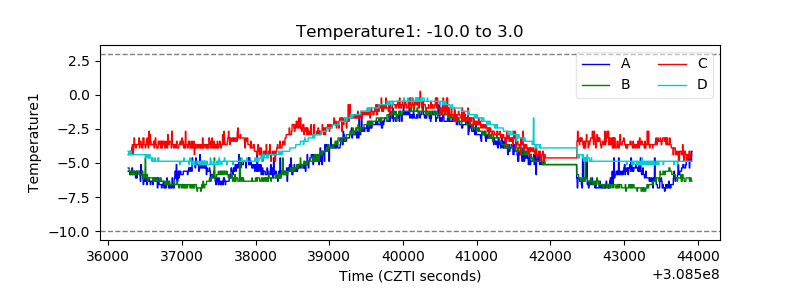 |
| Veto HV Monitor | 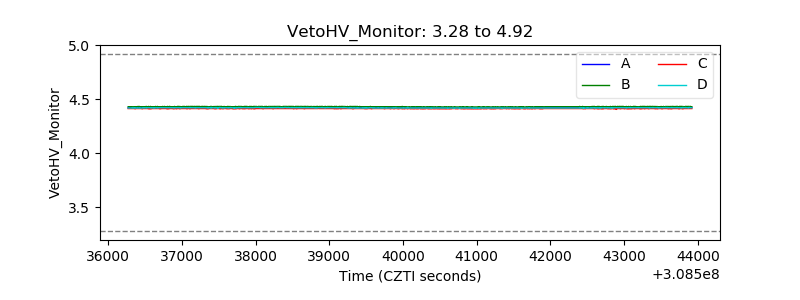 |
| Veto LLD | 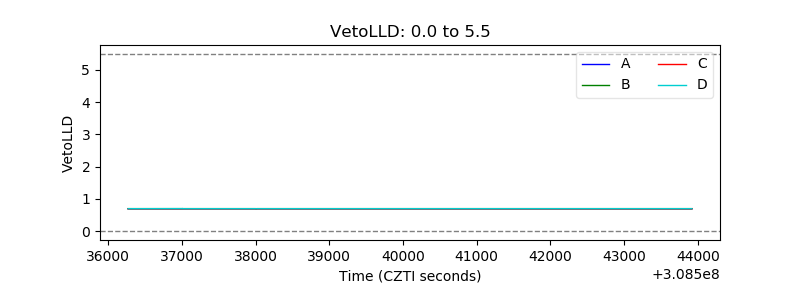 |
| Alpha Counter | 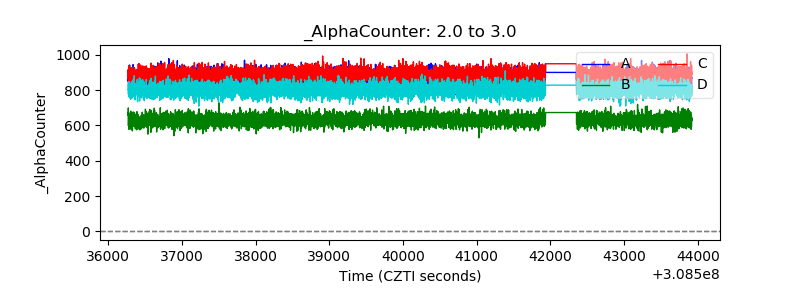 |
| _CPM_Rate | 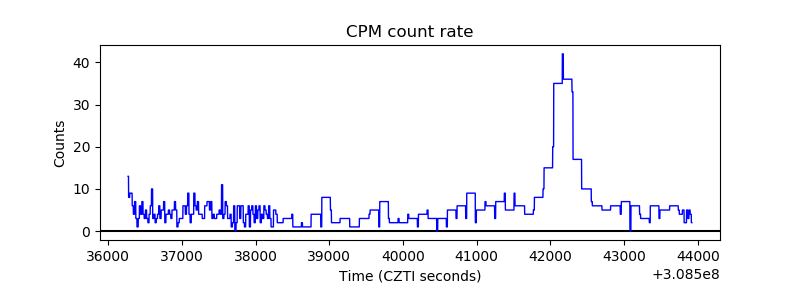 |
| CZT Counter |  |
| +2.5 Volts monitor |  |
| +5 Volts monitor |  |
| _ROLL_ROT | 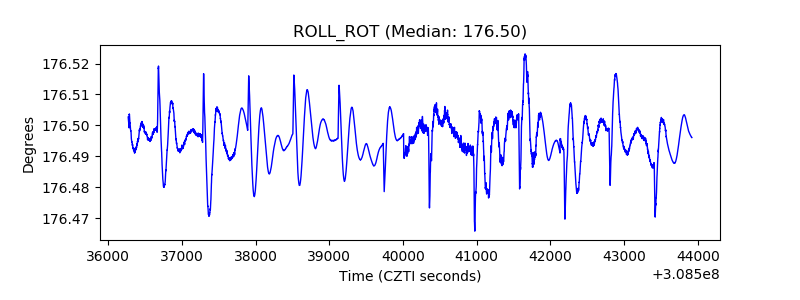 |
| _Roll_DEC | 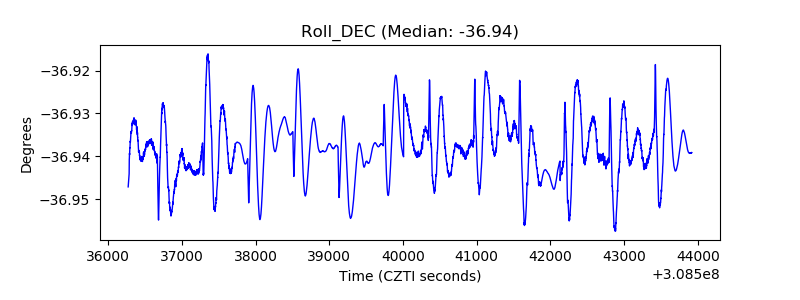 |
| _Roll_RA |  |
| Veto Counter | 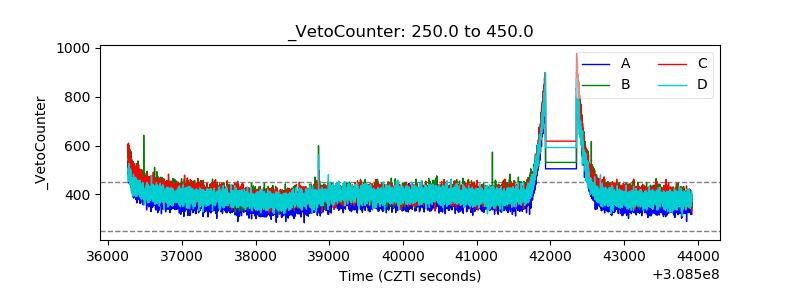 |