| Param | Original file | Final file |
|---|---|---|
| Filename | modeM0/AS1A07_004T01_9000003230_21832cztM0_level2.evt | modeM0/AS1A07_004T01_9000003230_21832cztM0_level2_quad_clean.evt |
| Size (bytes) | 508,887,360 | 77,382,720 |
| Size | 485.3 MB | 73.8 MB |
| Events in quadrant A | 3,466,918 | 464,497 |
| Events in quadrant B | 3,751,061 | 470,550 |
| Events in quadrant C | 3,521,445 | 458,961 |
| Events in quadrant D | 4,176,383 | 441,000 |
| Mode SS | |||
|---|---|---|---|
| Quadrant | BADHDUFLAG | Total packets | Discarded packets |
| A | 0 | 150 | 0 |
| B | 0 | 150 | 0 |
| C | 0 | 150 | 0 |
| D | 0 | 150 | 0 |
| Mode M0 | |||
|---|---|---|---|
| Quadrant | BADHDUFLAG | Total packets | Discarded packets |
| A | 0 | 15108 | 2 |
| B | 0 | 15738 | 3 |
| C | 0 | 15130 | 2 |
| D | 0 | 17341 | 2 |
| Mode M9 | |||
|---|---|---|---|
| Quadrant | BADHDUFLAG | Total packets | Discarded packets |
| A | 0 | 2 | 0 |
| B | 0 | 2 | 0 |
| C | 0 | 2 | 0 |
| D | 0 | 2 | 0 |
| Quadrant | Total seconds | Saturated seconds | Saturation percentage |
|---|---|---|---|
| A | 7299 | 164 | 2.246883% |
| B | 7299 | 230 | 3.151117% |
| C | 7299 | 200 | 2.740101% |
| D | 7299 | 194 | 2.657898% |
Noise dominated data is calculated using 1-second bins in cleaned event files. If a bin has >2000 counts, and if more than 50% of those come from <1% of pixels, then it is considered to be noise-dominated and hence unusable.
| Quadrant | # 1 sec bins | Bins with >0 counts | Bins with >2000 counts | High rate bins dominated by noise | Noise dominated (total time) | Noise dominated (detector-on time) | Marked lightcurve |
|---|---|---|---|---|---|---|---|
| A | 7469 | 7300 | 1 | 1 | 0.01% | 0.01% | 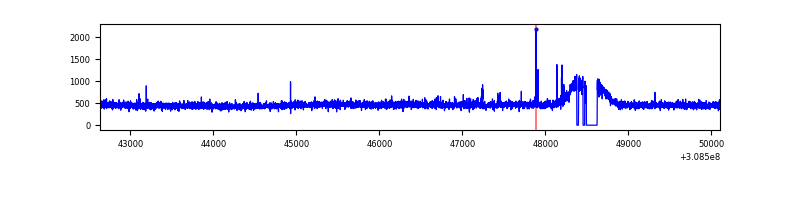 |
| B | 7469 | 7302 | 31 | 31 | 0.42% | 0.42% | 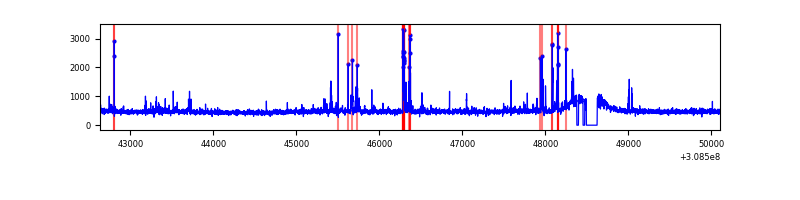 |
| C | 7469 | 7301 | 0 | 0 | 0.00% | 0.00% | 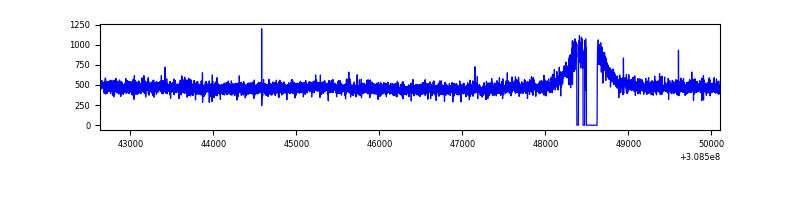 |
| D | 7469 | 7302 | 45 | 45 | 0.60% | 0.62% | 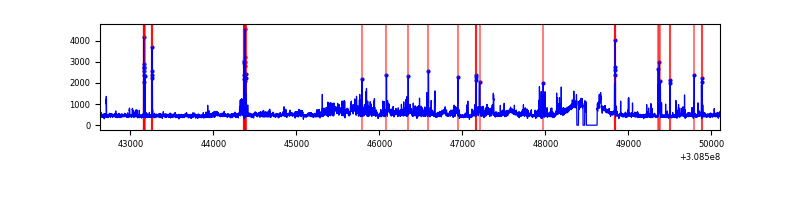 |
Top three noisy pixels from each quadrant. If the there are fewer than three noisy pixels in the level2.evt file, extra rows are filled as -1
| Pixel properties | Quadrant properties | ||||||
|---|---|---|---|---|---|---|---|
| Quadrant | DetID | PixID | Counts | Sigma | Mean | Median | Sigma |
| A | 14 | 235 | 33112 | 178.51 | 890 | 871 | 180.6 |
| A | 13 | 254 | 13227 | 68.41 | 890 | 871 | 180.6 |
| A | 3 | 137 | 7627 | 37.41 | 890 | 871 | 180.6 |
| B | 3 | 64 | 150194 | 873.8 | 889 | 866 | 170.9 |
| B | 0 | 197 | 31618 | 179.95 | 889 | 866 | 170.9 |
| B | 0 | 190 | 26158 | 148.0 | 889 | 866 | 170.9 |
| C | 14 | 238 | 131330 | 641.28 | 858 | 861 | 203.5 |
| C | 3 | 248 | 22213 | 104.95 | 858 | 861 | 203.5 |
| C | 10 | 91 | 21821 | 103.02 | 858 | 861 | 203.5 |
| D | 1 | 52 | 780352 | 3678.19 | 863 | 837 | 211.9 |
| D | 14 | 35 | 42480 | 196.5 | 863 | 837 | 211.9 |
| D | 2 | 234 | 32406 | 148.96 | 863 | 837 | 211.9 |
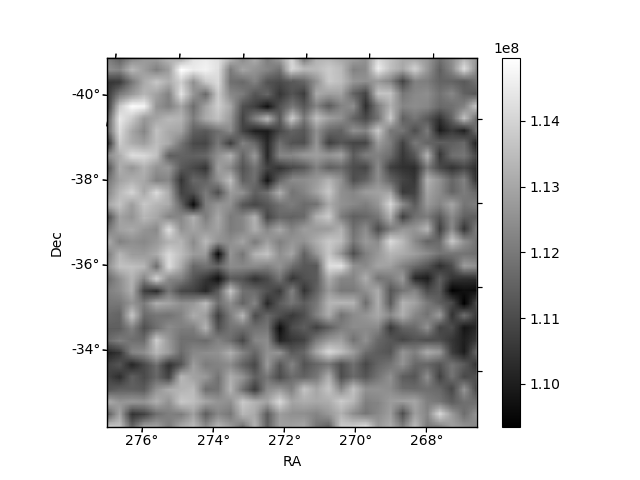
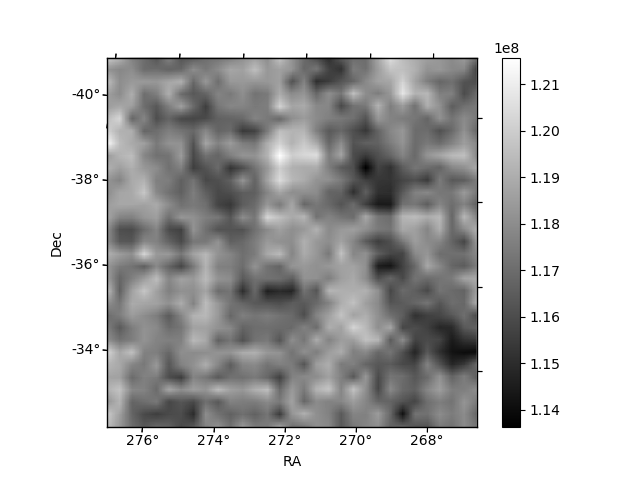
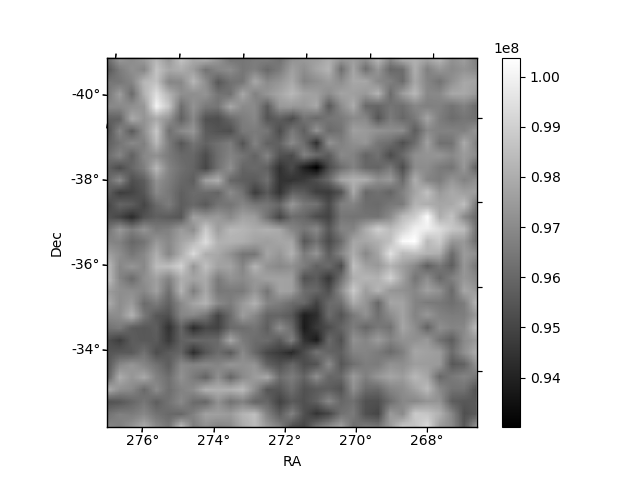
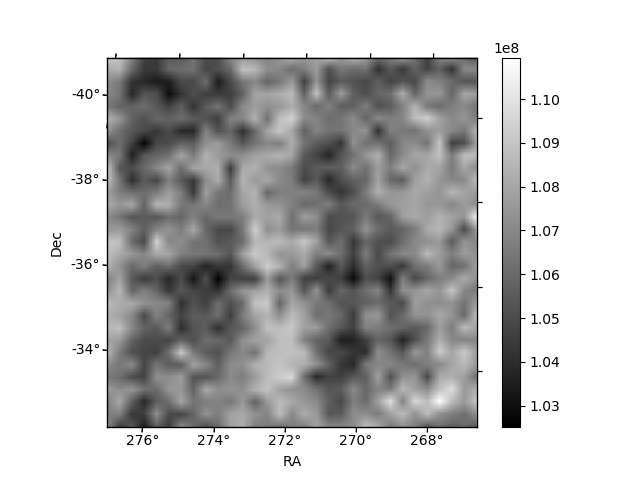
Histogram calculated using DETX and DETY for each event in the final _common_clean file
| Quadrant A | 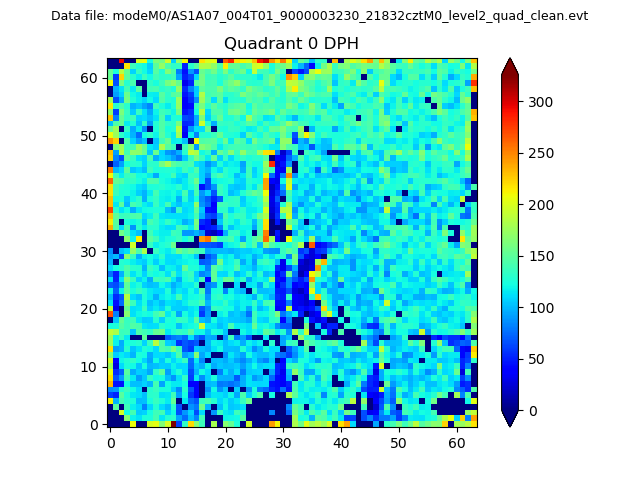 |
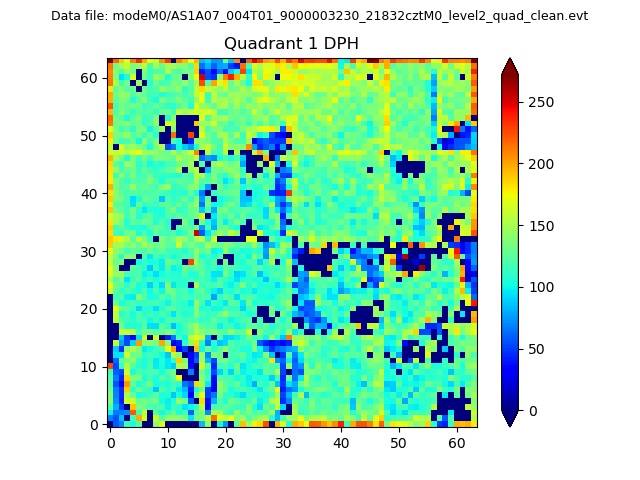 |
Quadrant B |
|---|---|---|---|
| Quadrant D | 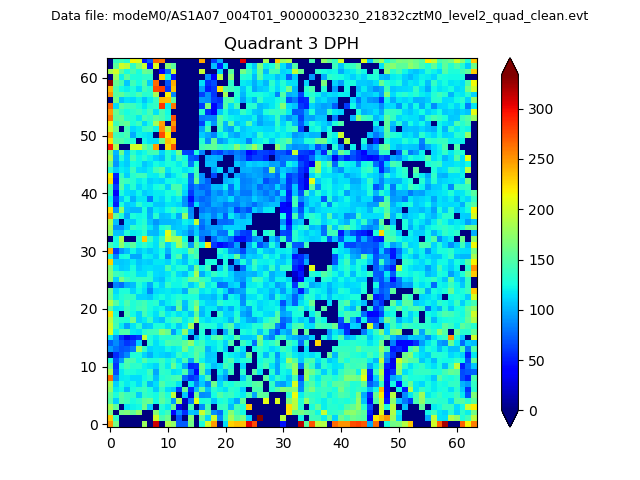 |
 |
Quadrant C |
| Plot type | Count rate plots | Images |
|---|---|---|
| Comparison with Poisson distribution Blue bars denote a histogram of data divided into 1 sec bins. Red curve is a Poisson curve with rate = median count rate of data. |
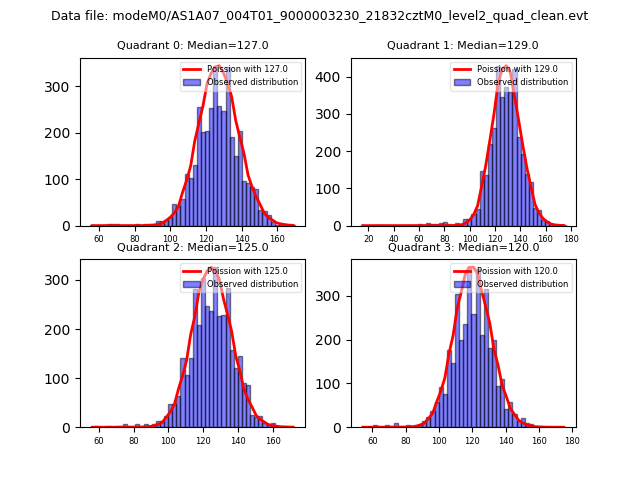 |
 |
| Quadrant-wise count rates Data is divided into 100 sec bins |
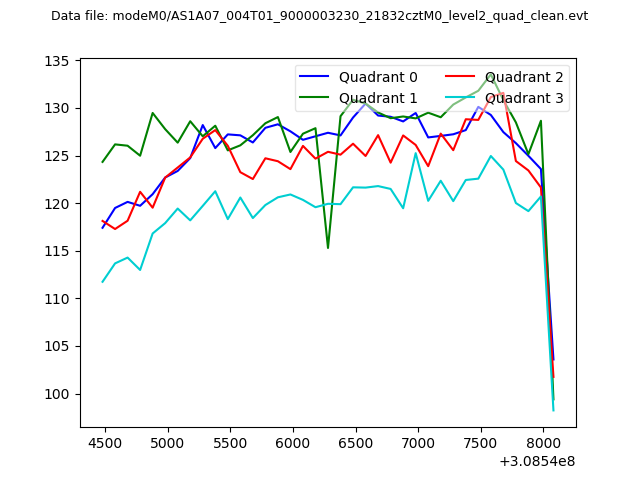 |
|
| Module-wise count rates for Quadrant A Data is divided into 100 sec bins |
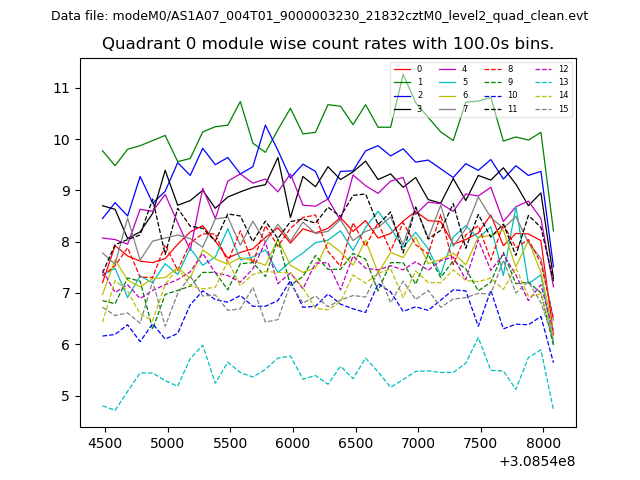 |
 |
| Module-wise count rates for Quadrant B Data is divided into 100 sec bins |
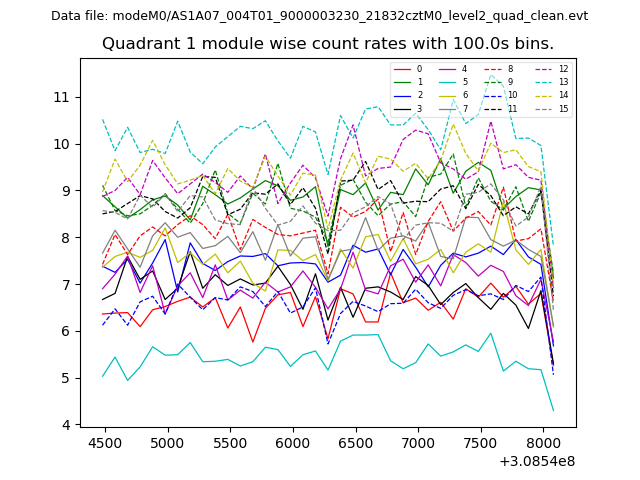 |
 |
| Module-wise count rates for Quadrant C Data is divided into 100 sec bins |
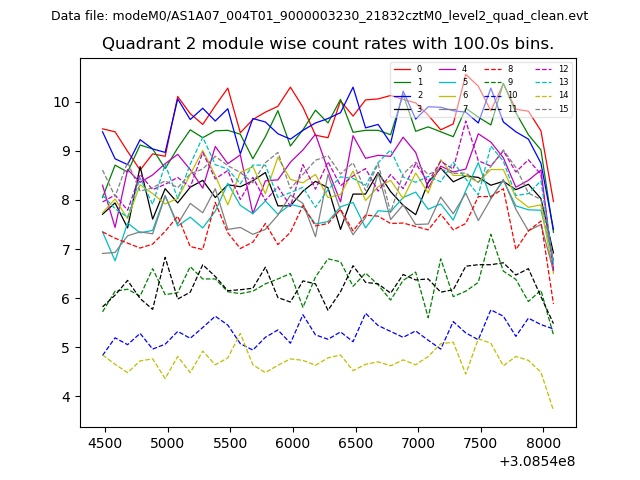 |
 |
| Module-wise count rates for Quadrant D Data is divided into 100 sec bins |
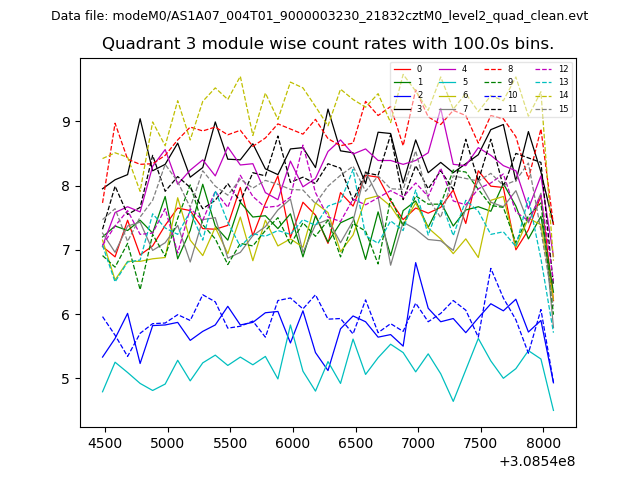 |
 |
| Parameter | Plot |
|---|---|
| CZT HV Monitor | 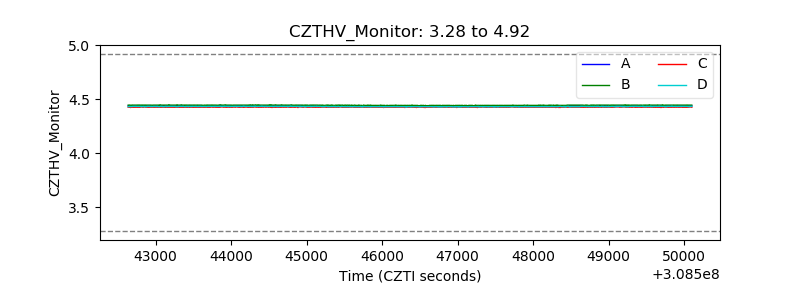 |
| D_VDD | 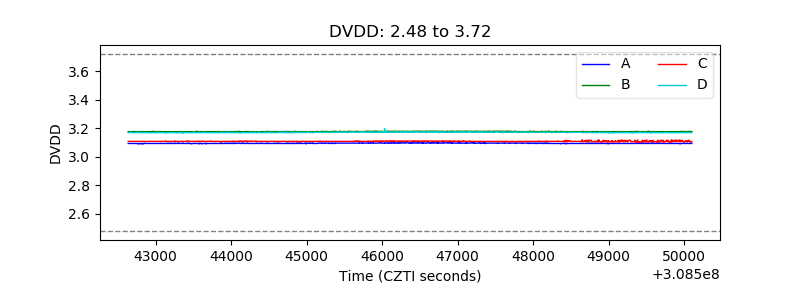 |
| Temperature 1 | 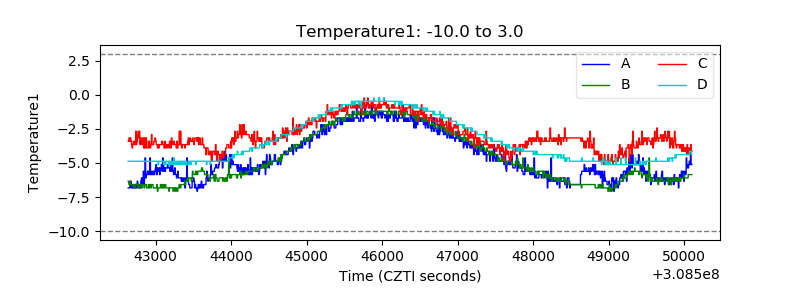 |
| Veto HV Monitor | 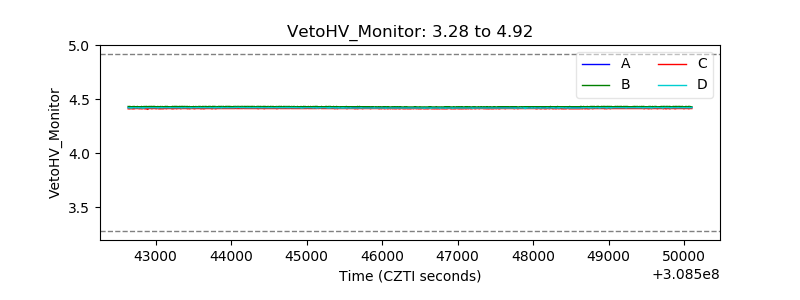 |
| Veto LLD | 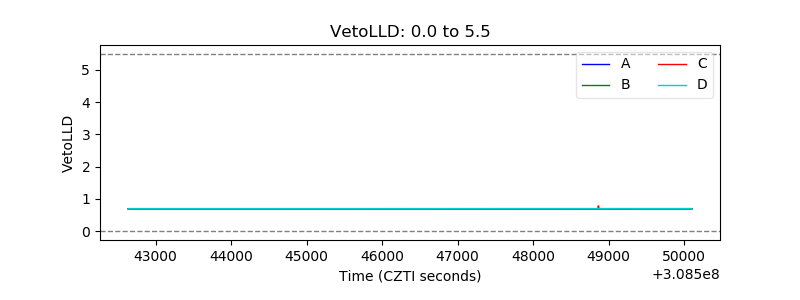 |
| Alpha Counter | 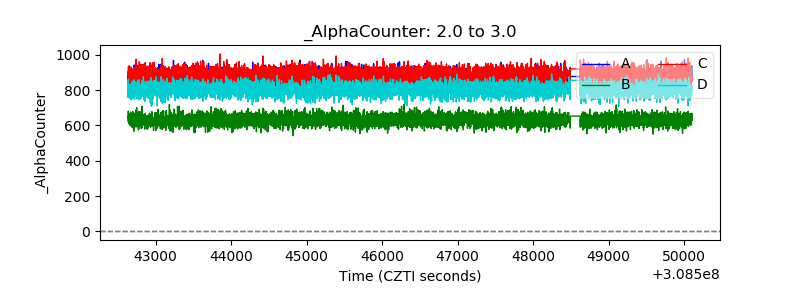 |
| _CPM_Rate | 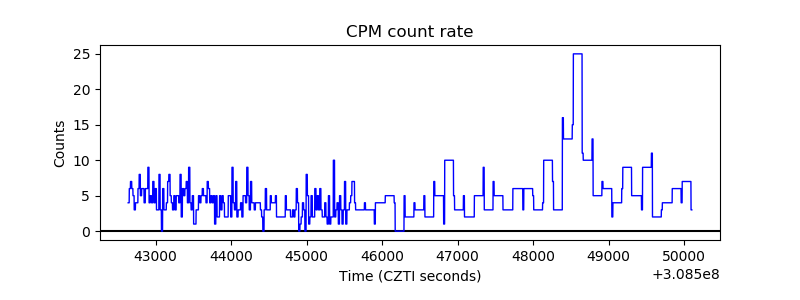 |
| CZT Counter | 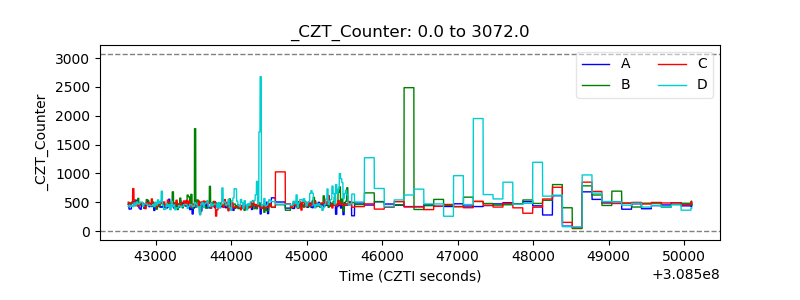 |
| +2.5 Volts monitor |  |
| +5 Volts monitor |  |
| _ROLL_ROT | 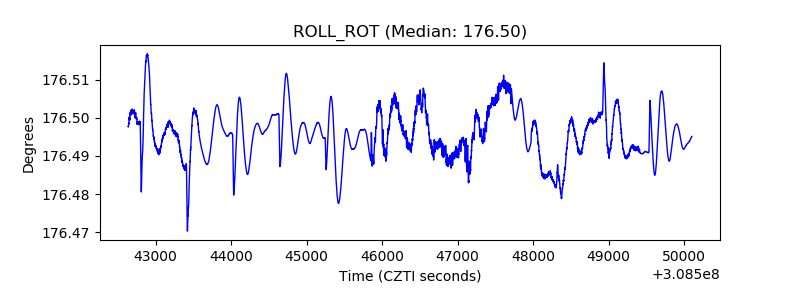 |
| _Roll_DEC | 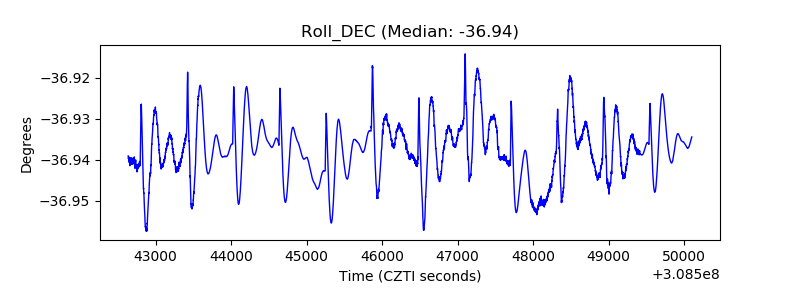 |
| _Roll_RA | 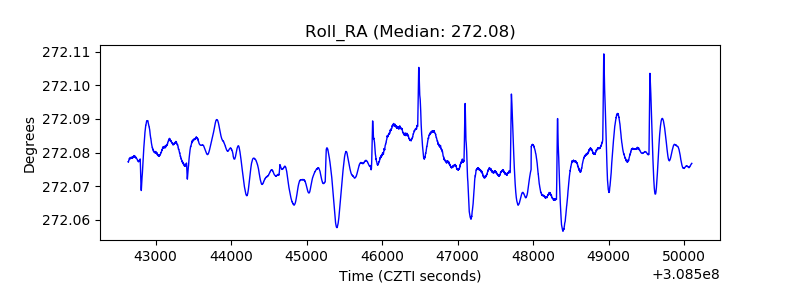 |
| Veto Counter | 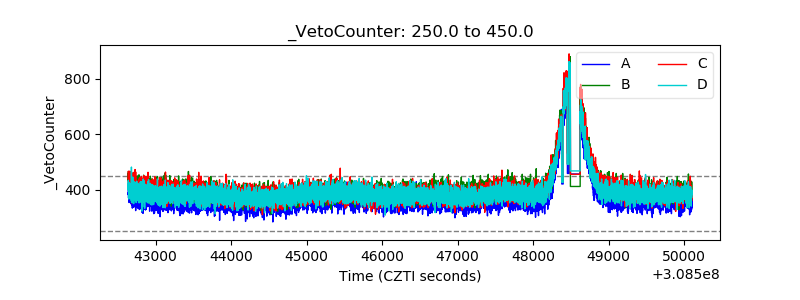 |