| Param | Original file | Final file |
|---|---|---|
| Filename | modeM0/AS1A07_004T01_9000003230_21833cztM0_level2.evt | modeM0/AS1A07_004T01_9000003230_21833cztM0_level2_quad_clean.evt |
| Size (bytes) | 612,316,800 | 98,786,880 |
| Size | 584.0 MB | 94.2 MB |
| Events in quadrant A | 4,181,367 | 602,552 |
| Events in quadrant B | 4,491,706 | 615,161 |
| Events in quadrant C | 4,294,660 | 597,041 |
| Events in quadrant D | 4,985,689 | 572,548 |
| Mode SS | |||
|---|---|---|---|
| Quadrant | BADHDUFLAG | Total packets | Discarded packets |
| A | 0 | 180 | 0 |
| B | 0 | 180 | 0 |
| C | 0 | 180 | 0 |
| D | 0 | 180 | 0 |
| Mode M0 | |||
|---|---|---|---|
| Quadrant | BADHDUFLAG | Total packets | Discarded packets |
| A | 0 | 18134 | 3 |
| B | 0 | 18781 | 3 |
| C | 0 | 18209 | 3 |
| D | 0 | 20522 | 3 |
| Mode M9 | |||
|---|---|---|---|
| Quadrant | BADHDUFLAG | Total packets | Discarded packets |
| A | 0 | 5 | 0 |
| B | 0 | 5 | 0 |
| C | 0 | 5 | 0 |
| D | 0 | 5 | 0 |
| Quadrant | Total seconds | Saturated seconds | Saturation percentage |
|---|---|---|---|
| A | 8702 | 274 | 3.148701% |
| B | 8703 | 339 | 3.895209% |
| C | 8703 | 333 | 3.826267% |
| D | 8703 | 342 | 3.929679% |
Noise dominated data is calculated using 1-second bins in cleaned event files. If a bin has >2000 counts, and if more than 50% of those come from <1% of pixels, then it is considered to be noise-dominated and hence unusable.
| Quadrant | # 1 sec bins | Bins with >0 counts | Bins with >2000 counts | High rate bins dominated by noise | Noise dominated (total time) | Noise dominated (detector-on time) | Marked lightcurve |
|---|---|---|---|---|---|---|---|
| A | 9177 | 8703 | 1 | 1 | 0.01% | 0.01% | 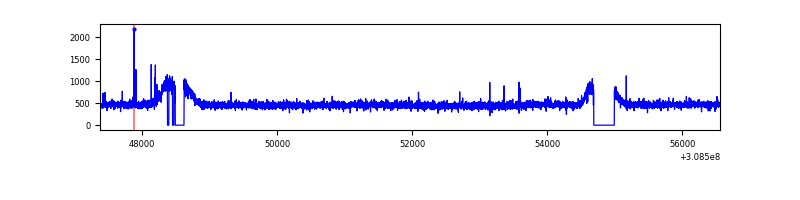 |
| B | 9178 | 8706 | 21 | 21 | 0.23% | 0.24% | 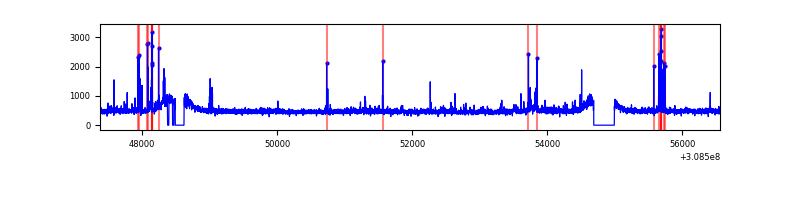 |
| C | 9178 | 8705 | 0 | 0 | 0.00% | 0.00% | 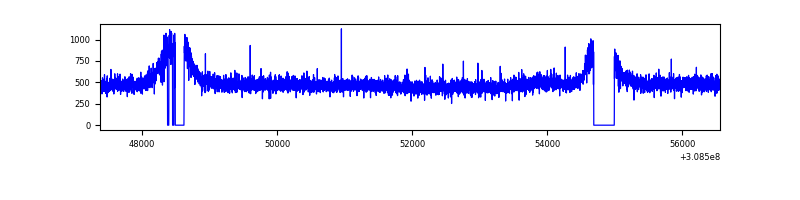 |
| D | 9178 | 8706 | 87 | 87 | 0.95% | 1.00% | 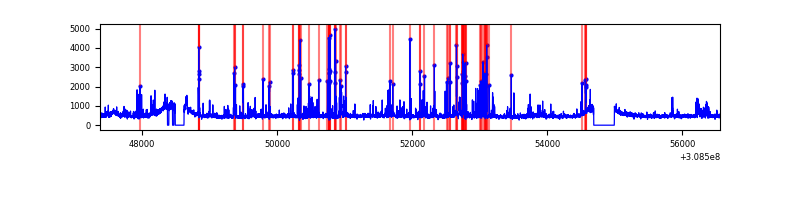 |
Top three noisy pixels from each quadrant. If the there are fewer than three noisy pixels in the level2.evt file, extra rows are filled as -1
| Pixel properties | Quadrant properties | ||||||
|---|---|---|---|---|---|---|---|
| Quadrant | DetID | PixID | Counts | Sigma | Mean | Median | Sigma |
| A | 14 | 235 | 20136 | 87.05 | 1078 | 1052 | 219.2 |
| A | 13 | 254 | 15787 | 67.21 | 1078 | 1052 | 219.2 |
| A | 3 | 137 | 9452 | 38.32 | 1078 | 1052 | 219.2 |
| B | 3 | 64 | 149862 | 718.43 | 1079 | 1052 | 207.1 |
| B | 0 | 230 | 31531 | 147.15 | 1079 | 1052 | 207.1 |
| B | 12 | 111 | 25462 | 117.85 | 1079 | 1052 | 207.1 |
| C | 14 | 238 | 159612 | 643.06 | 1041 | 1043 | 246.6 |
| C | 3 | 248 | 35164 | 138.37 | 1041 | 1043 | 246.6 |
| C | 10 | 91 | 22487 | 86.96 | 1041 | 1043 | 246.6 |
| D | 1 | 52 | 825931 | 3205.4 | 1049 | 1014 | 257.4 |
| D | 2 | 136 | 53438 | 203.71 | 1049 | 1014 | 257.4 |
| D | 7 | 38 | 43261 | 164.16 | 1049 | 1014 | 257.4 |
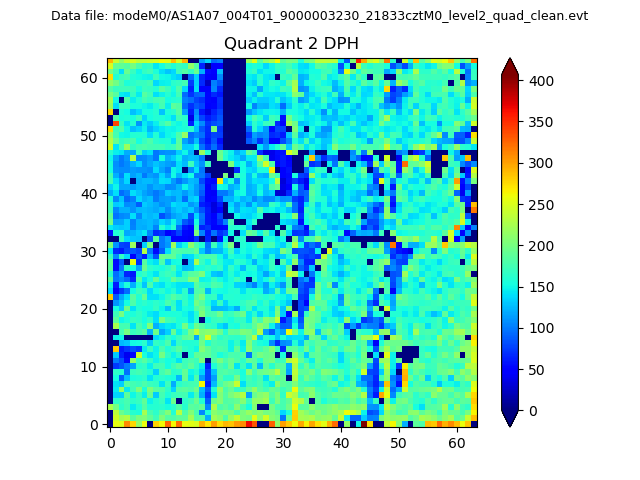
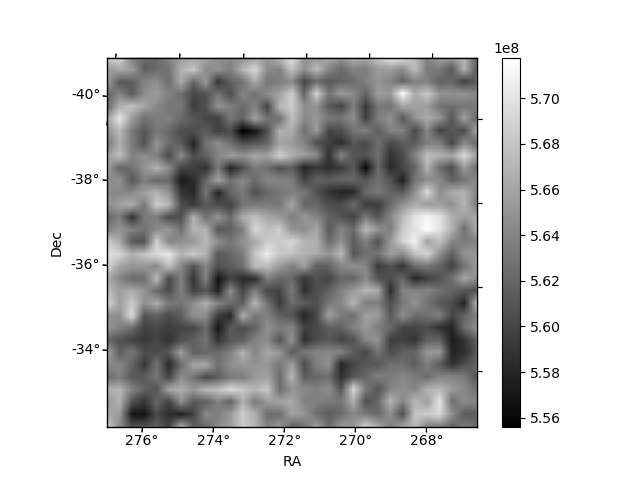
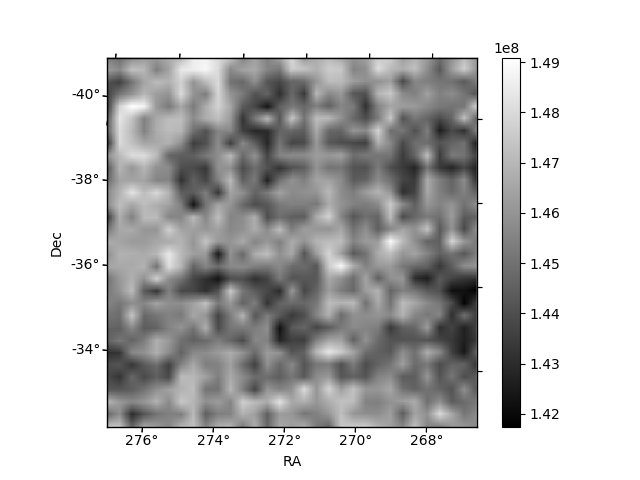
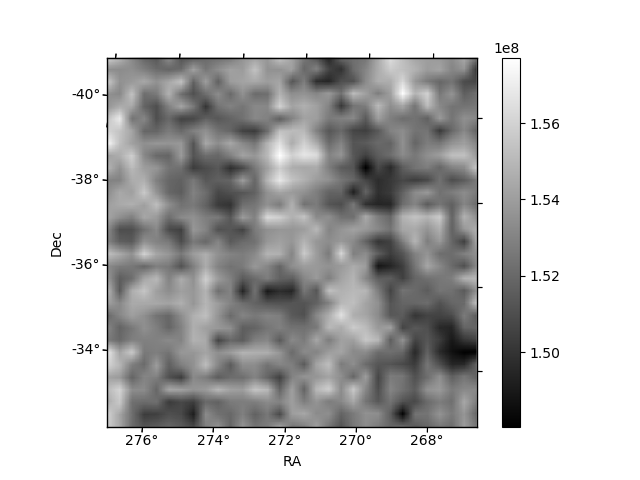
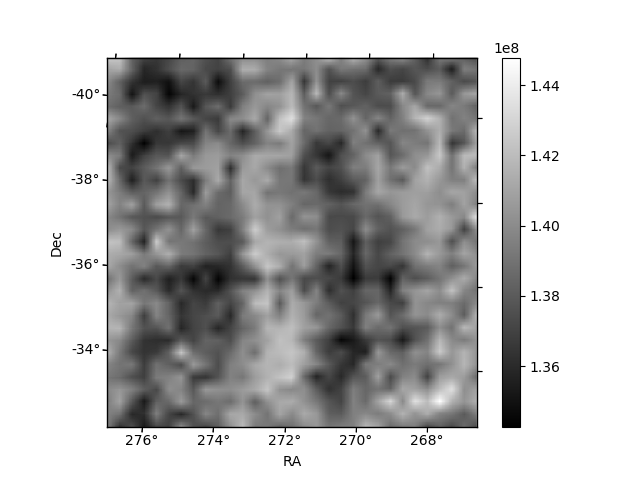
Histogram calculated using DETX and DETY for each event in the final _common_clean file
| Quadrant A | 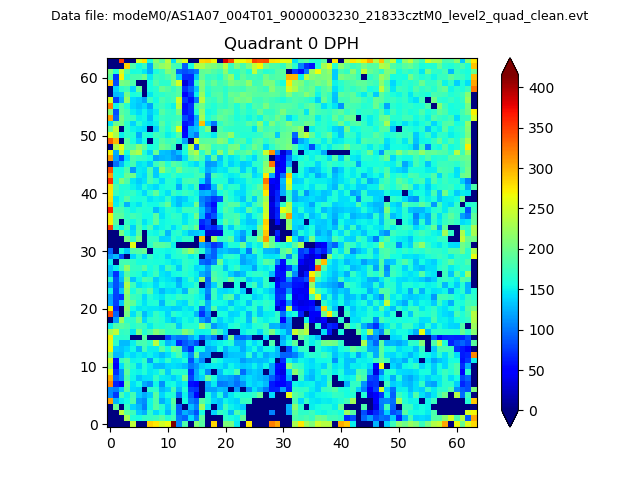 |
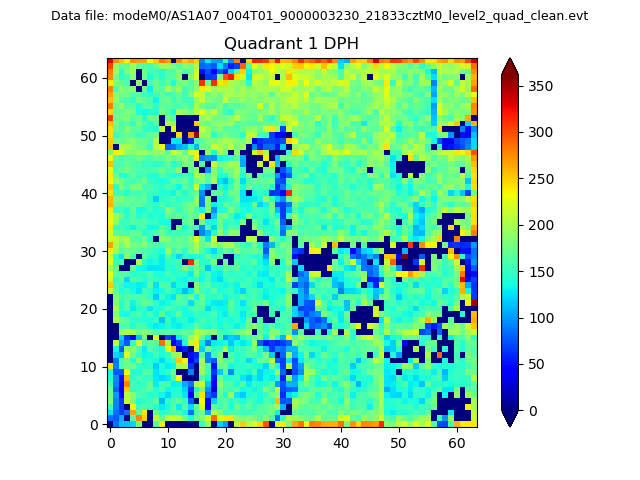 |
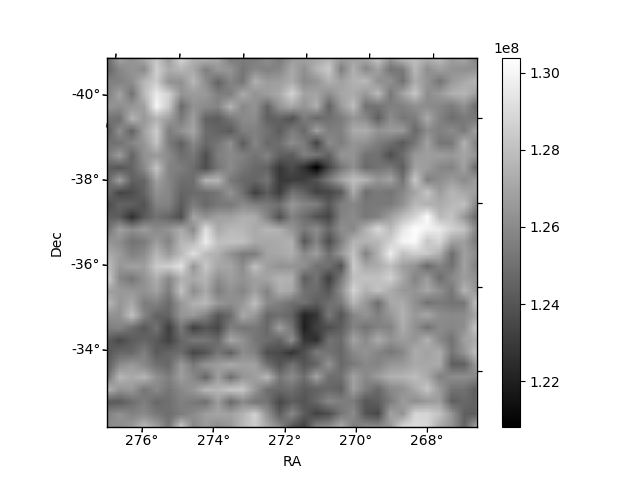
Quadrant B |
|---|---|---|---|
| Quadrant D | 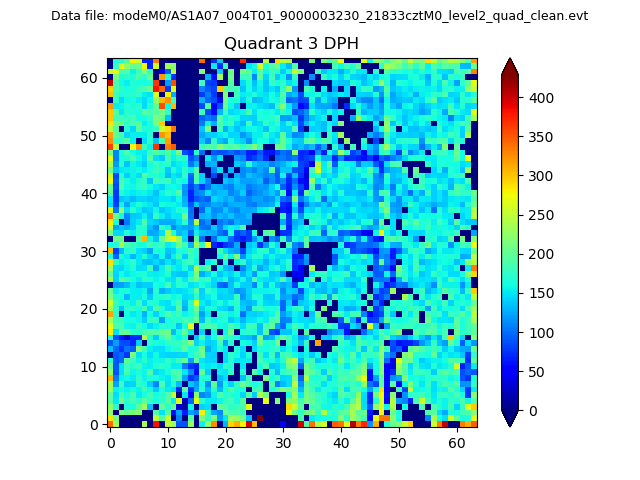 |
 |
Quadrant C |
| Plot type | Count rate plots | Images |
|---|---|---|
| Comparison with Poisson distribution Blue bars denote a histogram of data divided into 1 sec bins. Red curve is a Poisson curve with rate = median count rate of data. |
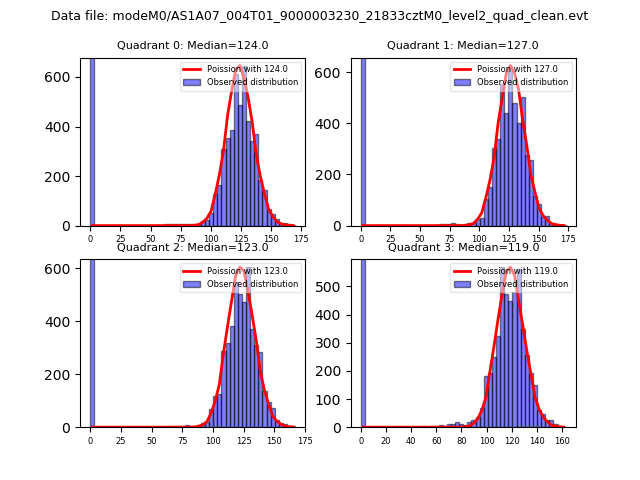 |
 |
| Quadrant-wise count rates Data is divided into 100 sec bins |
 |
|
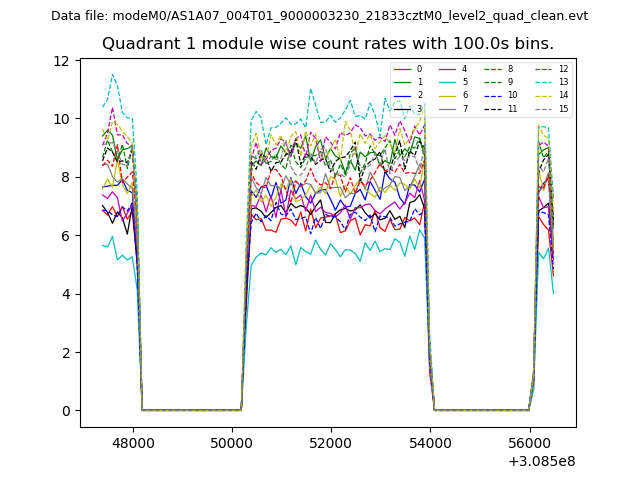
| Module-wise count rates for Quadrant A Data is divided into 100 sec bins |
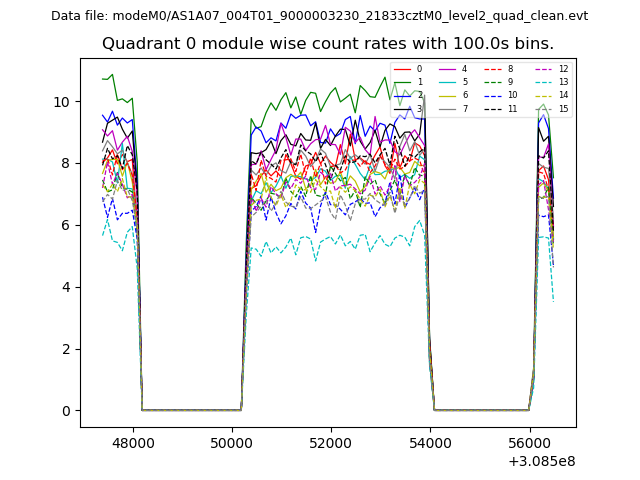 |
 |
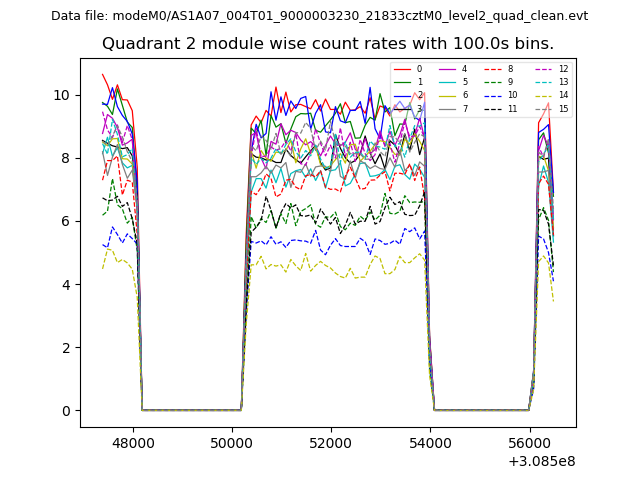
| Module-wise count rates for Quadrant B Data is divided into 100 sec bins |
 |
 |
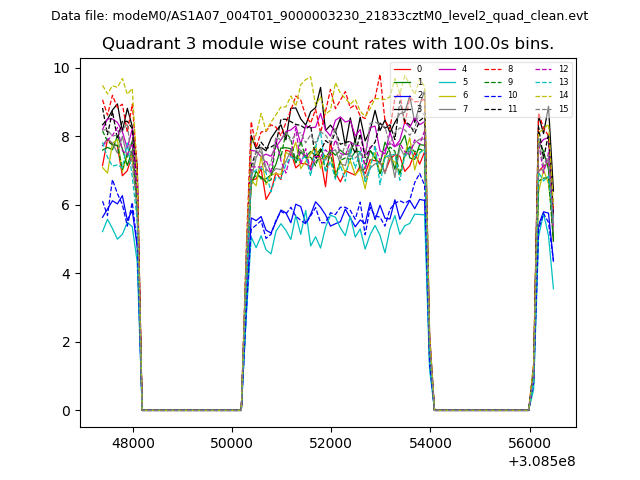
| Module-wise count rates for Quadrant C Data is divided into 100 sec bins |
 |
 |
| Module-wise count rates for Quadrant D Data is divided into 100 sec bins |
 |
 |
| Parameter | Plot |
|---|---|
| CZT HV Monitor | 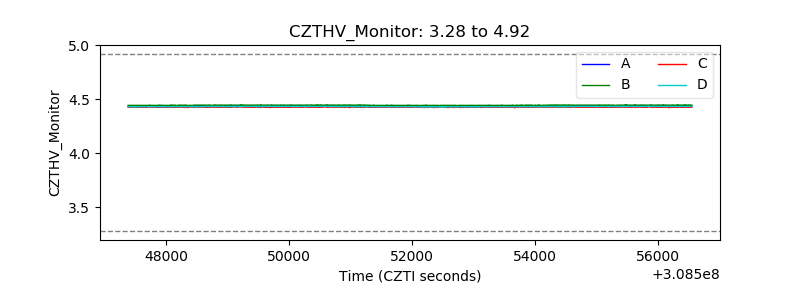 |
| D_VDD | 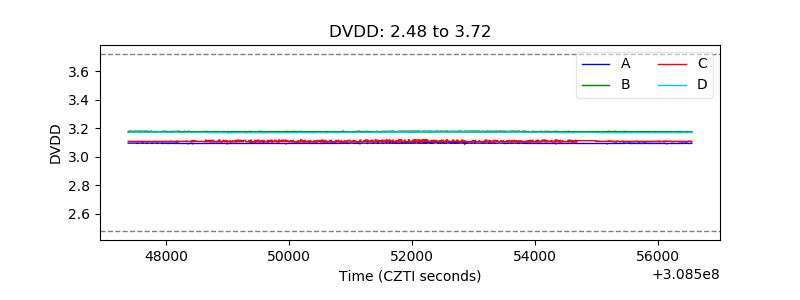 |
| Temperature 1 | 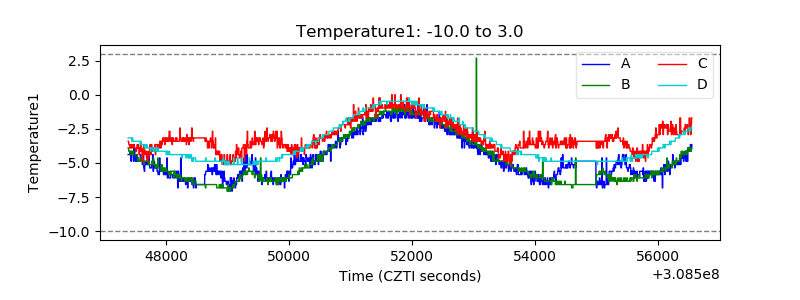 |
| Veto HV Monitor | 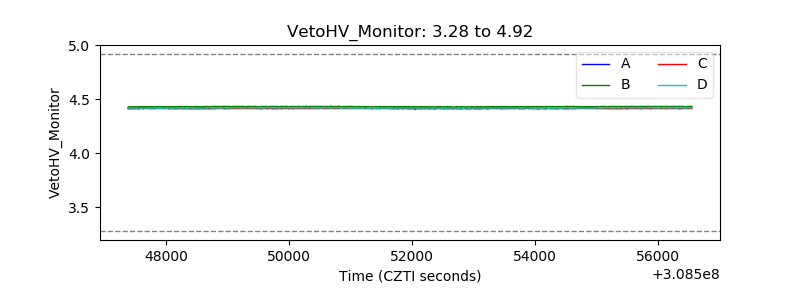 |
| Veto LLD | 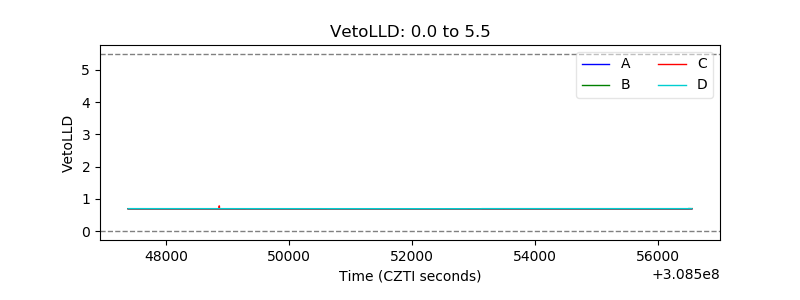 |
| Alpha Counter | 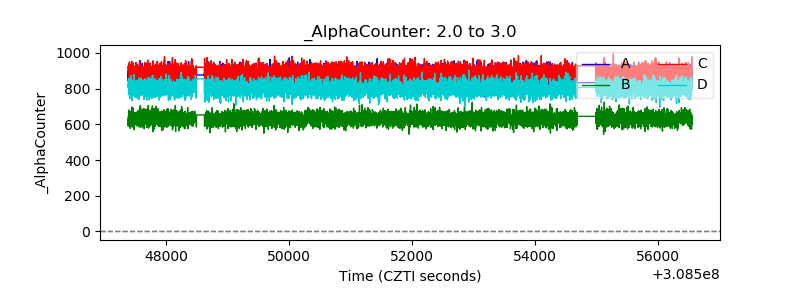 |
| _CPM_Rate |  |
| CZT Counter | 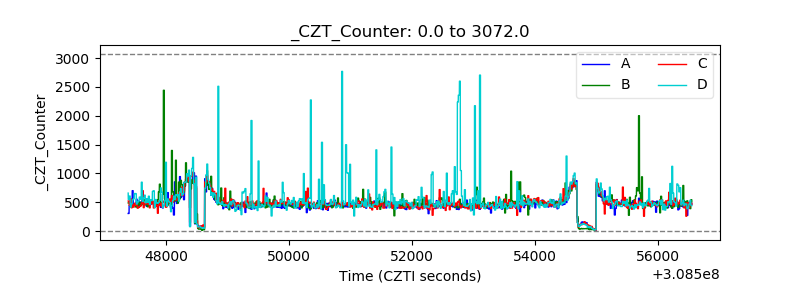 |
| +2.5 Volts monitor |  |
| +5 Volts monitor |  |
| _ROLL_ROT | 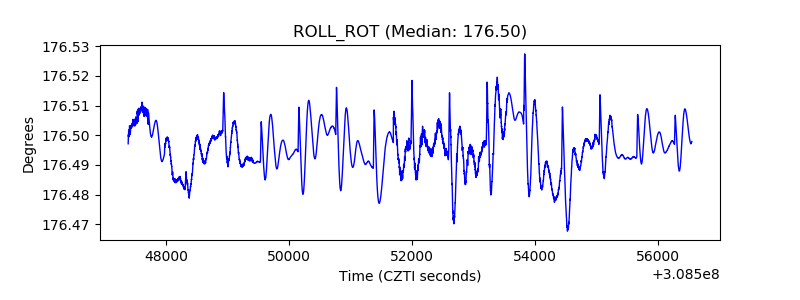 |
| _Roll_DEC | 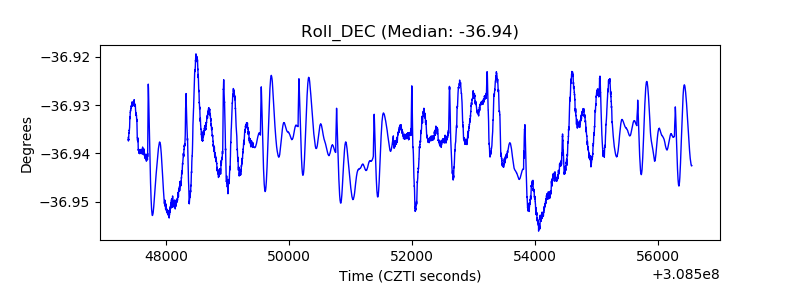 |
| _Roll_RA | 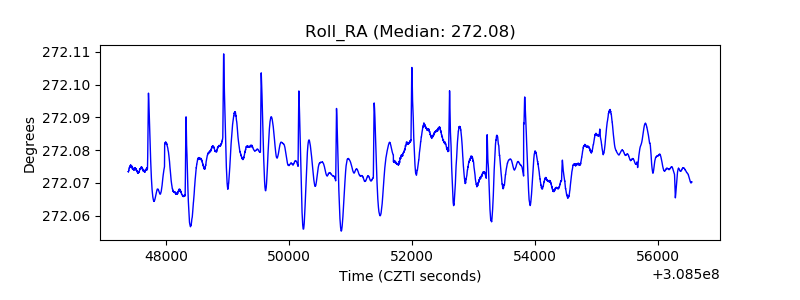 |
| Veto Counter | 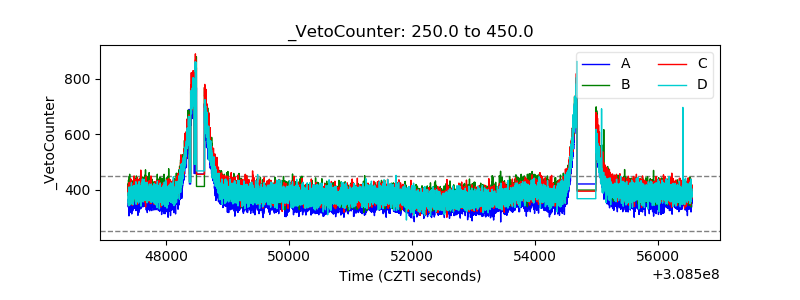 |