| Param | Original file | Final file |
|---|---|---|
| Filename | modeM0/AS1A07_004T01_9000003230_21836cztM0_level2.evt | modeM0/AS1A07_004T01_9000003230_21836cztM0_level2_quad_clean.evt |
| Size (bytes) | 1,249,741,440 | 246,778,560 |
| Size | 1.2 GB | 235.3 MB |
| Events in quadrant A | 8,533,187 | 1,570,877 |
| Events in quadrant B | 9,765,343 | 1,591,337 |
| Events in quadrant C | 8,592,820 | 1,551,062 |
| Events in quadrant D | 9,715,862 | 1,496,515 |
| Mode SS | |||
|---|---|---|---|
| Quadrant | BADHDUFLAG | Total packets | Discarded packets |
| A | 0 | 374 | 0 |
| B | 0 | 374 | 0 |
| C | 0 | 374 | 0 |
| D | 0 | 374 | 0 |
| Mode M0 | |||
|---|---|---|---|
| Quadrant | BADHDUFLAG | Total packets | Discarded packets |
| A | 0 | 37332 | 3 |
| B | 0 | 40314 | 3 |
| C | 0 | 37443 | 3 |
| D | 0 | 40866 | 3 |
| Mode M9 | |||
|---|---|---|---|
| Quadrant | BADHDUFLAG | Total packets | Discarded packets |
| A | 0 | 20 | 0 |
| B | 0 | 20 | 0 |
| C | 0 | 20 | 0 |
| D | 0 | 20 | 0 |
| Quadrant | Total seconds | Saturated seconds | Saturation percentage |
|---|---|---|---|
| A | 18350 | 170 | 0.926431% |
| B | 18351 | 384 | 2.092529% |
| C | 18351 | 254 | 1.384121% |
| D | 18351 | 241 | 1.313280% |
Noise dominated data is calculated using 1-second bins in cleaned event files. If a bin has >2000 counts, and if more than 50% of those come from <1% of pixels, then it is considered to be noise-dominated and hence unusable.
| Quadrant | # 1 sec bins | Bins with >0 counts | Bins with >2000 counts | High rate bins dominated by noise | Noise dominated (total time) | Noise dominated (detector-on time) | Marked lightcurve |
|---|---|---|---|---|---|---|---|
| A | 20345 | 18351 | 0 | 0 | 0.00% | 0.00% |  |
| B | 20346 | 18352 | 138 | 138 | 0.68% | 0.75% | 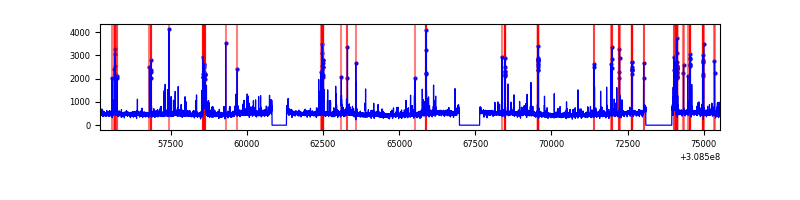 |
| C | 20346 | 18352 | 0 | 0 | 0.00% | 0.00% | 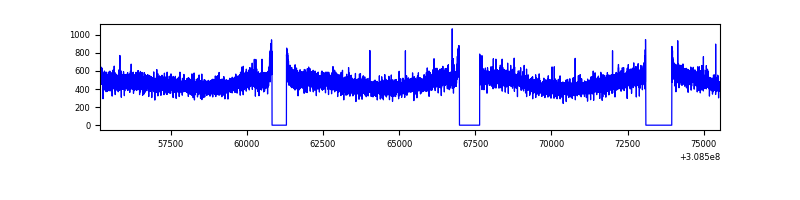 |
| D | 20346 | 18353 | 100 | 100 | 0.49% | 0.54% | 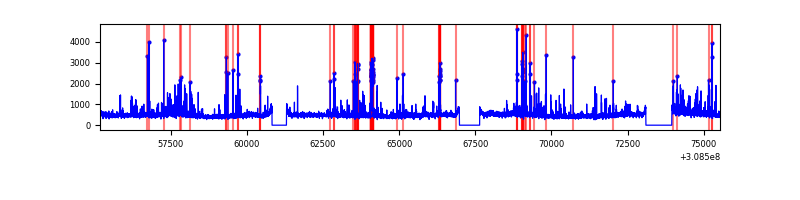 |
Top three noisy pixels from each quadrant. If the there are fewer than three noisy pixels in the level2.evt file, extra rows are filled as -1
| Pixel properties | Quadrant properties | ||||||
|---|---|---|---|---|---|---|---|
| Quadrant | DetID | PixID | Counts | Sigma | Mean | Median | Sigma |
| A | 13 | 254 | 34626 | 72.76 | 2209 | 2157 | 446.2 |
| A | 0 | 226 | 19165 | 38.11 | 2209 | 2157 | 446.2 |
| A | 3 | 137 | 18603 | 36.86 | 2209 | 2157 | 446.2 |
| B | 3 | 64 | 732623 | 1759.98 | 2194 | 2136 | 415.1 |
| B | 0 | 230 | 108267 | 255.7 | 2194 | 2136 | 415.1 |
| B | 0 | 190 | 73057 | 170.87 | 2194 | 2136 | 415.1 |
| C | 14 | 238 | 329699 | 660.76 | 2115 | 2127 | 495.8 |
| C | 13 | 61 | 14713 | 25.39 | 2115 | 2127 | 495.8 |
| C | 10 | 22 | 12265 | 20.45 | 2115 | 2127 | 495.8 |
| D | 1 | 52 | 1024171 | 1978.54 | 2138 | 2075 | 516.6 |
| D | 12 | 235 | 125491 | 238.9 | 2138 | 2075 | 516.6 |
| D | 5 | 32 | 119083 | 226.5 | 2138 | 2075 | 516.6 |
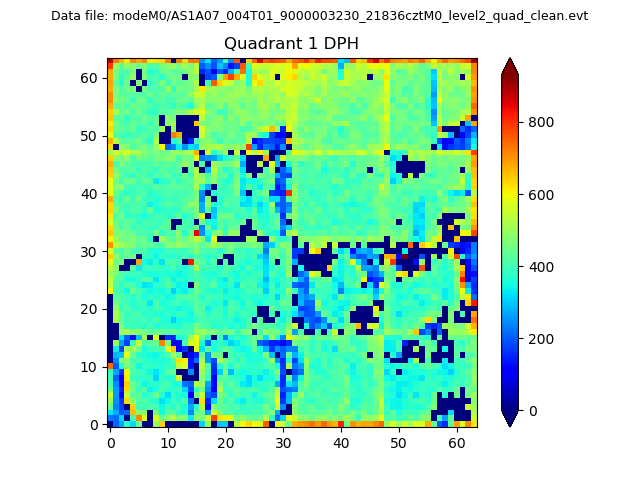
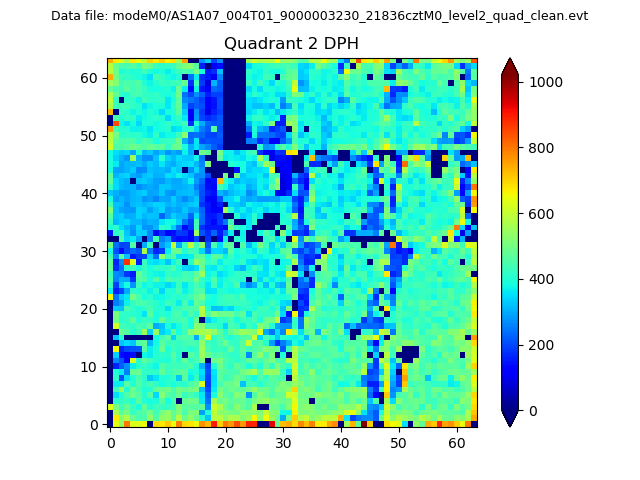
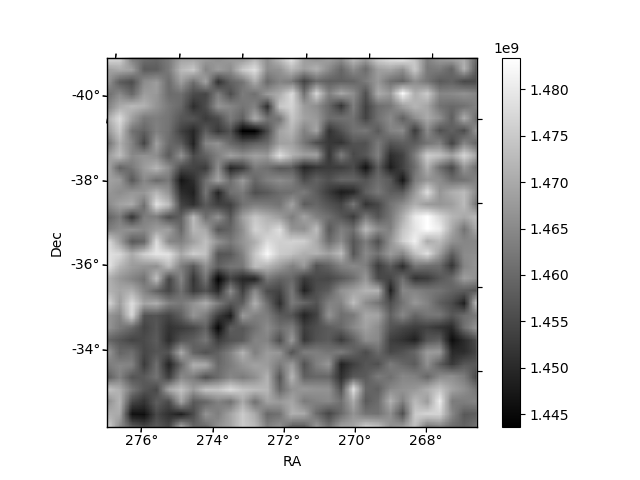
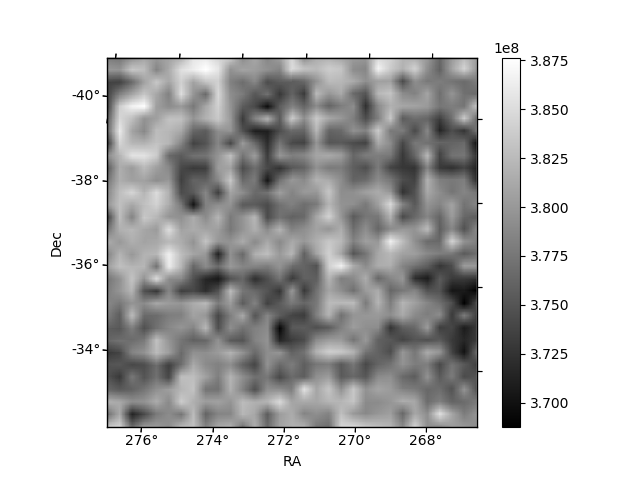
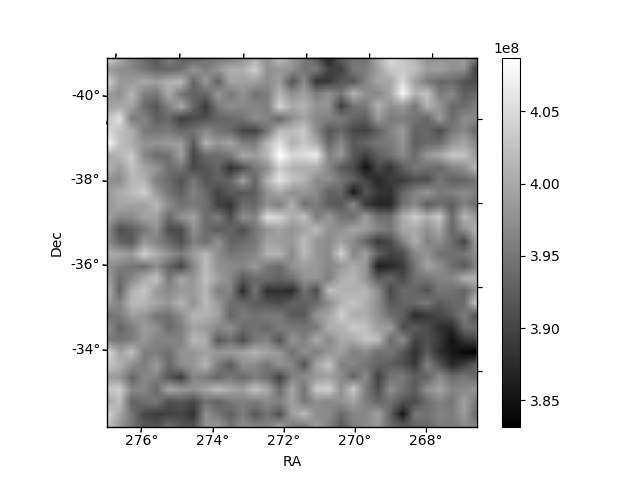
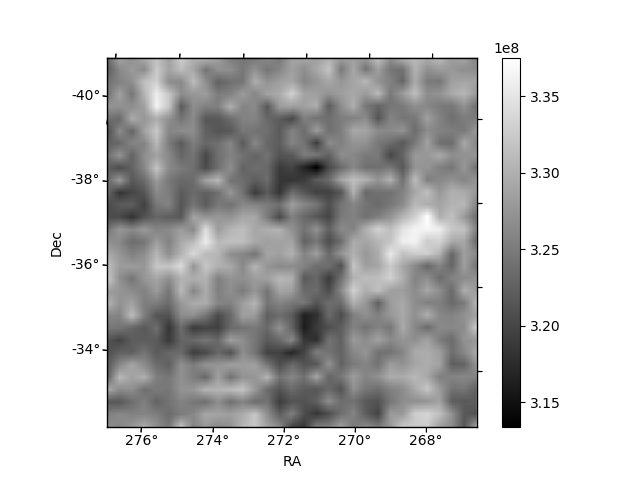
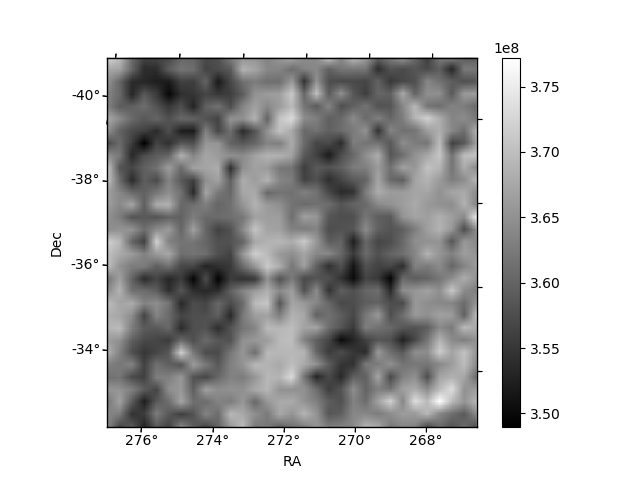
Histogram calculated using DETX and DETY for each event in the final _common_clean file
| Quadrant A | 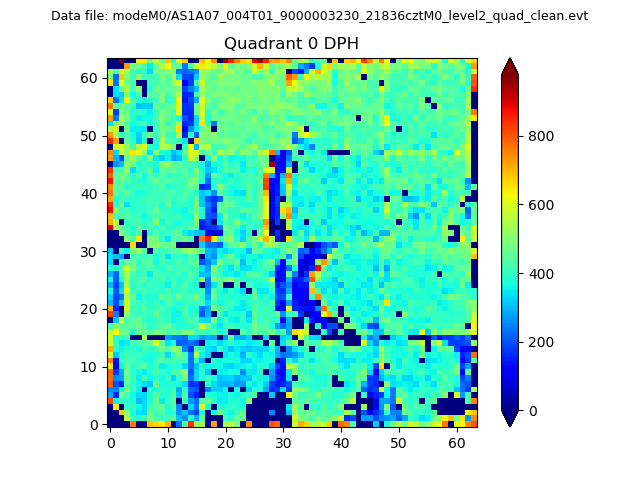 |
 |
Quadrant B |
|---|---|---|---|
| Quadrant D | 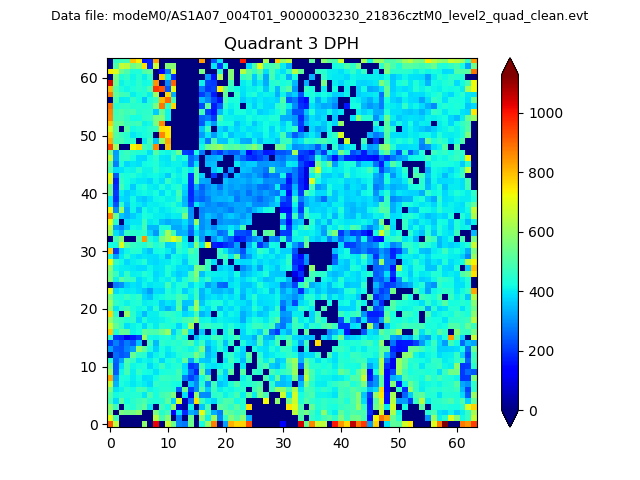 |
 |
Quadrant C |
| Plot type | Count rate plots | Images |
|---|---|---|
| Comparison with Poisson distribution Blue bars denote a histogram of data divided into 1 sec bins. Red curve is a Poisson curve with rate = median count rate of data. |
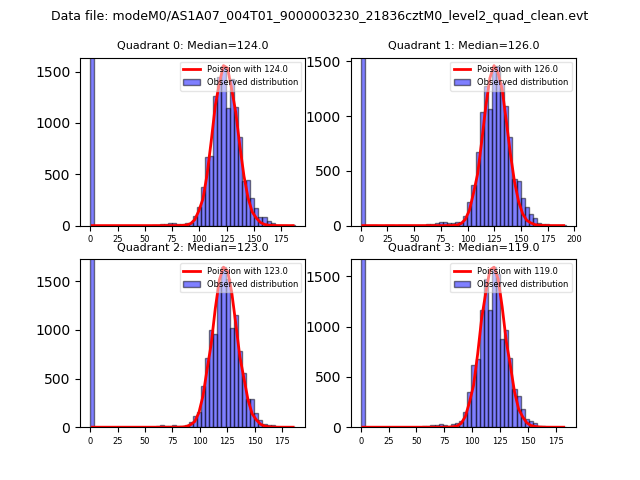 |
 |
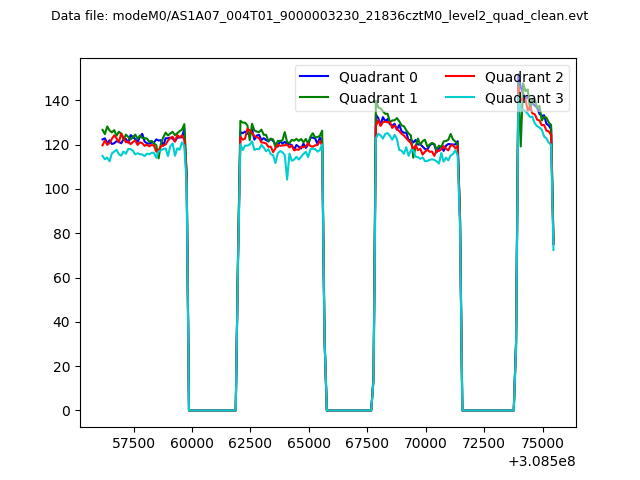
| Quadrant-wise count rates Data is divided into 100 sec bins |
 |
|
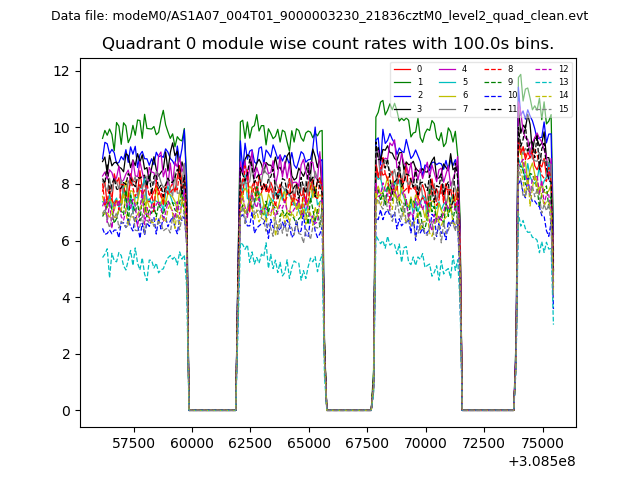
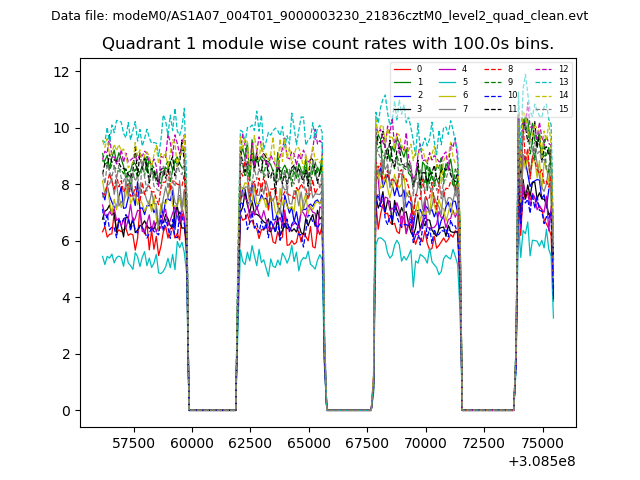
| Module-wise count rates for Quadrant A Data is divided into 100 sec bins |
 |
 |
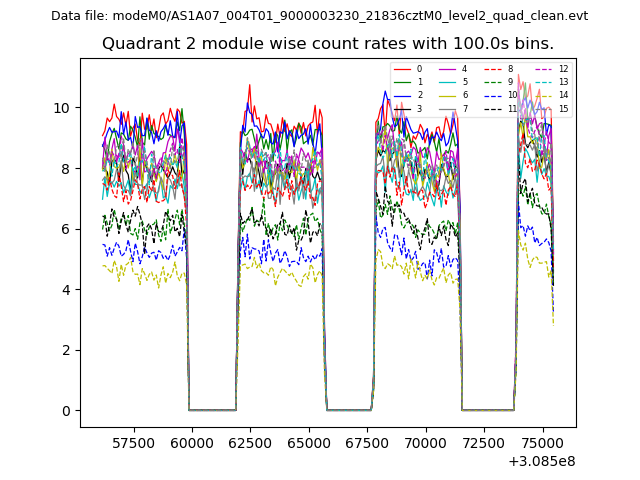
| Module-wise count rates for Quadrant B Data is divided into 100 sec bins |
 |
 |
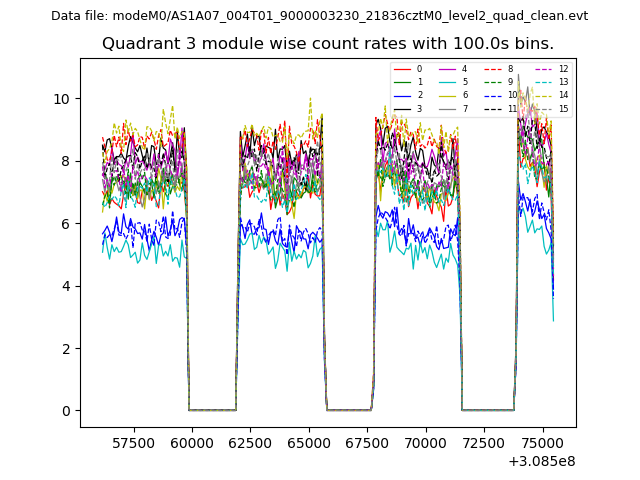
| Module-wise count rates for Quadrant C Data is divided into 100 sec bins |
 |
 |
| Module-wise count rates for Quadrant D Data is divided into 100 sec bins |
 |
 |
| Parameter | Plot |
|---|---|
| CZT HV Monitor | 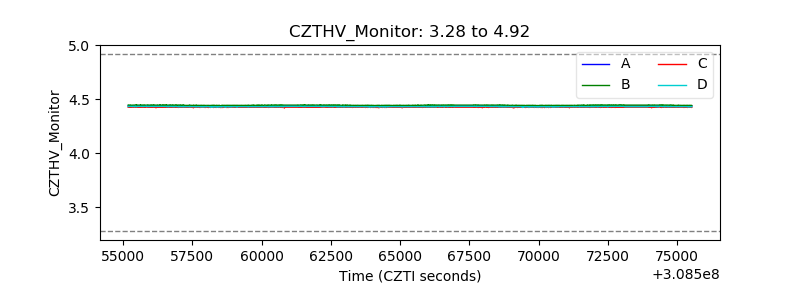 |
| D_VDD | 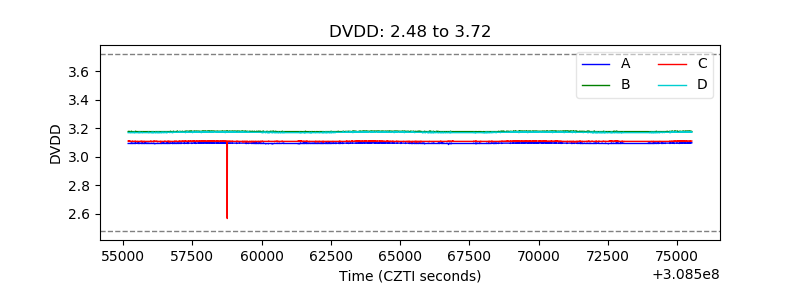 |
| Temperature 1 | 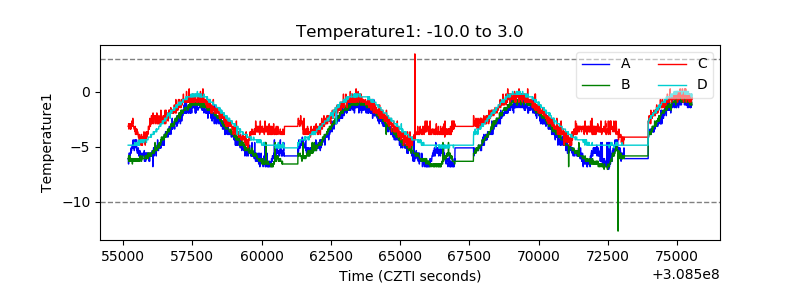 |
| Veto HV Monitor |  |
| Veto LLD | 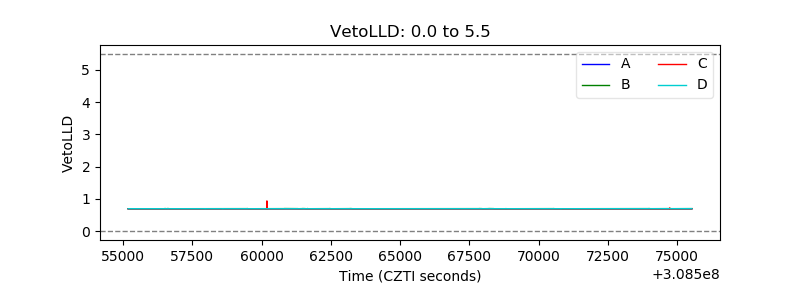 |
| Alpha Counter | 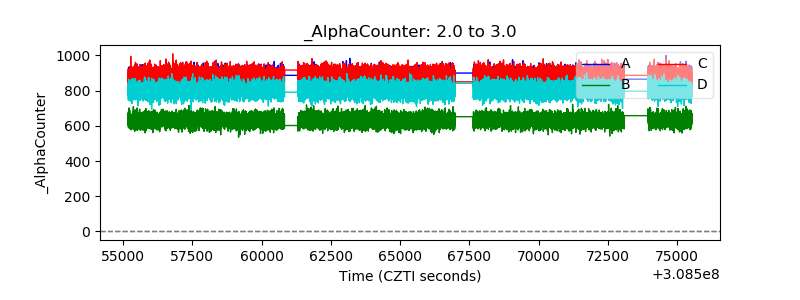 |
| _CPM_Rate | 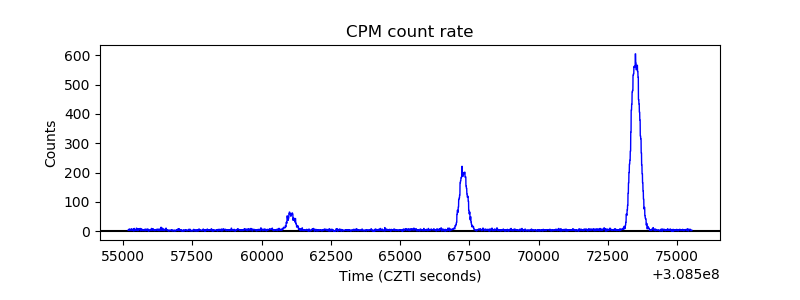 |
| CZT Counter | 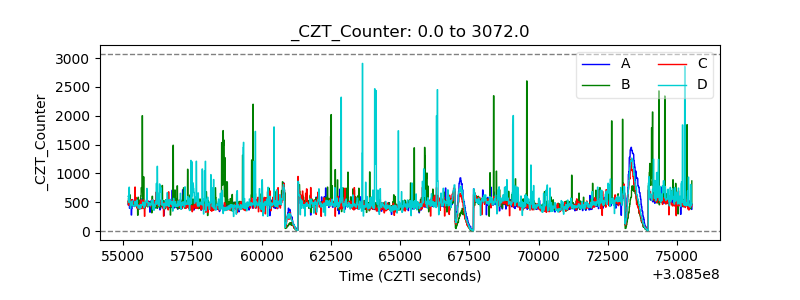 |
| +2.5 Volts monitor |  |
| +5 Volts monitor |  |
| _ROLL_ROT | 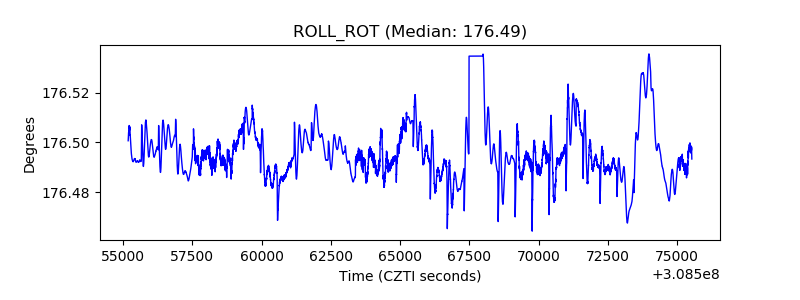 |
| _Roll_DEC | 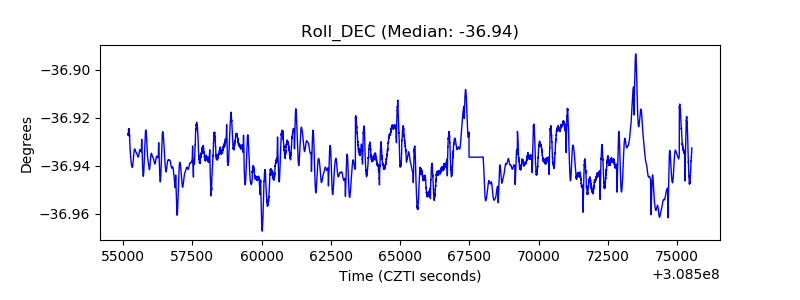 |
| _Roll_RA | 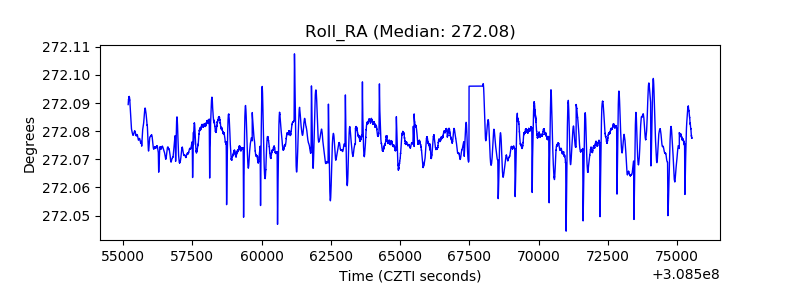 |
| Veto Counter | 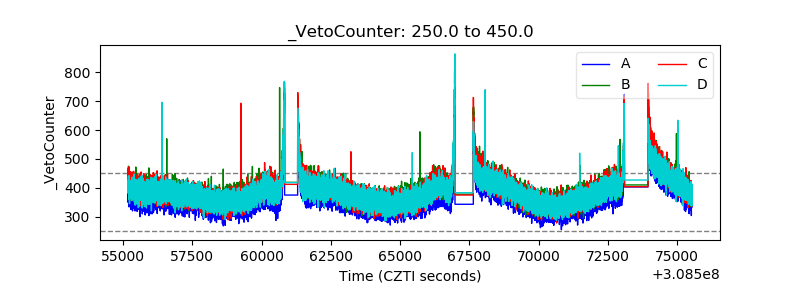 |