| Param | Original file | Final file |
|---|---|---|
| Filename | modeM0/AS1A07_004T01_9000003230_21839cztM0_level2.evt | modeM0/AS1A07_004T01_9000003230_21839cztM0_level2_quad_clean.evt |
| Size (bytes) | 522,184,320 | 92,649,600 |
| Size | 498.0 MB | 88.4 MB |
| Events in quadrant A | 3,406,504 | 609,196 |
| Events in quadrant B | 3,481,253 | 615,546 |
| Events in quadrant C | 3,158,492 | 587,764 |
| Events in quadrant D | 5,329,139 | 541,711 |
| Mode SS | |||
|---|---|---|---|
| Quadrant | BADHDUFLAG | Total packets | Discarded packets |
| A | 0 | 132 | 0 |
| B | 0 | 132 | 0 |
| C | 0 | 132 | 0 |
| D | 0 | 132 | 0 |
| Mode M0 | |||
|---|---|---|---|
| Quadrant | BADHDUFLAG | Total packets | Discarded packets |
| A | 0 | 14407 | 2 |
| B | 0 | 14673 | 2 |
| C | 0 | 13628 | 2 |
| D | 0 | 20257 | 2 |
| Mode M9 | |||
|---|---|---|---|
| Quadrant | BADHDUFLAG | Total packets | Discarded packets |
| A | 0 | 11 | 0 |
| B | 0 | 11 | 0 |
| C | 0 | 11 | 0 |
| D | 0 | 11 | 0 |
| Quadrant | Total seconds | Saturated seconds | Saturation percentage |
|---|---|---|---|
| A | 6468 | 91 | 1.406926% |
| B | 6469 | 118 | 1.824084% |
| C | 6469 | 83 | 1.283042% |
| D | 6469 | 495 | 7.651878% |
Noise dominated data is calculated using 1-second bins in cleaned event files. If a bin has >2000 counts, and if more than 50% of those come from <1% of pixels, then it is considered to be noise-dominated and hence unusable.
| Quadrant | # 1 sec bins | Bins with >0 counts | Bins with >2000 counts | High rate bins dominated by noise | Noise dominated (total time) | Noise dominated (detector-on time) | Marked lightcurve |
|---|---|---|---|---|---|---|---|
| A | 7573 | 6468 | 16 | 16 | 0.21% | 0.25% | 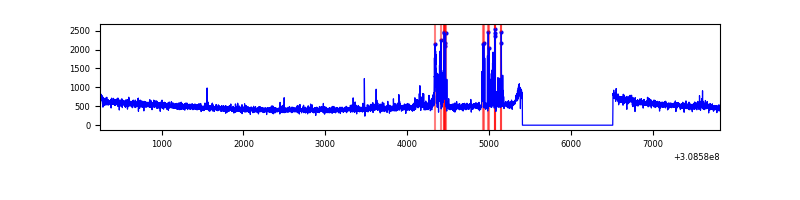 |
| B | 7574 | 6469 | 30 | 30 | 0.40% | 0.46% | 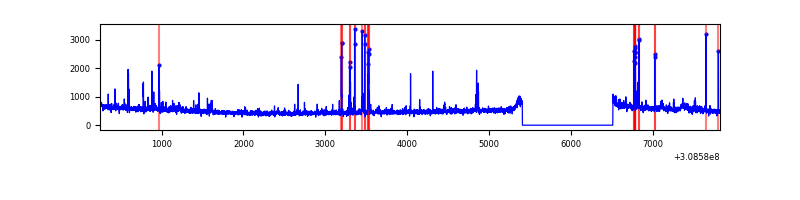 |
| C | 7574 | 6469 | 0 | 0 | 0.00% | 0.00% | 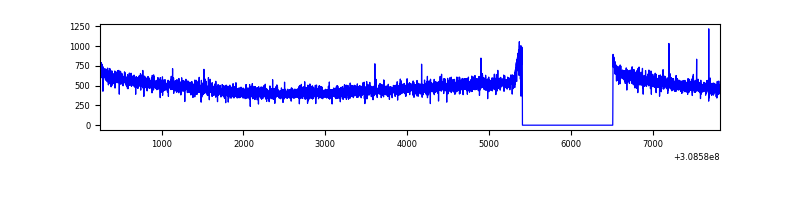 |
| D | 7574 | 6469 | 338 | 338 | 4.46% | 5.22% | 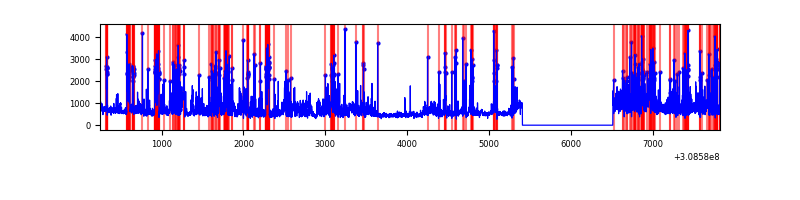 |
Top three noisy pixels from each quadrant. If the there are fewer than three noisy pixels in the level2.evt file, extra rows are filled as -1
| Pixel properties | Quadrant properties | ||||||
|---|---|---|---|---|---|---|---|
| Quadrant | DetID | PixID | Counts | Sigma | Mean | Median | Sigma |
| A | 14 | 235 | 199748 | 1203.92 | 820 | 802 | 165.2 |
| A | 5 | 16 | 32864 | 194.02 | 820 | 802 | 165.2 |
| A | 13 | 254 | 13066 | 74.22 | 820 | 802 | 165.2 |
| B | 3 | 64 | 148345 | 933.17 | 818 | 797 | 158.1 |
| B | 0 | 245 | 27312 | 167.69 | 818 | 797 | 158.1 |
| B | 0 | 189 | 22897 | 139.77 | 818 | 797 | 158.1 |
| C | 14 | 238 | 123147 | 674.59 | 777 | 781 | 181.4 |
| C | 13 | 61 | 5704 | 27.14 | 777 | 781 | 181.4 |
| C | 4 | 175 | 4092 | 18.25 | 777 | 781 | 181.4 |
| D | 1 | 52 | 2101991 | 10443.87 | 758 | 741 | 201.2 |
| D | 14 | 35 | 163155 | 807.25 | 758 | 741 | 201.2 |
| D | 5 | 32 | 52934 | 259.42 | 758 | 741 | 201.2 |
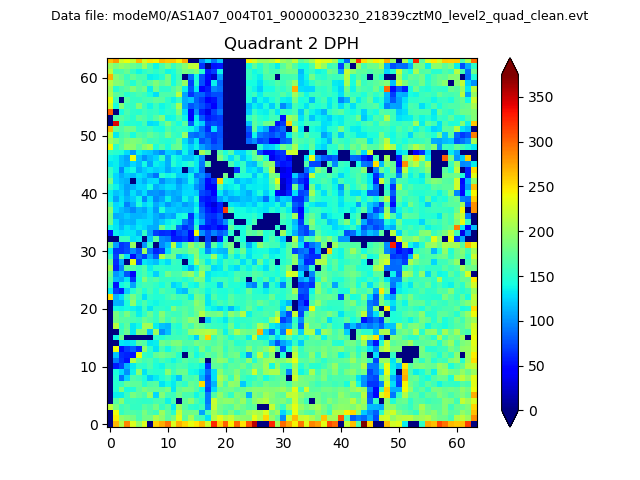
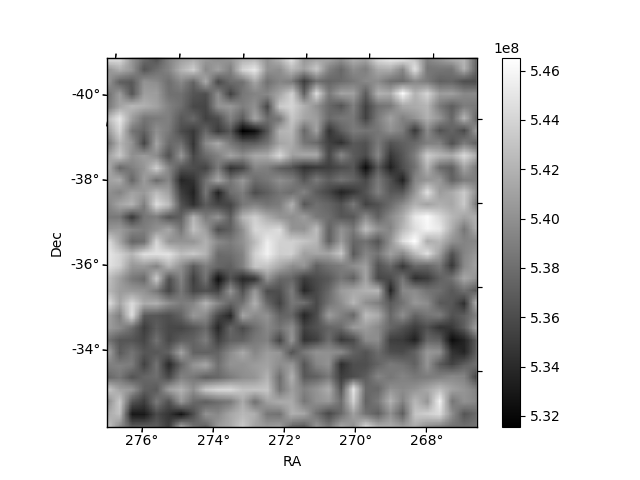
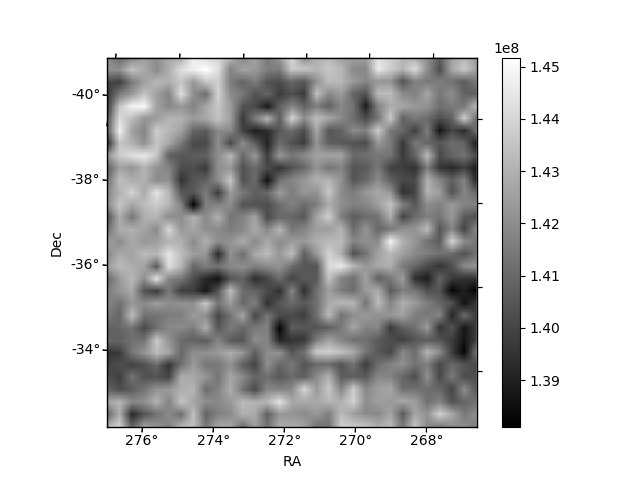
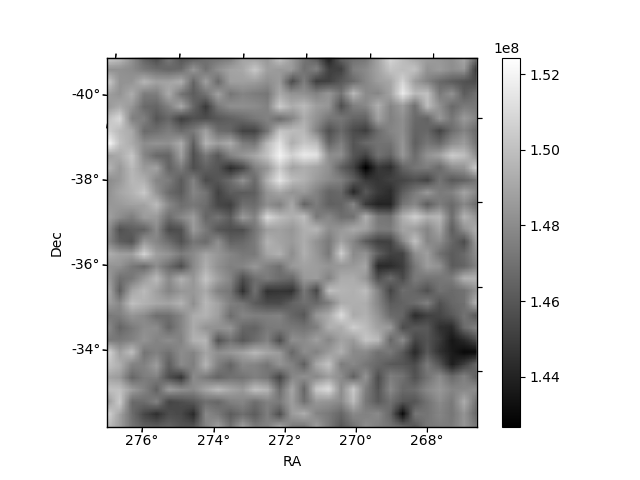
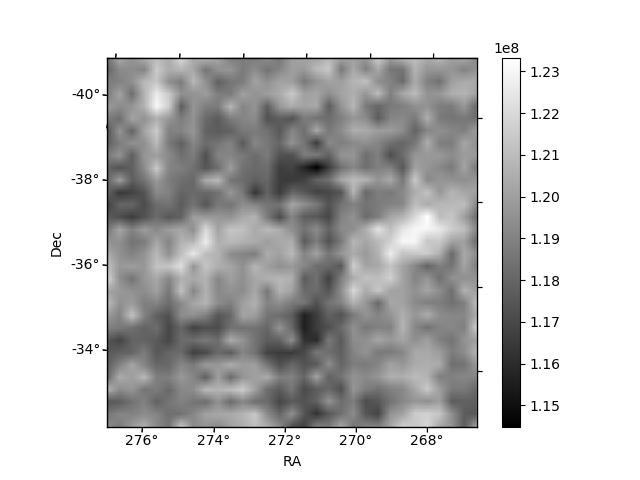
Histogram calculated using DETX and DETY for each event in the final _common_clean file
| Quadrant A | 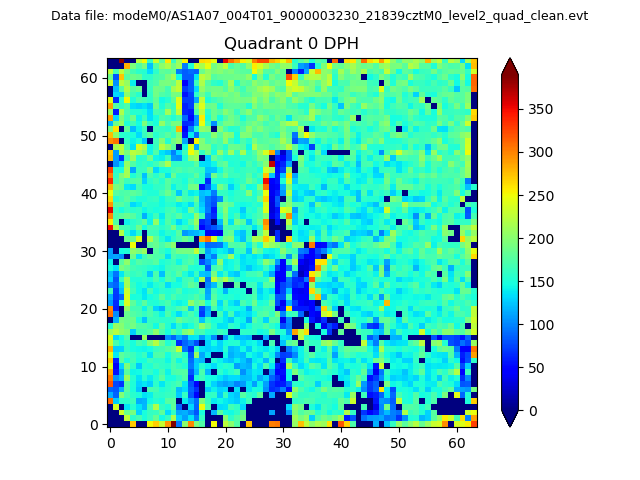 |
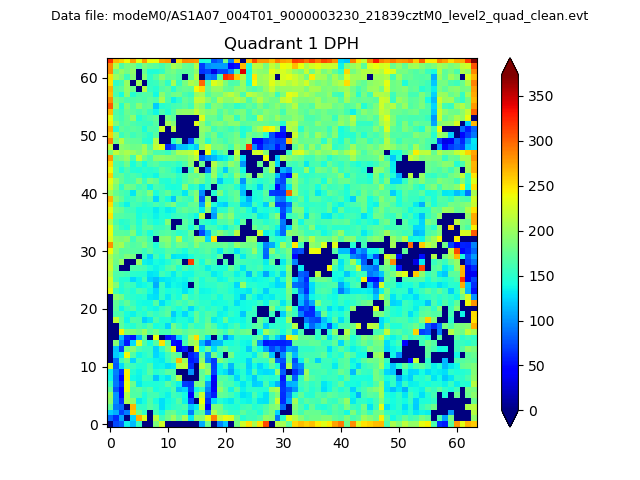 |
Quadrant B |
|---|---|---|---|
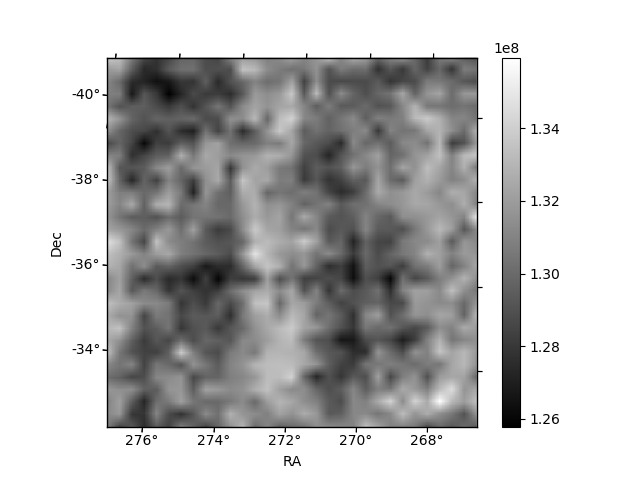
| Quadrant D | 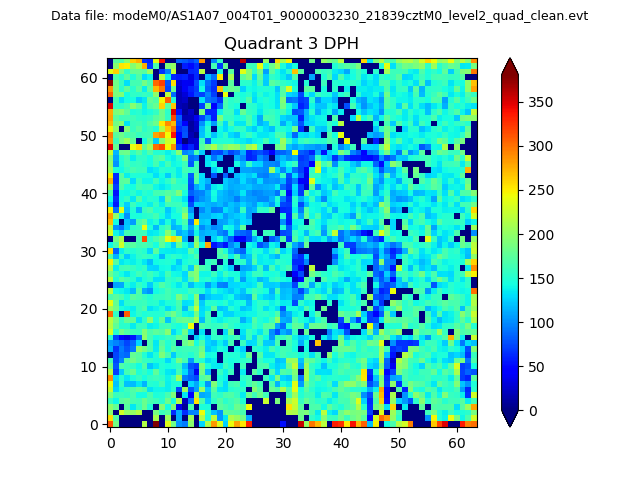 |
 |
Quadrant C |
| Plot type | Count rate plots | Images |
|---|---|---|
| Comparison with Poisson distribution Blue bars denote a histogram of data divided into 1 sec bins. Red curve is a Poisson curve with rate = median count rate of data. |
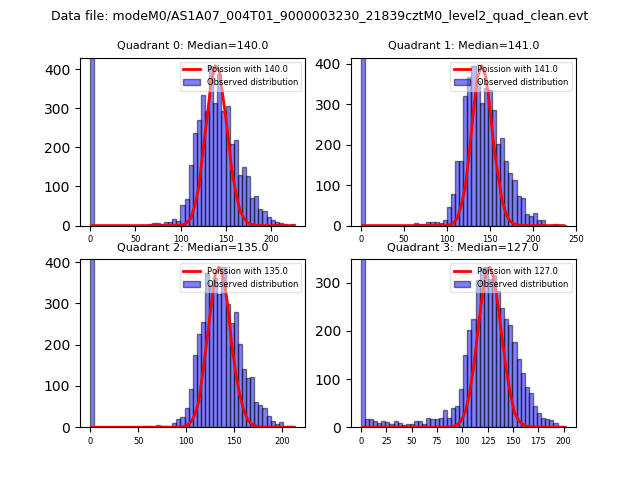 |
 |
| Quadrant-wise count rates Data is divided into 100 sec bins |
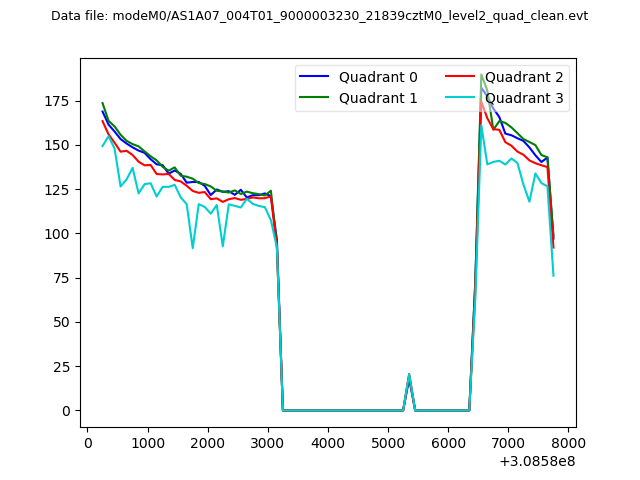 |
|
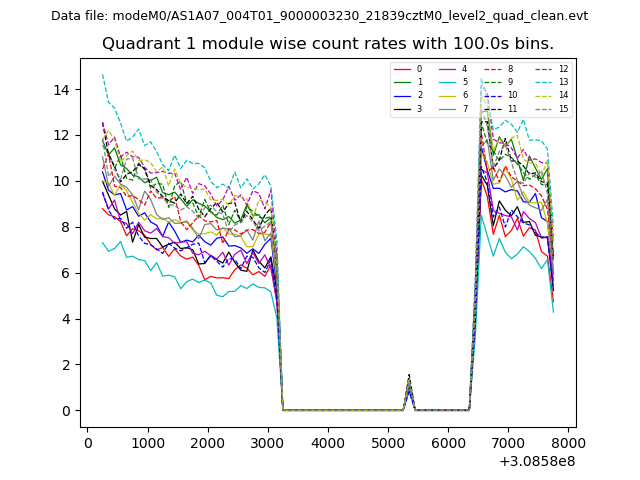
| Module-wise count rates for Quadrant A Data is divided into 100 sec bins |
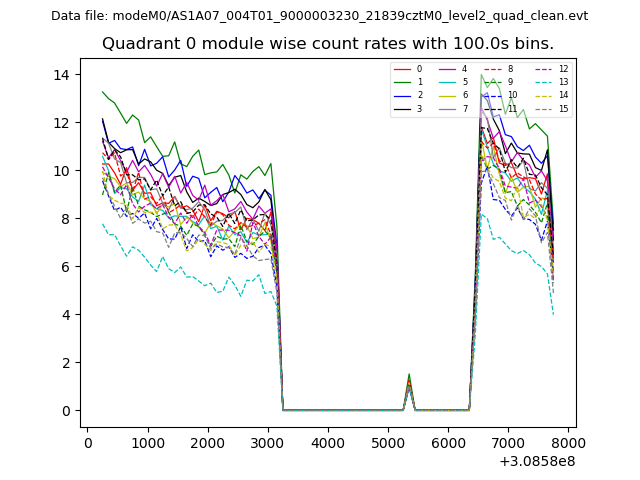 |
 |
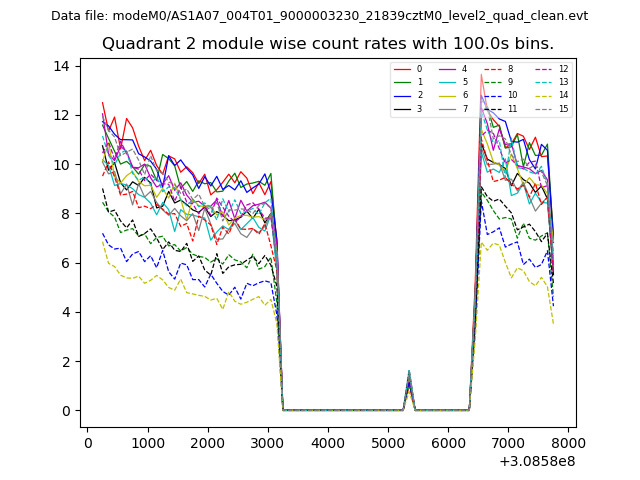
| Module-wise count rates for Quadrant B Data is divided into 100 sec bins |
 |
 |
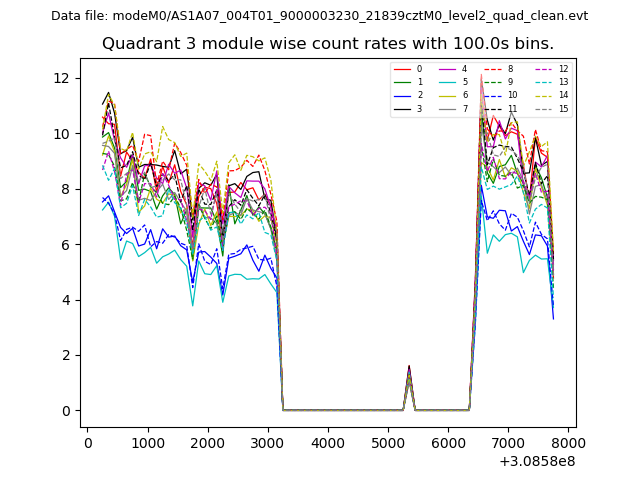
| Module-wise count rates for Quadrant C Data is divided into 100 sec bins |
 |
 |
| Module-wise count rates for Quadrant D Data is divided into 100 sec bins |
 |
 |
| Parameter | Plot |
|---|---|
| CZT HV Monitor | 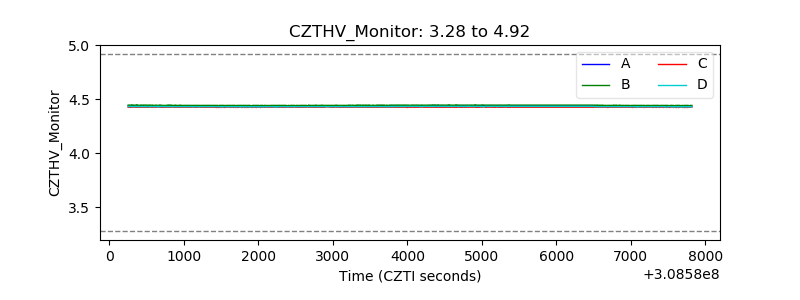 |
| D_VDD | 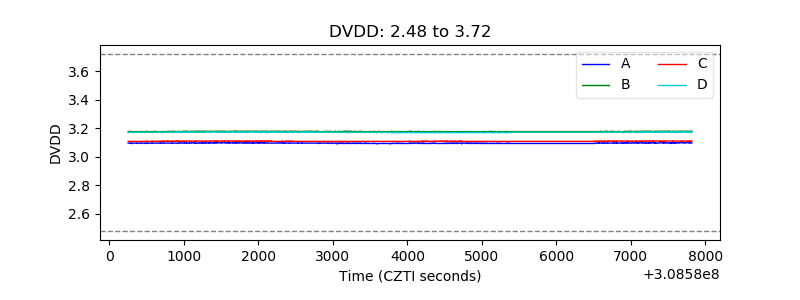 |
| Temperature 1 | 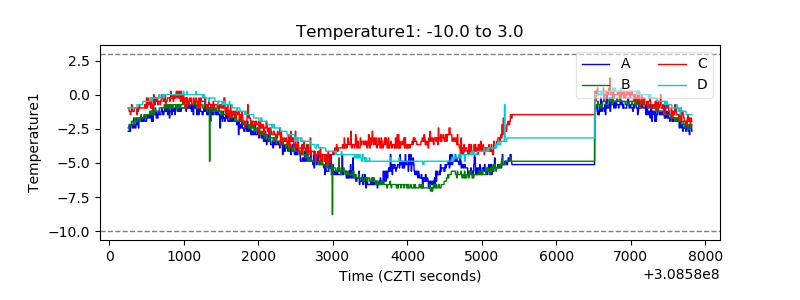 |
| Veto HV Monitor |  |
| Veto LLD |  |
| Alpha Counter | 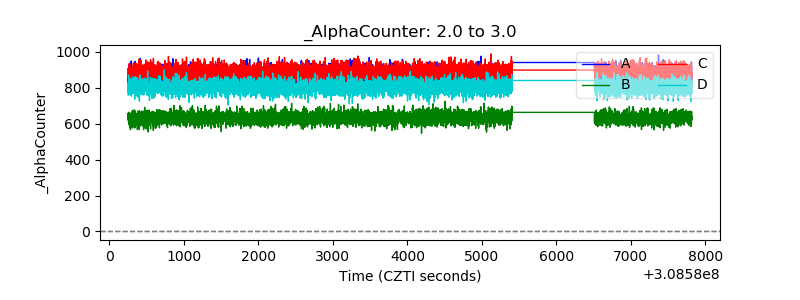 |
| _CPM_Rate | 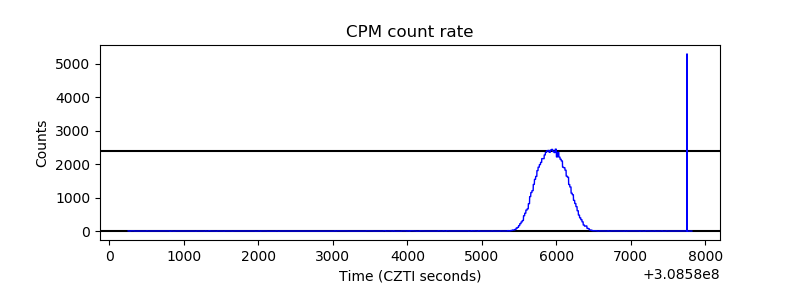 |
| CZT Counter | 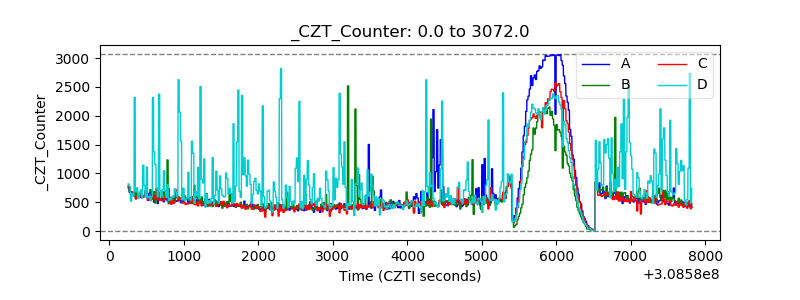 |
| +2.5 Volts monitor |  |
| +5 Volts monitor |  |
| _ROLL_ROT | 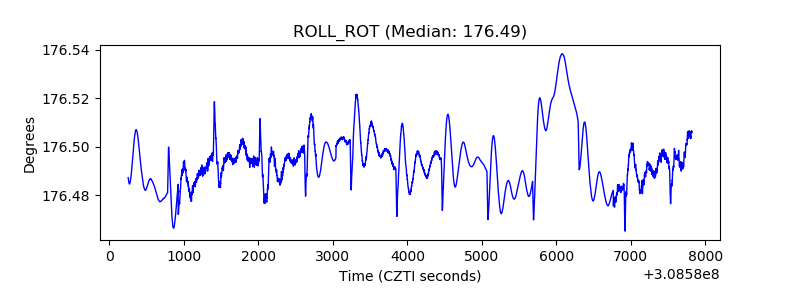 |
| _Roll_DEC | 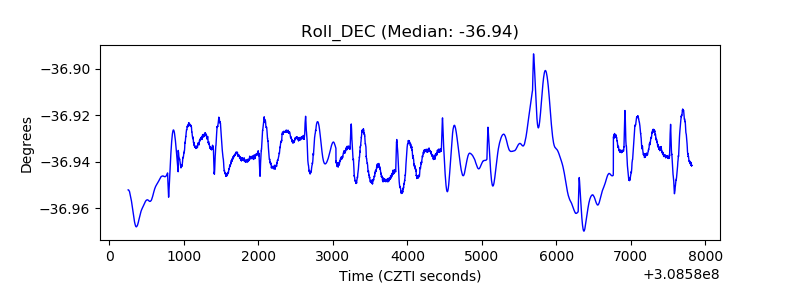 |
| _Roll_RA | 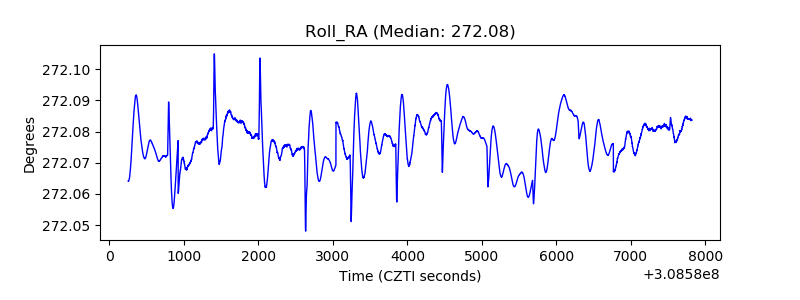 |
| Veto Counter | 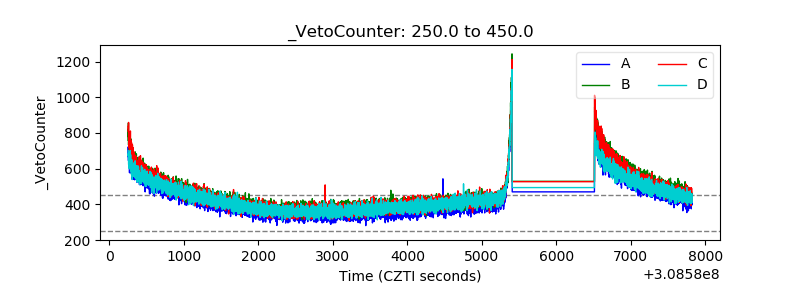 |