| Param | Original file | Final file |
|---|---|---|
| Filename | modeM0/AS1A07_004T01_9000003230_21842cztM0_level2.evt | modeM0/AS1A07_004T01_9000003230_21842cztM0_level2_quad_clean.evt |
| Size (bytes) | 485,510,400 | 95,175,360 |
| Size | 463.0 MB | 90.8 MB |
| Events in quadrant A | 3,159,151 | 627,175 |
| Events in quadrant B | 3,825,233 | 629,507 |
| Events in quadrant C | 3,238,890 | 615,457 |
| Events in quadrant D | 4,059,457 | 576,980 |
| Mode SS | |||
|---|---|---|---|
| Quadrant | BADHDUFLAG | Total packets | Discarded packets |
| A | 0 | 126 | 0 |
| B | 0 | 126 | 0 |
| C | 0 | 126 | 0 |
| D | 0 | 126 | 0 |
| Mode M0 | |||
|---|---|---|---|
| Quadrant | BADHDUFLAG | Total packets | Discarded packets |
| A | 0 | 13190 | 2 |
| B | 0 | 15183 | 2 |
| C | 0 | 13280 | 2 |
| D | 0 | 16062 | 2 |
| Mode M9 | |||
|---|---|---|---|
| Quadrant | BADHDUFLAG | Total packets | Discarded packets |
| A | 0 | 23 | 0 |
| B | 0 | 24 | 0 |
| C | 0 | 24 | 0 |
| D | 0 | 24 | 0 |
| Quadrant | Total seconds | Saturated seconds | Saturation percentage |
|---|---|---|---|
| A | 6204 | 25 | 0.402966% |
| B | 6204 | 240 | 3.868472% |
| C | 6204 | 65 | 1.047711% |
| D | 6204 | 133 | 2.143778% |
Noise dominated data is calculated using 1-second bins in cleaned event files. If a bin has >2000 counts, and if more than 50% of those come from <1% of pixels, then it is considered to be noise-dominated and hence unusable.
| Quadrant | # 1 sec bins | Bins with >0 counts | Bins with >2000 counts | High rate bins dominated by noise | Noise dominated (total time) | Noise dominated (detector-on time) | Marked lightcurve |
|---|---|---|---|---|---|---|---|
| A | 7564 | 6205 | 0 | 0 | 0.00% | 0.00% | 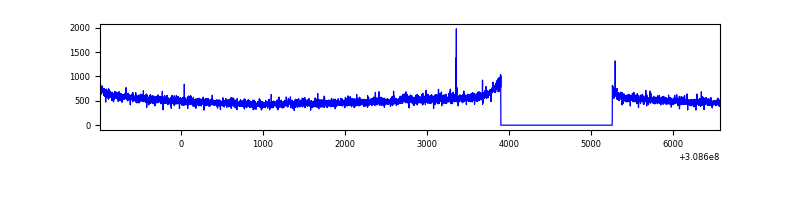 |
| B | 7564 | 6205 | 164 | 164 | 2.17% | 2.64% | 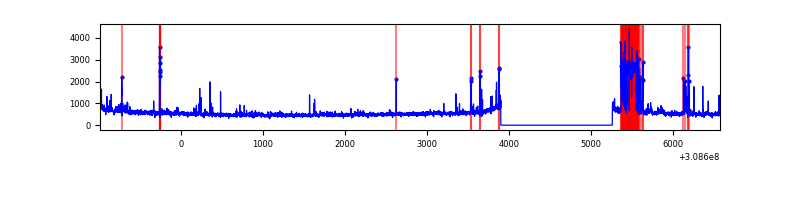 |
| C | 7564 | 6205 | 0 | 0 | 0.00% | 0.00% | 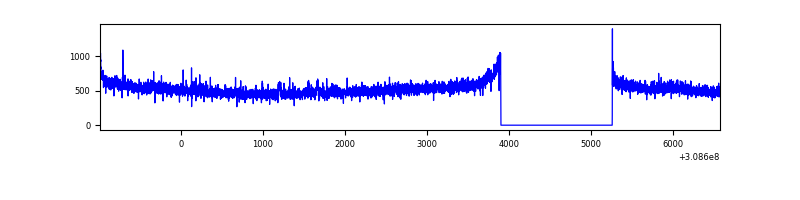 |
| D | 7564 | 6205 | 113 | 113 | 1.49% | 1.82% | 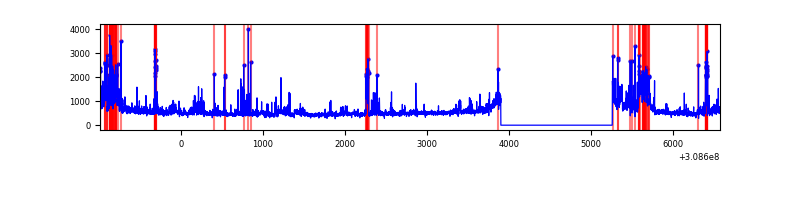 |
Top three noisy pixels from each quadrant. If the there are fewer than three noisy pixels in the level2.evt file, extra rows are filled as -1
| Pixel properties | Quadrant properties | ||||||
|---|---|---|---|---|---|---|---|
| Quadrant | DetID | PixID | Counts | Sigma | Mean | Median | Sigma |
| A | 14 | 235 | 26176 | 155.49 | 813 | 801 | 163.2 |
| A | 13 | 254 | 12148 | 69.53 | 813 | 801 | 163.2 |
| A | 0 | 226 | 7234 | 39.42 | 813 | 801 | 163.2 |
| B | 3 | 64 | 525358 | 3483.13 | 805 | 788 | 150.6 |
| B | 0 | 230 | 36779 | 238.98 | 805 | 788 | 150.6 |
| B | 0 | 190 | 36168 | 234.92 | 805 | 788 | 150.6 |
| C | 14 | 238 | 123880 | 682.19 | 777 | 782 | 180.4 |
| C | 3 | 248 | 75693 | 415.15 | 777 | 782 | 180.4 |
| C | 0 | 10 | 6206 | 30.06 | 777 | 782 | 180.4 |
| D | 1 | 52 | 291238 | 1565.33 | 769 | 749 | 185.6 |
| D | 7 | 38 | 280879 | 1509.51 | 769 | 749 | 185.6 |
| D | 12 | 227 | 191122 | 1025.84 | 769 | 749 | 185.6 |
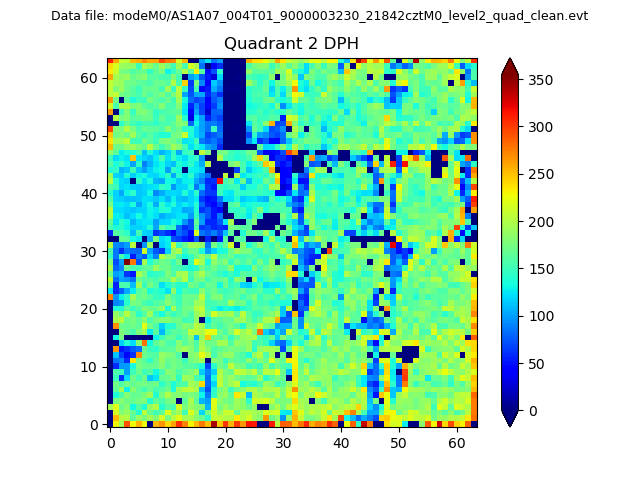
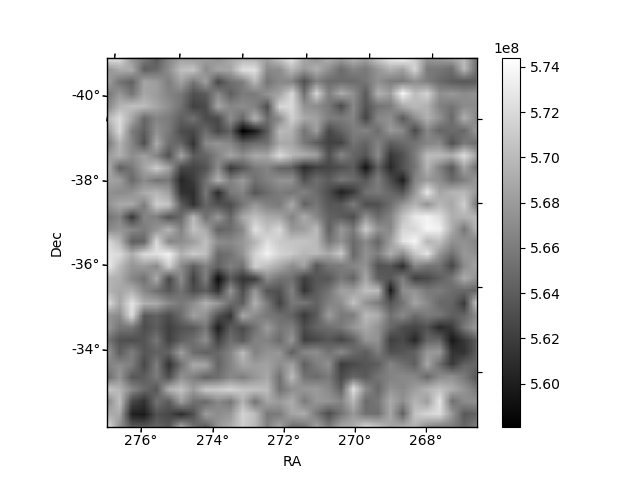
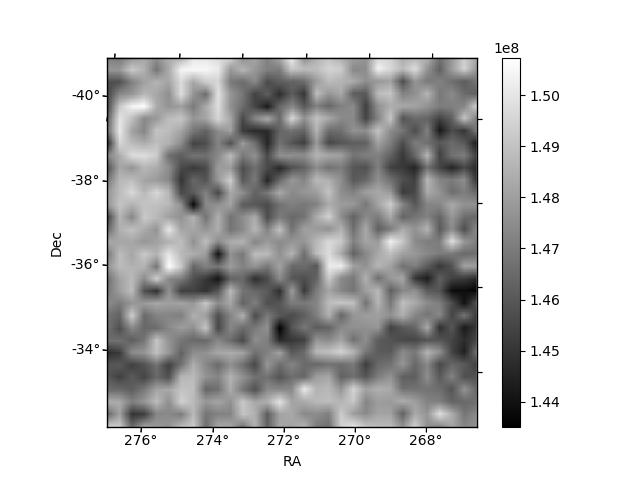
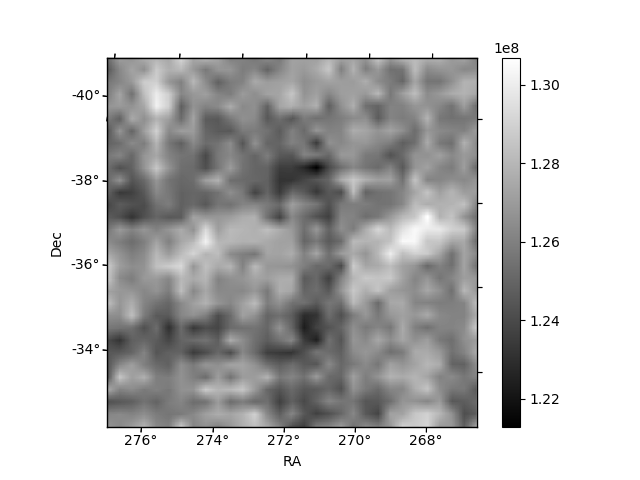
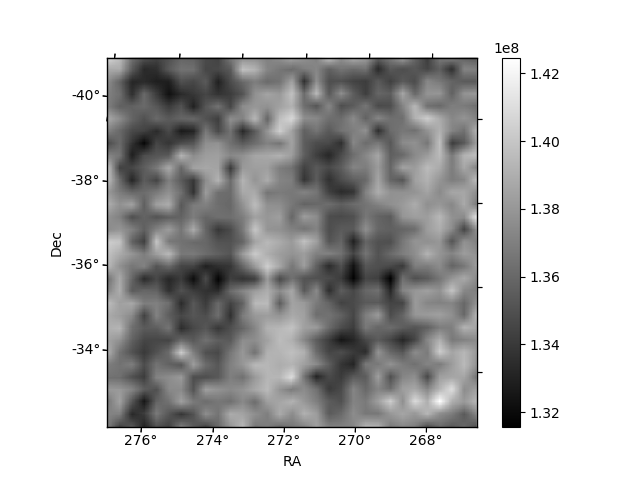
Histogram calculated using DETX and DETY for each event in the final _common_clean file
| Quadrant A | 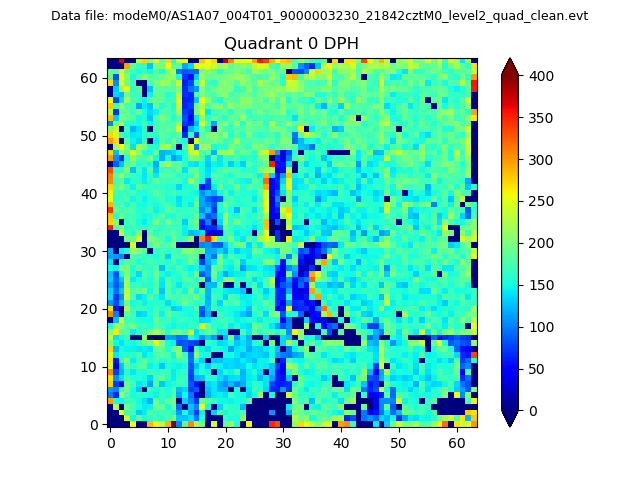 |
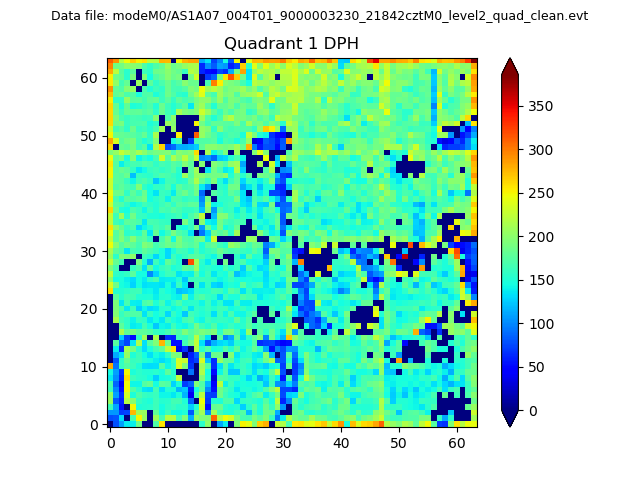 |
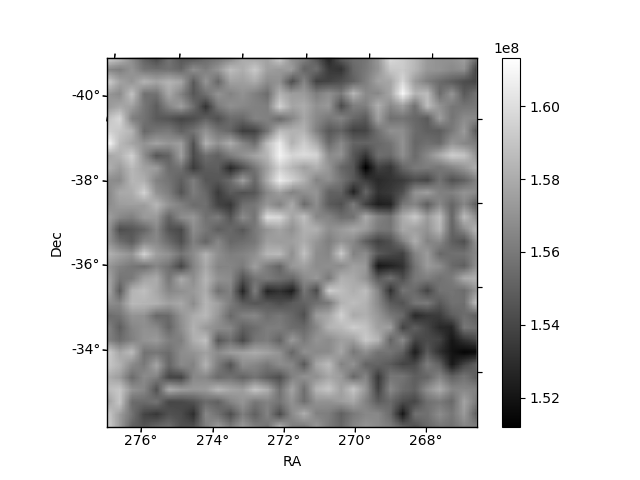
Quadrant B |
|---|---|---|---|
| Quadrant D | 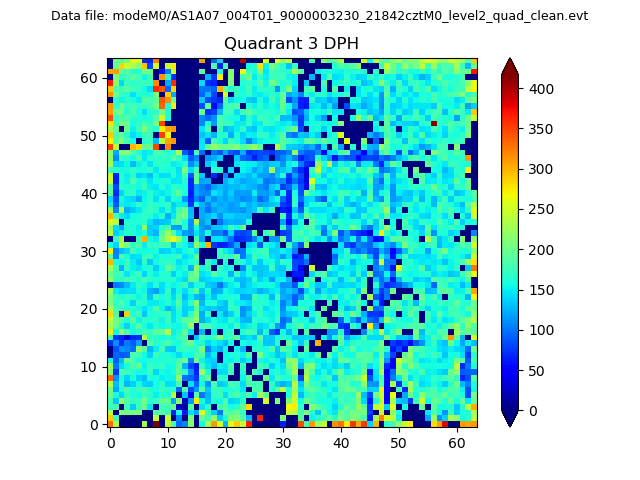 |
 |
Quadrant C |
| Plot type | Count rate plots | Images |
|---|---|---|
| Comparison with Poisson distribution Blue bars denote a histogram of data divided into 1 sec bins. Red curve is a Poisson curve with rate = median count rate of data. |
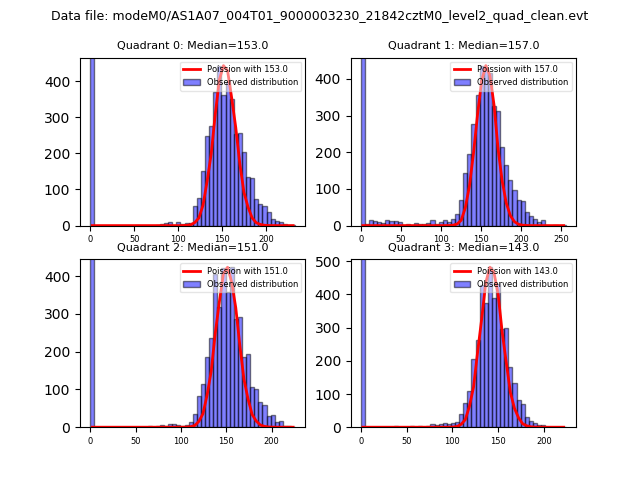 |
 |
| Quadrant-wise count rates Data is divided into 100 sec bins |
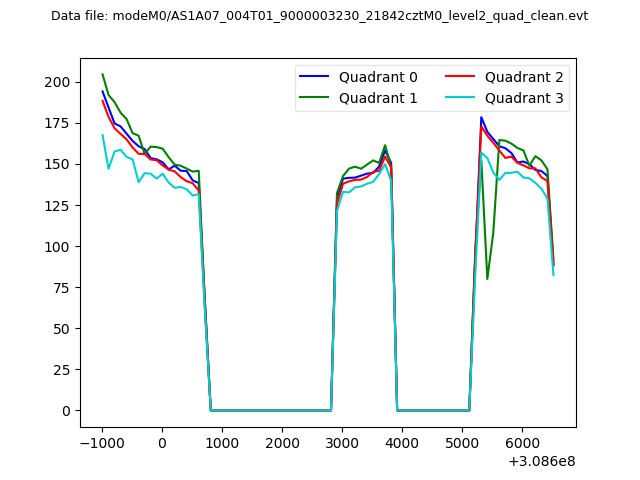 |
|
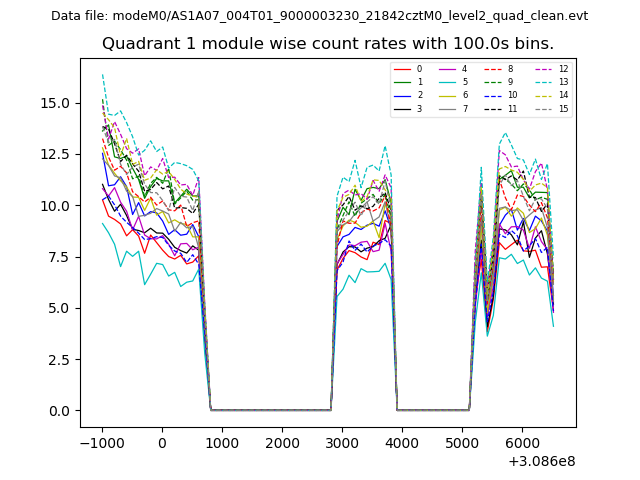
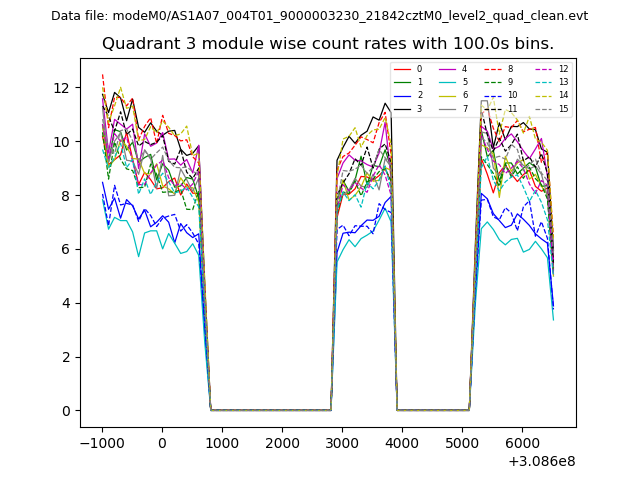
| Module-wise count rates for Quadrant A Data is divided into 100 sec bins |
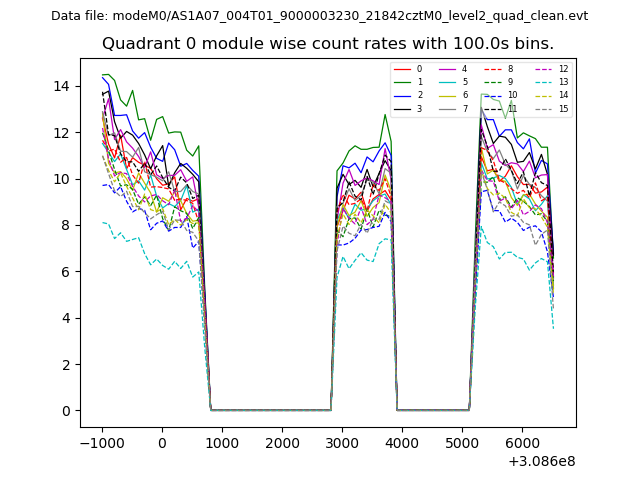 |
 |
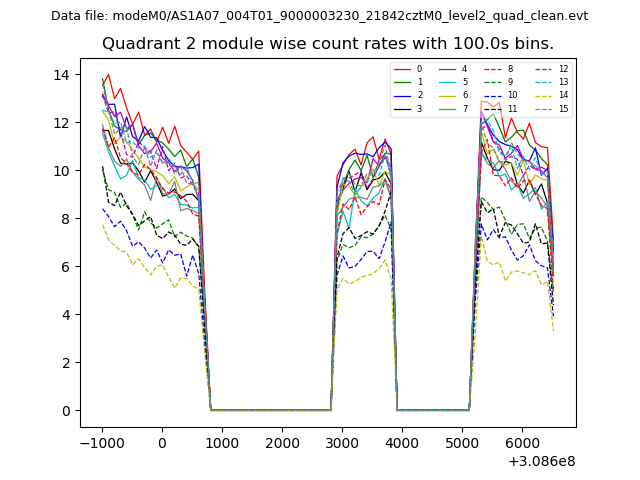
| Module-wise count rates for Quadrant B Data is divided into 100 sec bins |
 |
 |
| Module-wise count rates for Quadrant C Data is divided into 100 sec bins |
 |
 |
| Module-wise count rates for Quadrant D Data is divided into 100 sec bins |
 |
 |
| Parameter | Plot |
|---|---|
| CZT HV Monitor | 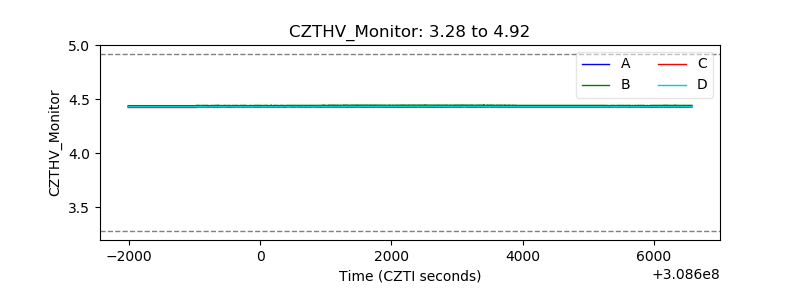 |
| D_VDD | 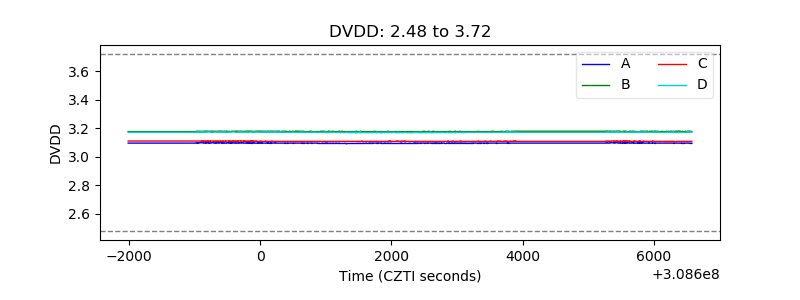 |
| Temperature 1 | 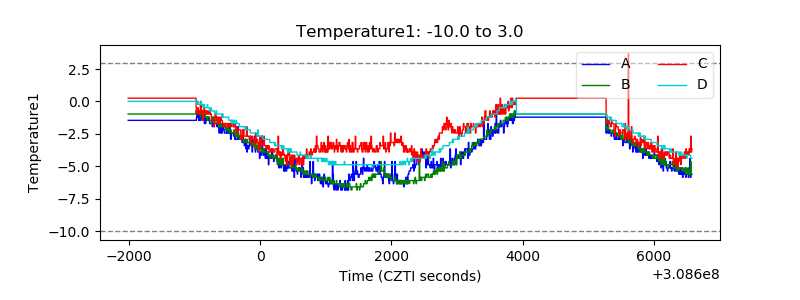 |
| Veto HV Monitor | 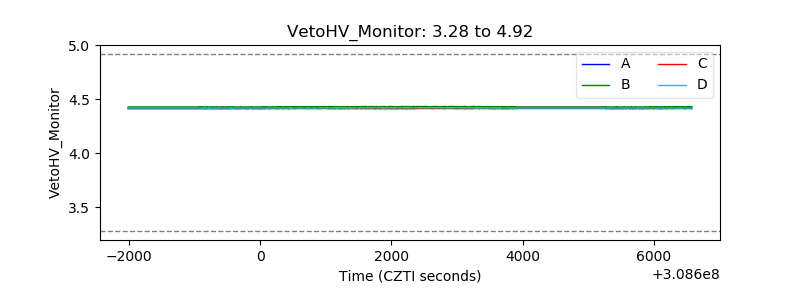 |
| Veto LLD | 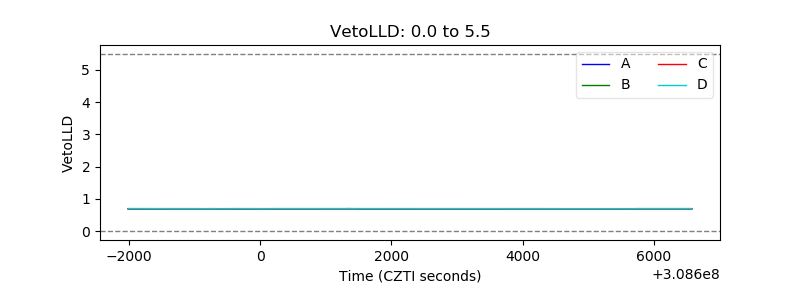 |
| Alpha Counter | 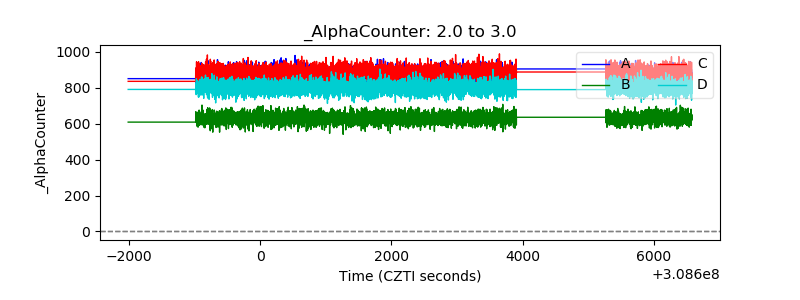 |
| _CPM_Rate |  |
| CZT Counter | 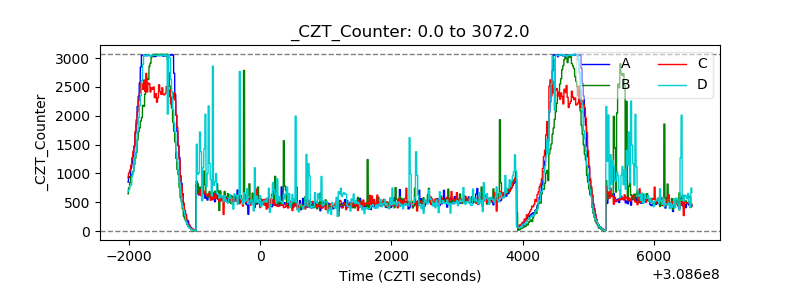 |
| +2.5 Volts monitor | 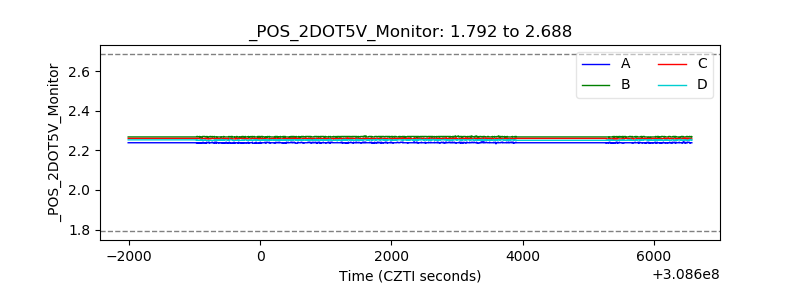 |
| +5 Volts monitor |  |
| _ROLL_ROT | 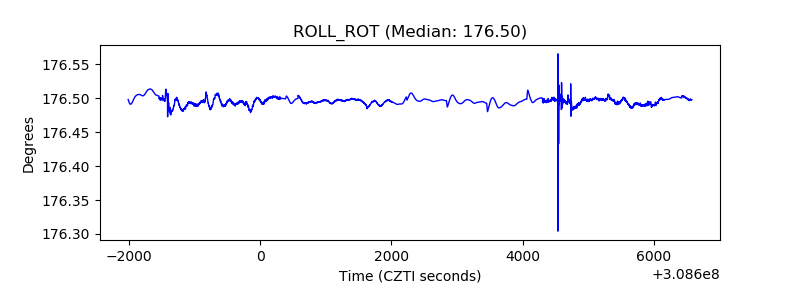 |
| _Roll_DEC |  |
| _Roll_RA |  |
| Veto Counter | 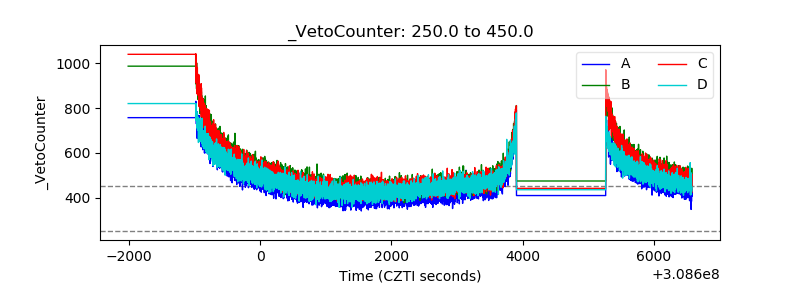 |