| Param | Original file | Final file |
|---|---|---|
| Filename | modeM0/AS1A07_004T01_9000003230_21846cztM0_level2.evt | modeM0/AS1A07_004T01_9000003230_21846cztM0_level2_quad_clean.evt |
| Size (bytes) | 495,037,440 | 76,118,400 |
| Size | 472.1 MB | 72.6 MB |
| Events in quadrant A | 3,422,203 | 454,476 |
| Events in quadrant B | 3,651,651 | 463,018 |
| Events in quadrant C | 3,457,192 | 448,630 |
| Events in quadrant D | 3,968,389 | 433,863 |
| Mode SS | |||
|---|---|---|---|
| Quadrant | BADHDUFLAG | Total packets | Discarded packets |
| A | 0 | 146 | 0 |
| B | 0 | 146 | 0 |
| C | 0 | 146 | 0 |
| D | 0 | 146 | 0 |
| Mode M0 | |||
|---|---|---|---|
| Quadrant | BADHDUFLAG | Total packets | Discarded packets |
| A | 0 | 15047 | 1 |
| B | 0 | 15459 | 1 |
| C | 0 | 14990 | 1 |
| D | 0 | 16674 | 1 |
| Mode M9 | |||
|---|---|---|---|
| Quadrant | BADHDUFLAG | Total packets | Discarded packets |
| A | 0 | 3 | 0 |
| B | 0 | 3 | 0 |
| C | 0 | 3 | 0 |
| D | 0 | 3 | 0 |
| Quadrant | Total seconds | Saturated seconds | Saturation percentage |
|---|---|---|---|
| A | 7254 | 131 | 1.805900% |
| B | 7254 | 188 | 2.591674% |
| C | 7254 | 170 | 2.343535% |
| D | 7255 | 159 | 2.191592% |
Noise dominated data is calculated using 1-second bins in cleaned event files. If a bin has >2000 counts, and if more than 50% of those come from <1% of pixels, then it is considered to be noise-dominated and hence unusable.
| Quadrant | # 1 sec bins | Bins with >0 counts | Bins with >2000 counts | High rate bins dominated by noise | Noise dominated (total time) | Noise dominated (detector-on time) | Marked lightcurve |
|---|---|---|---|---|---|---|---|
| A | 7524 | 7255 | 0 | 0 | 0.00% | 0.00% | 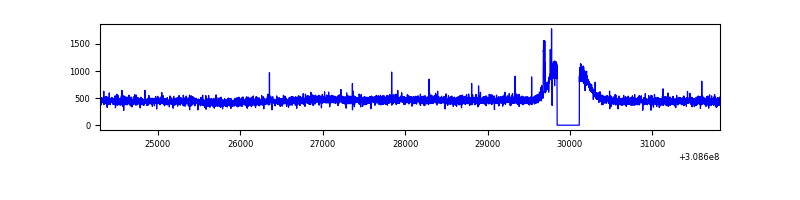 |
| B | 7524 | 7254 | 20 | 20 | 0.27% | 0.28% | 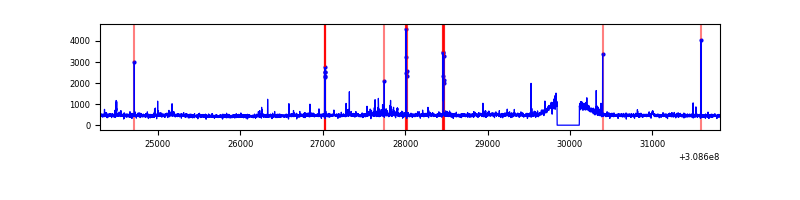 |
| C | 7524 | 7254 | 1 | 1 | 0.01% | 0.01% | 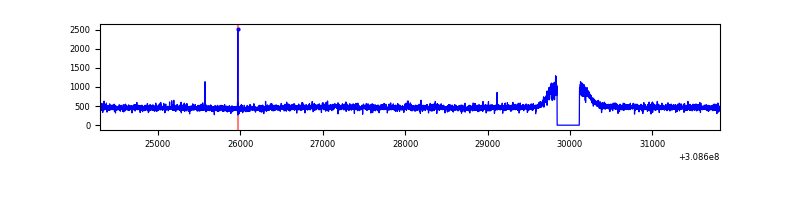 |
| D | 7525 | 7256 | 42 | 42 | 0.56% | 0.58% | 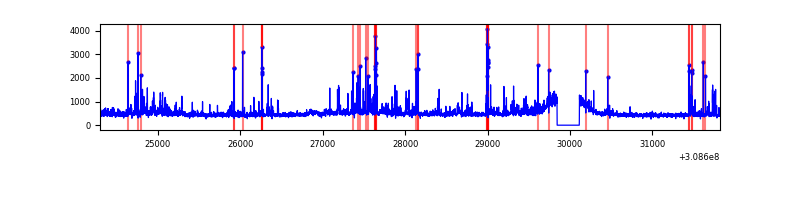 |
Top three noisy pixels from each quadrant. If the there are fewer than three noisy pixels in the level2.evt file, extra rows are filled as -1
| Pixel properties | Quadrant properties | ||||||
|---|---|---|---|---|---|---|---|
| Quadrant | DetID | PixID | Counts | Sigma | Mean | Median | Sigma |
| A | 4 | 2 | 23076 | 123.86 | 881 | 861 | 179.4 |
| A | 13 | 254 | 13521 | 70.59 | 881 | 861 | 179.4 |
| A | 0 | 226 | 7548 | 37.28 | 881 | 861 | 179.4 |
| B | 3 | 64 | 85360 | 490.14 | 884 | 863 | 172.4 |
| B | 0 | 190 | 34616 | 195.79 | 884 | 863 | 172.4 |
| B | 0 | 197 | 33248 | 187.85 | 884 | 863 | 172.4 |
| C | 14 | 238 | 130100 | 640.46 | 849 | 852 | 201.8 |
| C | 4 | 175 | 7233 | 31.62 | 849 | 852 | 201.8 |
| C | 13 | 61 | 5891 | 24.97 | 849 | 852 | 201.8 |
| D | 1 | 52 | 271518 | 1207.12 | 847 | 829 | 224.2 |
| D | 13 | 174 | 180765 | 802.41 | 847 | 829 | 224.2 |
| D | 7 | 238 | 108198 | 478.8 | 847 | 829 | 224.2 |
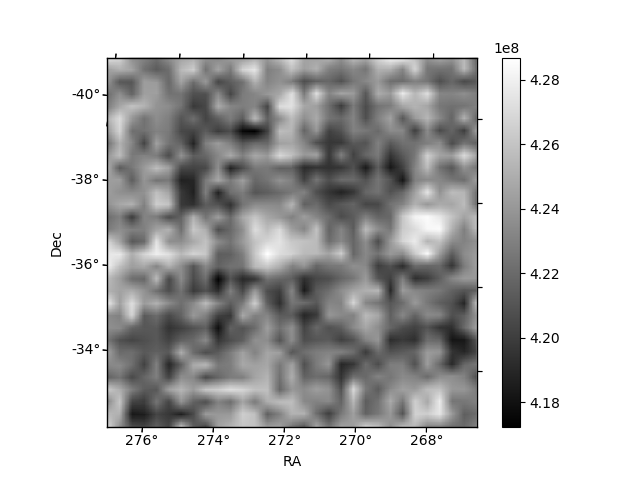
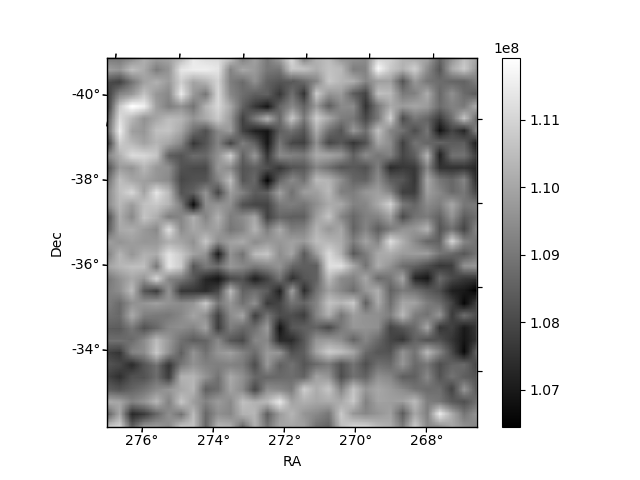
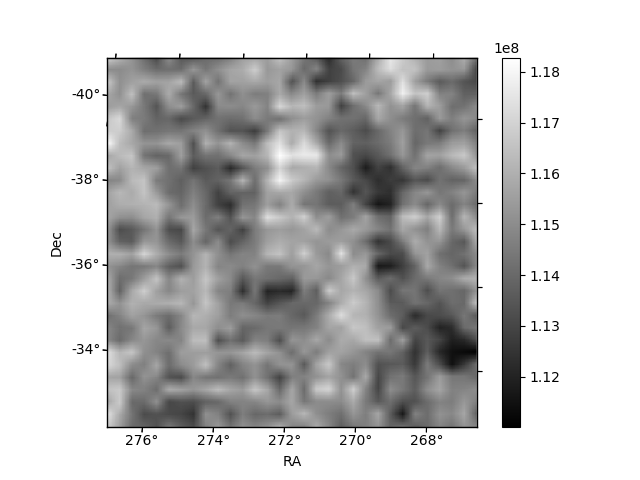
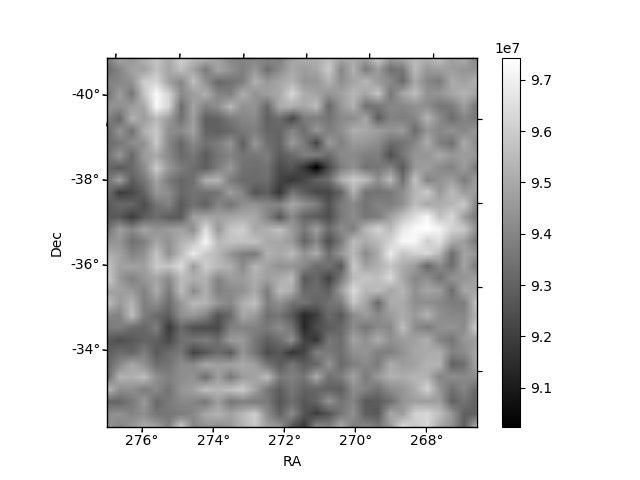
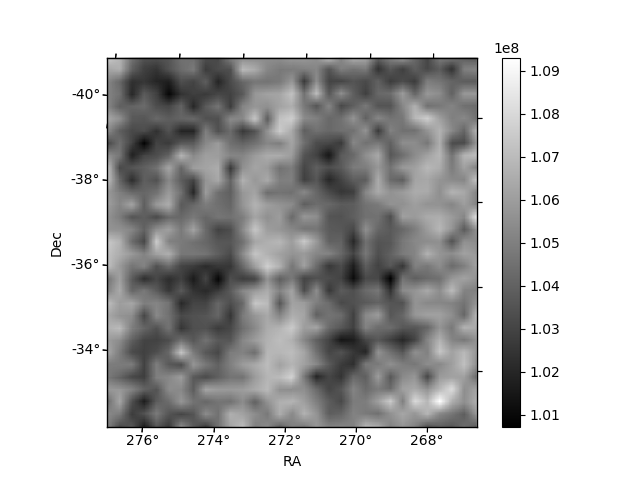
Histogram calculated using DETX and DETY for each event in the final _common_clean file
| Quadrant A | 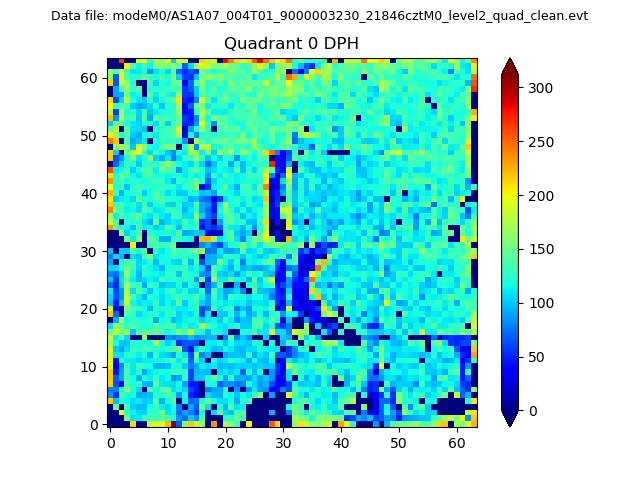 |
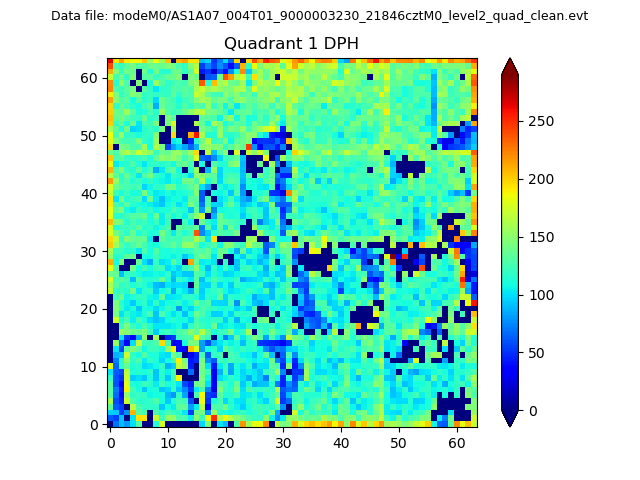 |
Quadrant B |
|---|---|---|---|
| Quadrant D | 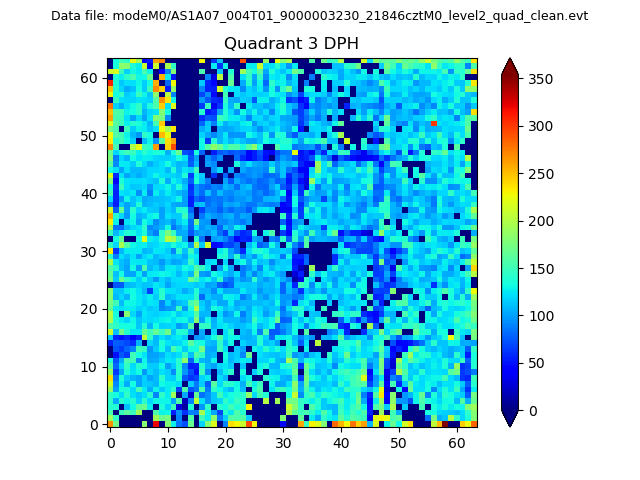 |
 |
Quadrant C |
| Plot type | Count rate plots | Images |
|---|---|---|
| Comparison with Poisson distribution Blue bars denote a histogram of data divided into 1 sec bins. Red curve is a Poisson curve with rate = median count rate of data. |
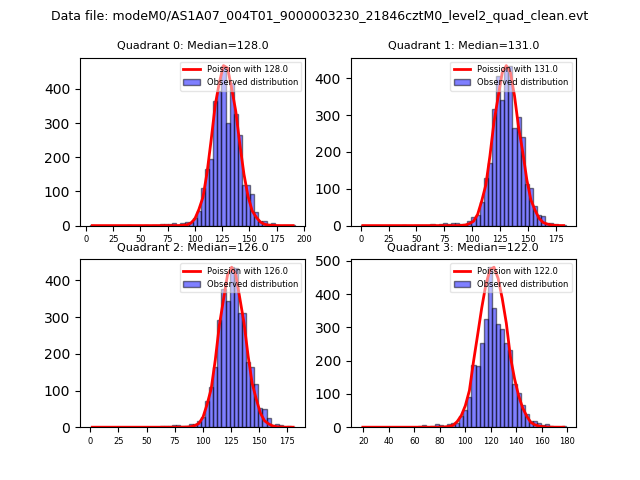 |
 |
| Quadrant-wise count rates Data is divided into 100 sec bins |
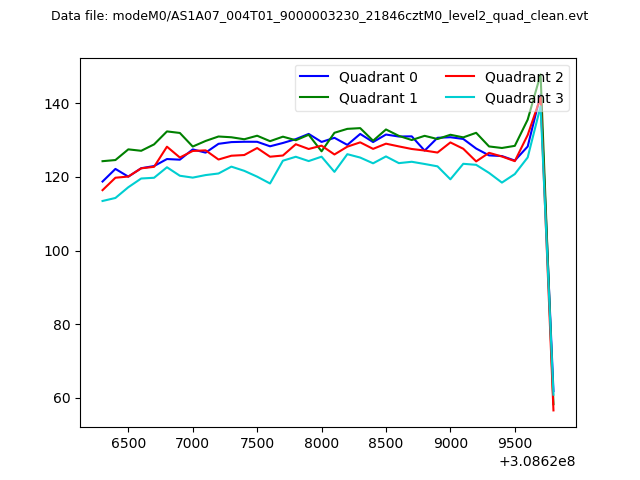 |
|
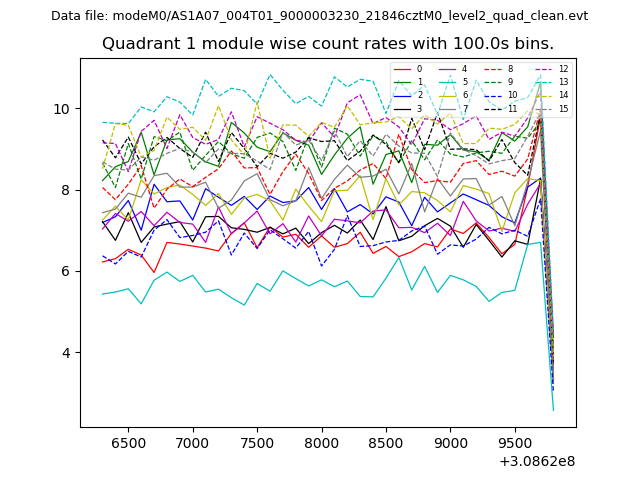
| Module-wise count rates for Quadrant A Data is divided into 100 sec bins |
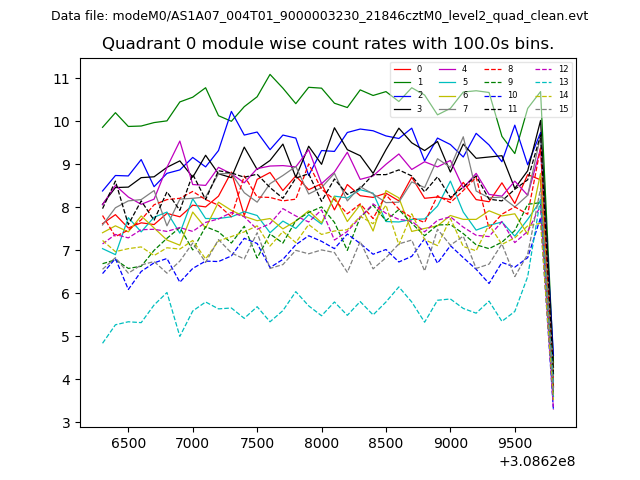 |
 |
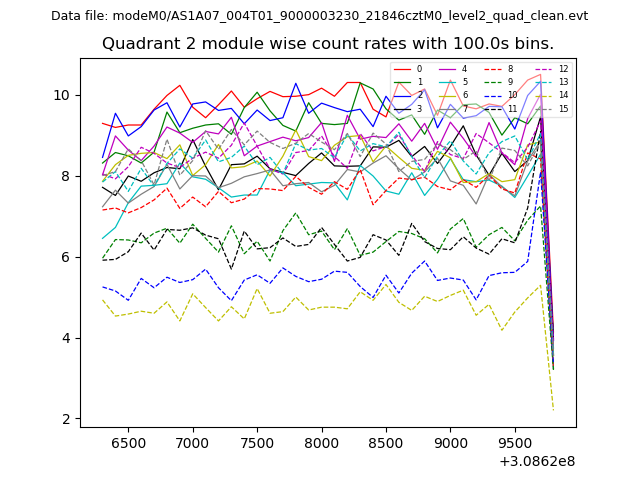
| Module-wise count rates for Quadrant B Data is divided into 100 sec bins |
 |
 |
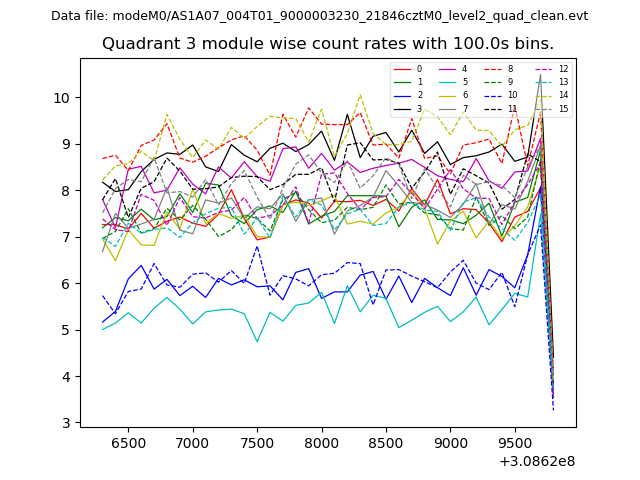
| Module-wise count rates for Quadrant C Data is divided into 100 sec bins |
 |
 |
| Module-wise count rates for Quadrant D Data is divided into 100 sec bins |
 |
 |
| Parameter | Plot |
|---|---|
| CZT HV Monitor | 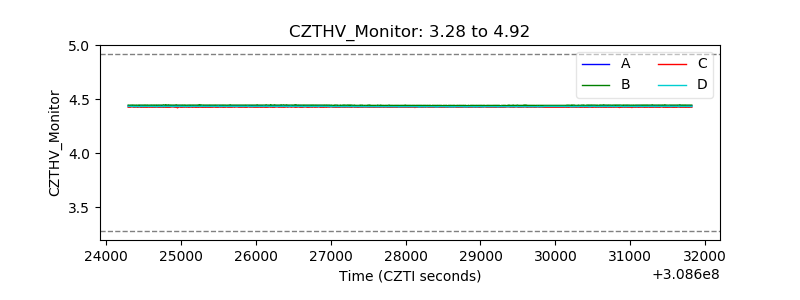 |
| D_VDD | 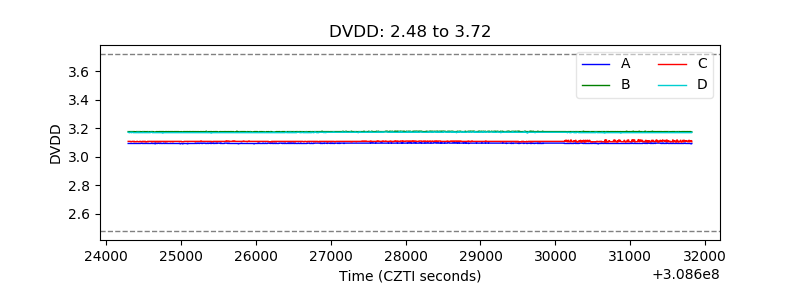 |
| Temperature 1 | 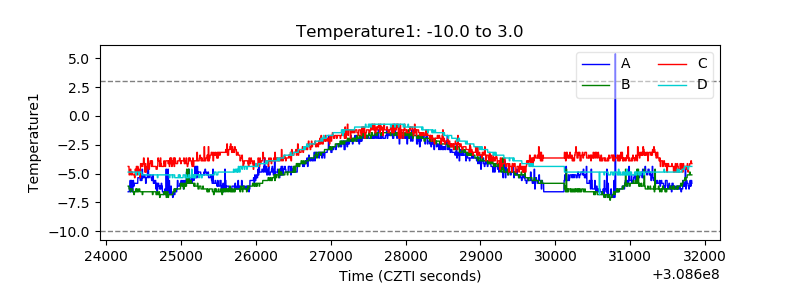 |
| Veto HV Monitor | 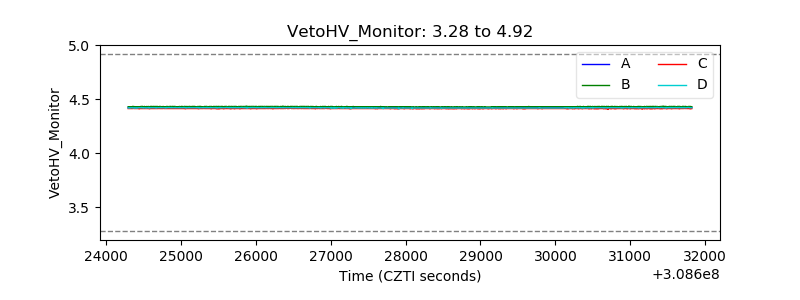 |
| Veto LLD | 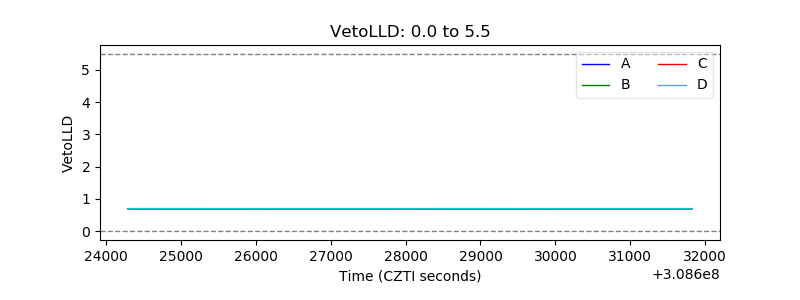 |
| Alpha Counter | 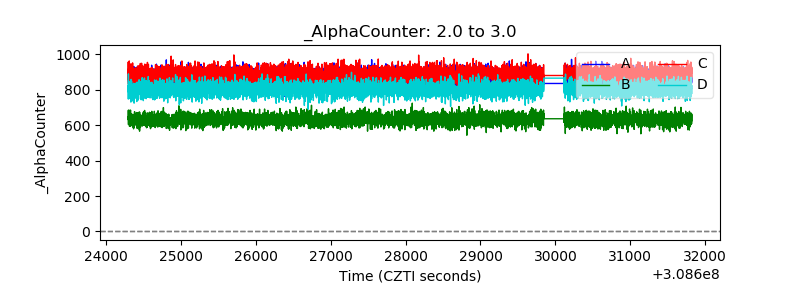 |
| _CPM_Rate | 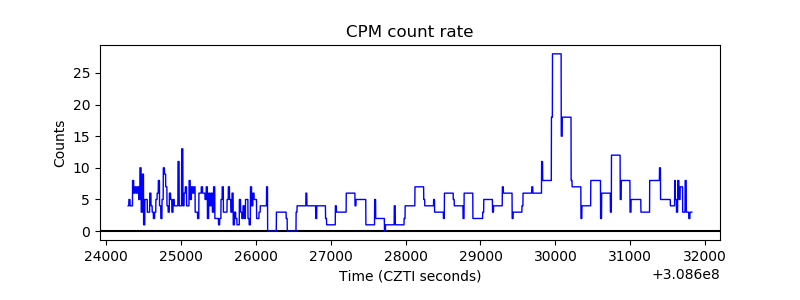 |
| CZT Counter |  |
| +2.5 Volts monitor |  |
| +5 Volts monitor | 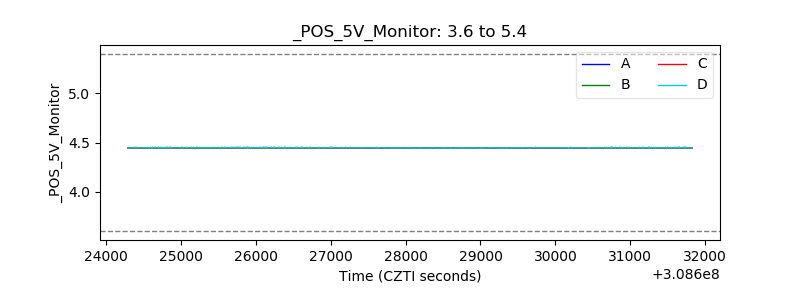 |
| _ROLL_ROT | 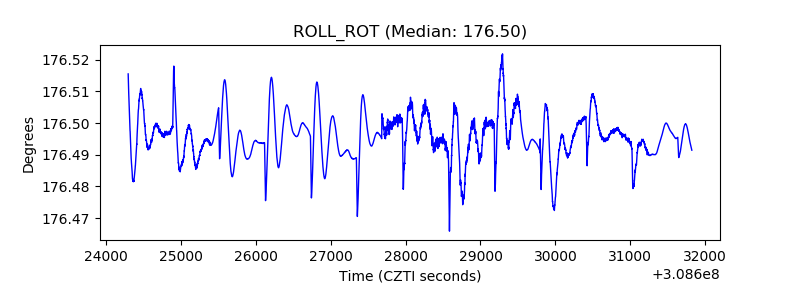 |
| _Roll_DEC | 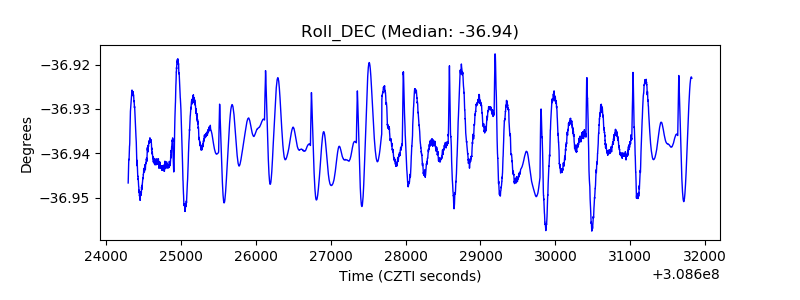 |
| _Roll_RA |  |
| Veto Counter | 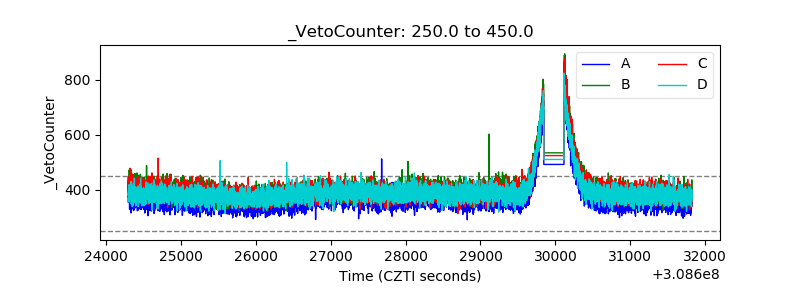 |