| Param | Original file | Final file |
|---|---|---|
| Filename | modeM0/AS1A07_004T01_9000003230_21847cztM0_level2.evt | modeM0/AS1A07_004T01_9000003230_21847cztM0_level2_quad_clean.evt |
| Size (bytes) | 543,928,320 | 76,953,600 |
| Size | 518.7 MB | 73.4 MB |
| Events in quadrant A | 3,514,106 | 459,351 |
| Events in quadrant B | 3,736,794 | 470,210 |
| Events in quadrant C | 3,572,489 | 453,469 |
| Events in quadrant D | 5,147,845 | 432,659 |
| Mode SS | |||
|---|---|---|---|
| Quadrant | BADHDUFLAG | Total packets | Discarded packets |
| A | 0 | 150 | 0 |
| B | 0 | 150 | 0 |
| C | 0 | 150 | 0 |
| D | 0 | 150 | 0 |
| Mode M0 | |||
|---|---|---|---|
| Quadrant | BADHDUFLAG | Total packets | Discarded packets |
| A | 0 | 15339 | 1 |
| B | 0 | 15782 | 1 |
| C | 0 | 15339 | 1 |
| D | 0 | 20427 | 1 |
| Mode M9 | |||
|---|---|---|---|
| Quadrant | BADHDUFLAG | Total packets | Discarded packets |
| A | 0 | 1 | 0 |
| B | 0 | 1 | 0 |
| C | 0 | 1 | 0 |
| D | 0 | 1 | 0 |
| Quadrant | Total seconds | Saturated seconds | Saturation percentage |
|---|---|---|---|
| A | 7390 | 247 | 3.342355% |
| B | 7390 | 278 | 3.761840% |
| C | 7391 | 275 | 3.720741% |
| D | 7391 | 464 | 6.277906% |
Noise dominated data is calculated using 1-second bins in cleaned event files. If a bin has >2000 counts, and if more than 50% of those come from <1% of pixels, then it is considered to be noise-dominated and hence unusable.
| Quadrant | # 1 sec bins | Bins with >0 counts | Bins with >2000 counts | High rate bins dominated by noise | Noise dominated (total time) | Noise dominated (detector-on time) | Marked lightcurve |
|---|---|---|---|---|---|---|---|
| A | 7490 | 7390 | 1 | 1 | 0.01% | 0.01% | 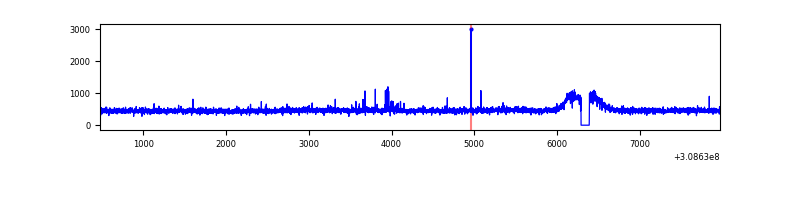 |
| B | 7490 | 7390 | 11 | 11 | 0.15% | 0.15% | 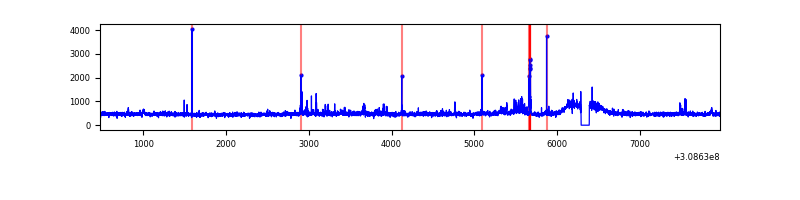 |
| C | 7491 | 7391 | 1 | 1 | 0.01% | 0.01% | 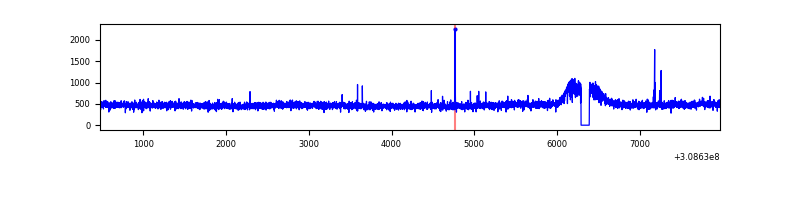 |
| D | 7491 | 7392 | 232 | 232 | 3.10% | 3.14% | 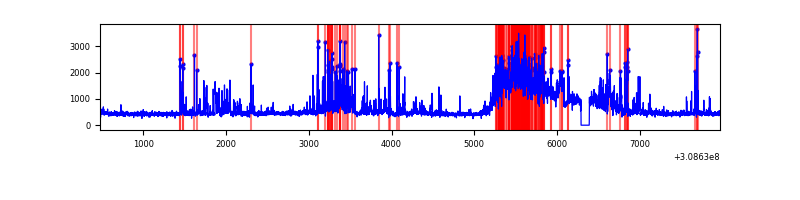 |
Top three noisy pixels from each quadrant. If the there are fewer than three noisy pixels in the level2.evt file, extra rows are filled as -1
| Pixel properties | Quadrant properties | ||||||
|---|---|---|---|---|---|---|---|
| Quadrant | DetID | PixID | Counts | Sigma | Mean | Median | Sigma |
| A | 4 | 2 | 32886 | 174.33 | 902 | 879 | 183.6 |
| A | 13 | 254 | 13821 | 70.49 | 902 | 879 | 183.6 |
| A | 3 | 137 | 7804 | 37.72 | 902 | 879 | 183.6 |
| B | 3 | 64 | 66401 | 372.37 | 904 | 878 | 176.0 |
| B | 0 | 197 | 53724 | 300.32 | 904 | 878 | 176.0 |
| B | 0 | 230 | 39082 | 217.11 | 904 | 878 | 176.0 |
| C | 14 | 238 | 134658 | 644.97 | 869 | 874 | 207.4 |
| C | 4 | 175 | 13066 | 58.78 | 869 | 874 | 207.4 |
| C | 5 | 112 | 11978 | 53.53 | 869 | 874 | 207.4 |
| D | 13 | 174 | 1023162 | 4379.6 | 864 | 843 | 233.4 |
| D | 1 | 52 | 329785 | 1409.18 | 864 | 843 | 233.4 |
| D | 7 | 238 | 326409 | 1394.72 | 864 | 843 | 233.4 |
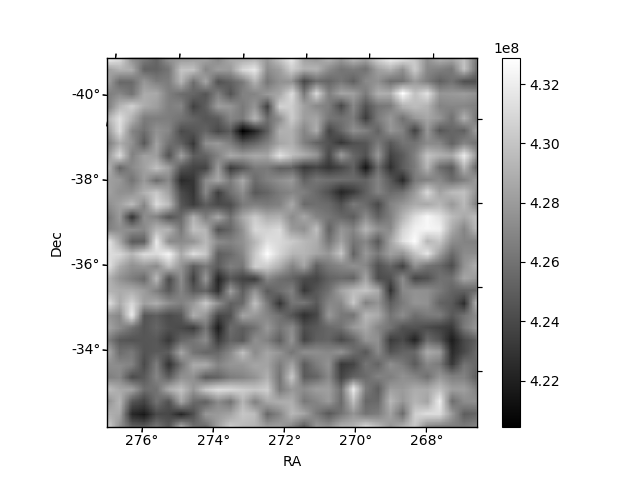
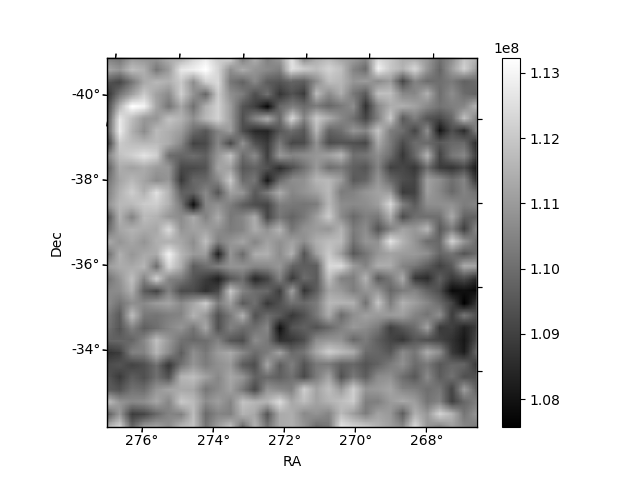
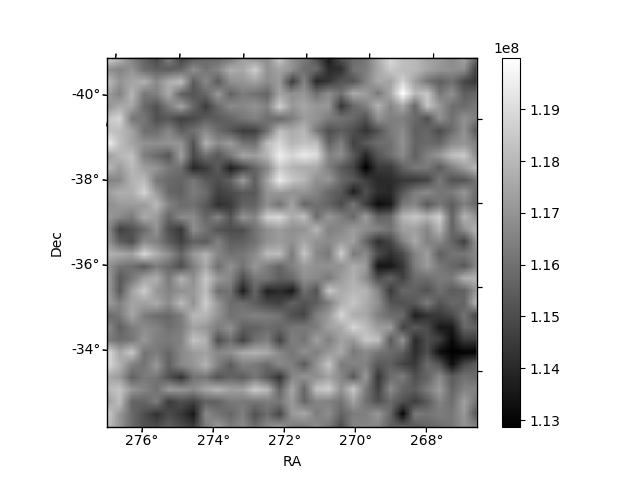
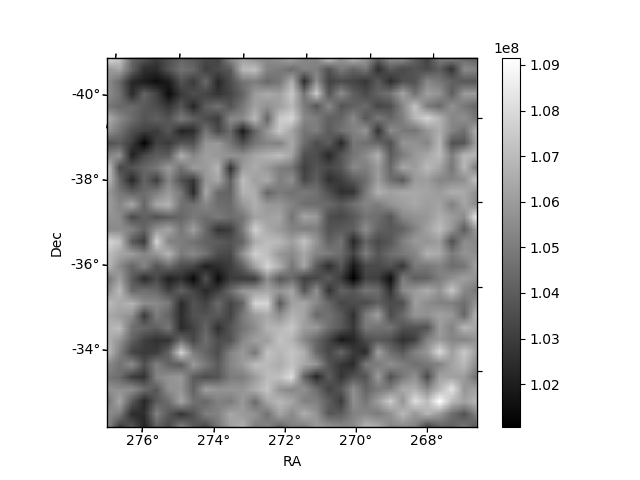
Histogram calculated using DETX and DETY for each event in the final _common_clean file
| Quadrant A | 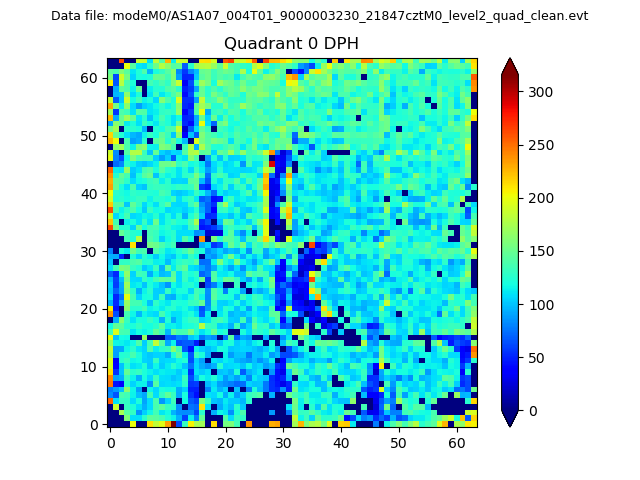 |
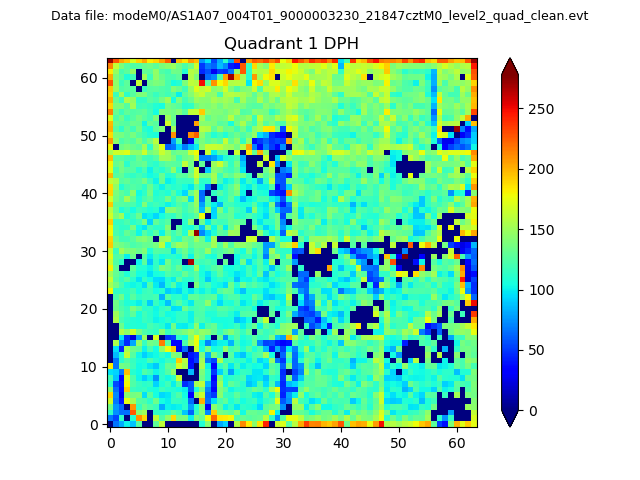 |
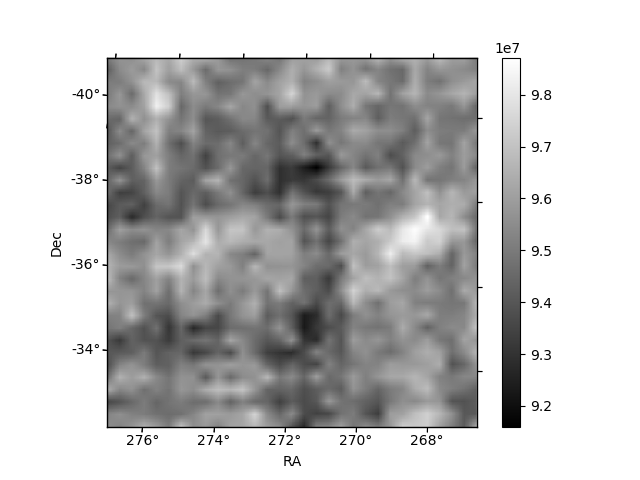
Quadrant B |
|---|---|---|---|
| Quadrant D | 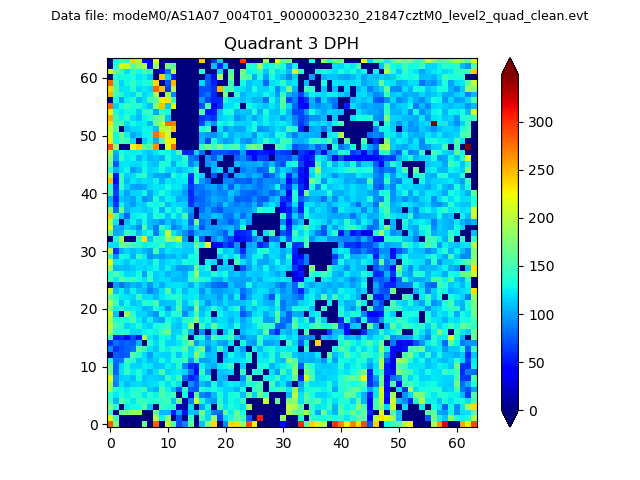 |
 |
Quadrant C |
| Plot type | Count rate plots | Images |
|---|---|---|
| Comparison with Poisson distribution Blue bars denote a histogram of data divided into 1 sec bins. Red curve is a Poisson curve with rate = median count rate of data. |
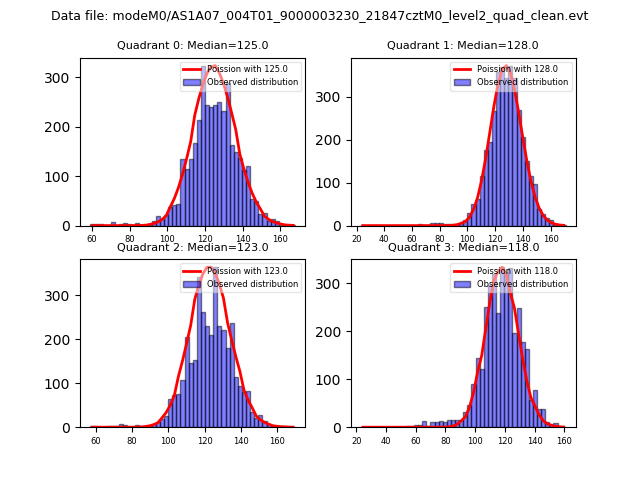 |
 |
| Quadrant-wise count rates Data is divided into 100 sec bins |
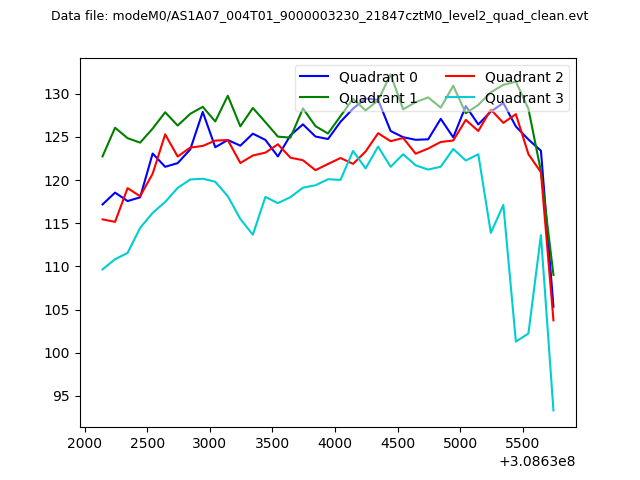 |
|
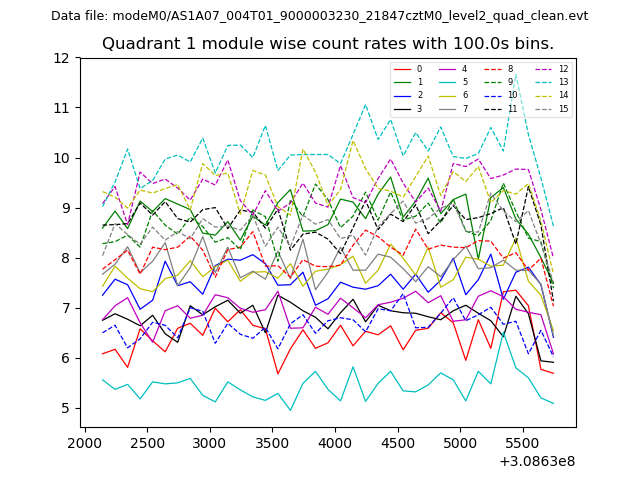
| Module-wise count rates for Quadrant A Data is divided into 100 sec bins |
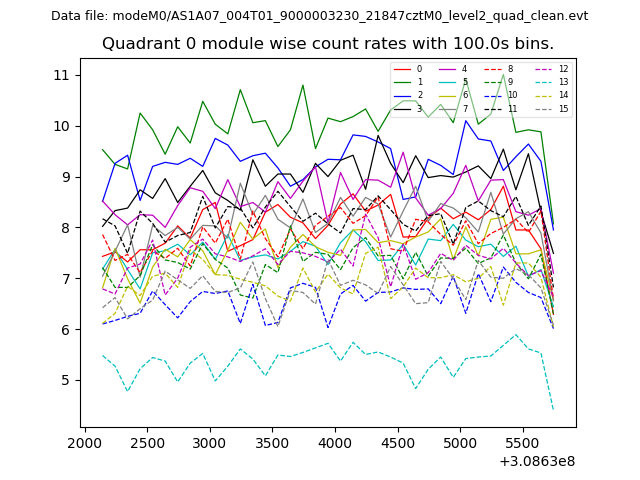 |
 |
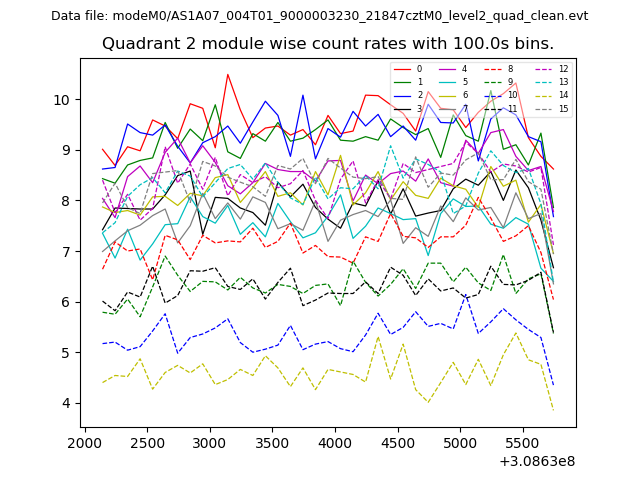
| Module-wise count rates for Quadrant B Data is divided into 100 sec bins |
 |
 |
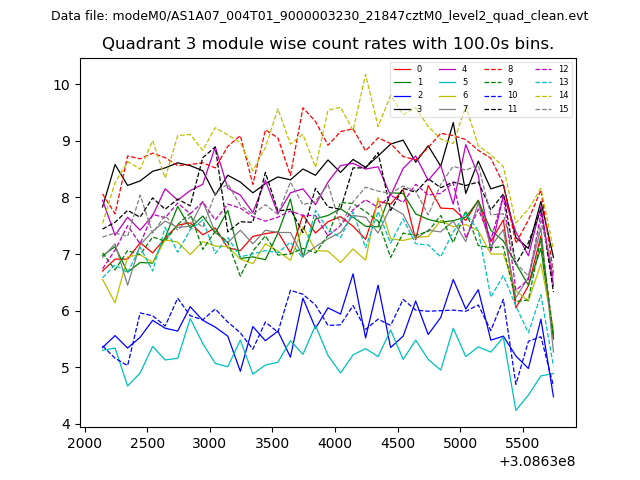
| Module-wise count rates for Quadrant C Data is divided into 100 sec bins |
 |
 |
| Module-wise count rates for Quadrant D Data is divided into 100 sec bins |
 |
 |
| Parameter | Plot |
|---|---|
| CZT HV Monitor | 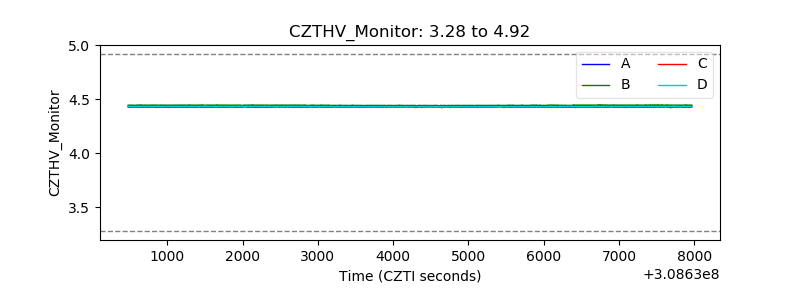 |
| D_VDD | 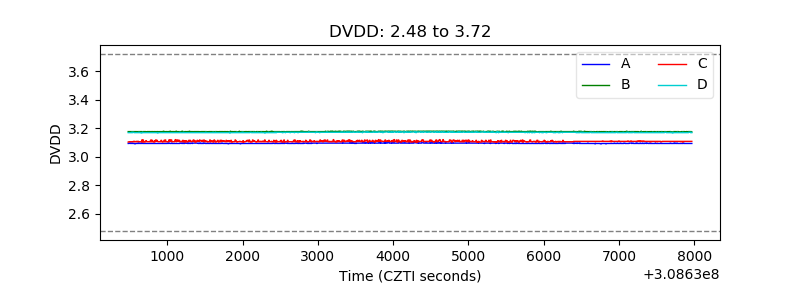 |
| Temperature 1 | 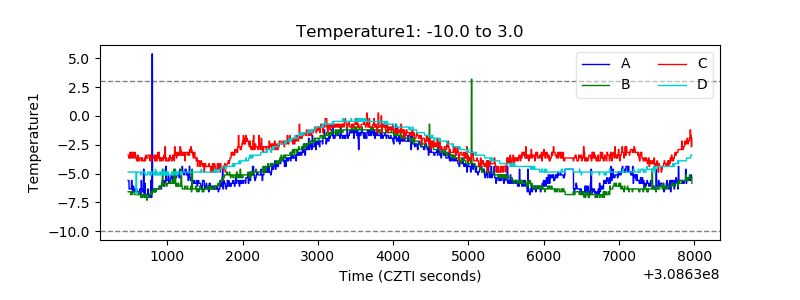 |
| Veto HV Monitor | 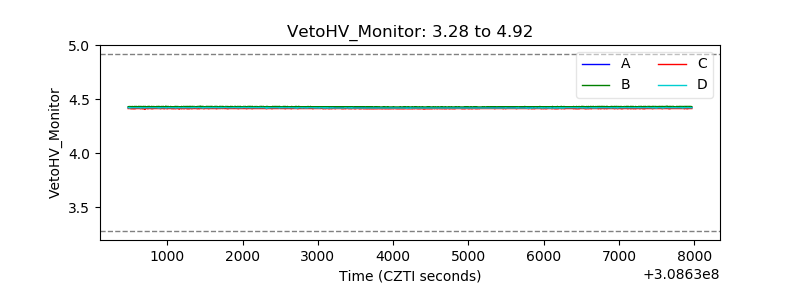 |
| Veto LLD |  |
| Alpha Counter | 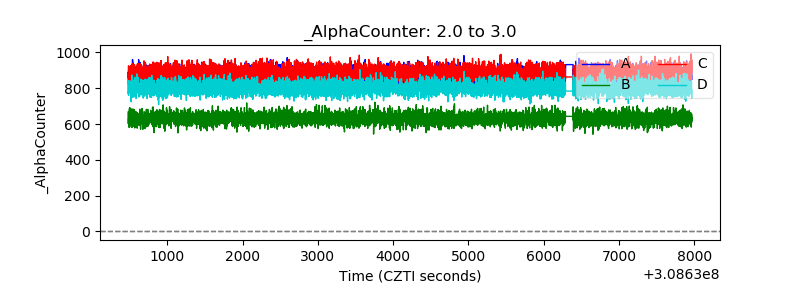 |
| _CPM_Rate | 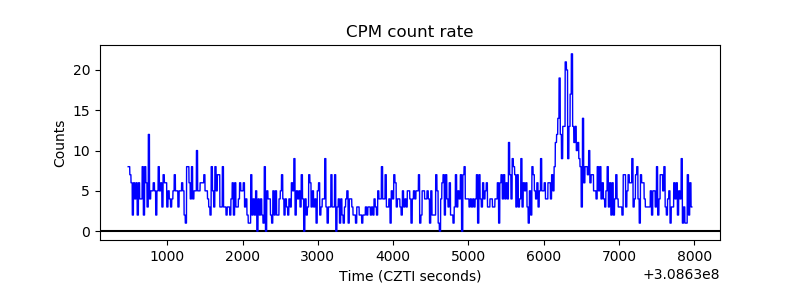 |
| CZT Counter | 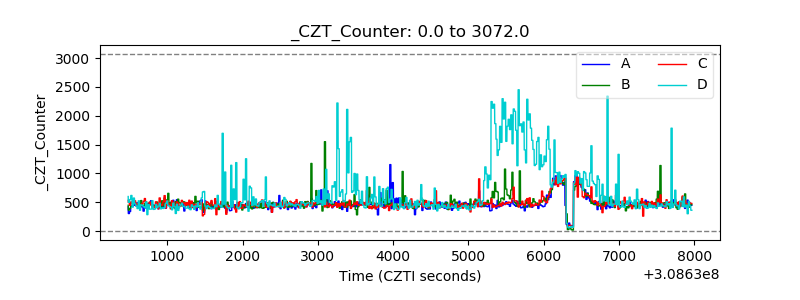 |
| +2.5 Volts monitor |  |
| +5 Volts monitor |  |
| _ROLL_ROT | 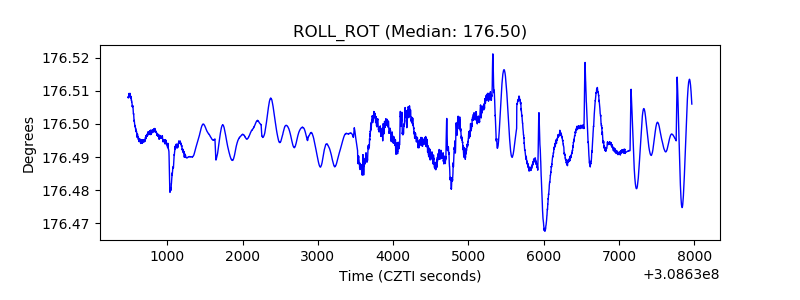 |
| _Roll_DEC | 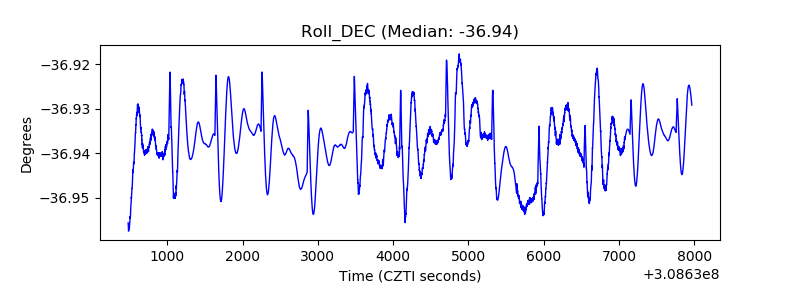 |
| _Roll_RA | 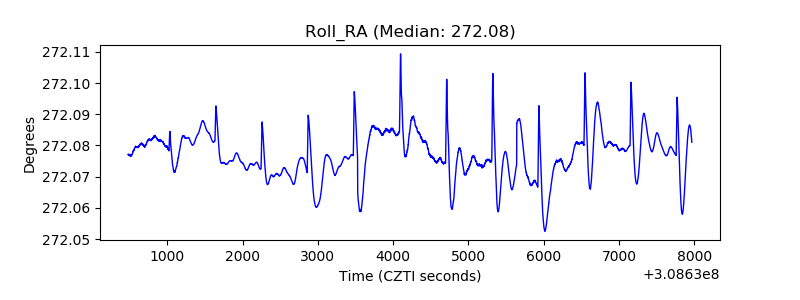 |
| Veto Counter | 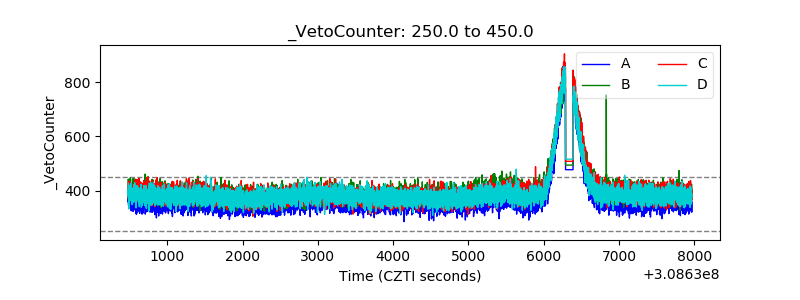 |