| Param | Original file | Final file |
|---|---|---|
| Filename | modeM0/AS1A07_004T01_9000003230_21855cztM0_level2.evt | modeM0/AS1A07_004T01_9000003230_21855cztM0_level2_quad_clean.evt |
| Size (bytes) | 467,055,360 | 94,504,320 |
| Size | 445.4 MB | 90.1 MB |
| Events in quadrant A | 3,487,076 | 618,787 |
| Events in quadrant B | 3,475,375 | 636,203 |
| Events in quadrant C | 3,114,898 | 597,943 |
| Events in quadrant D | 3,650,318 | 580,036 |
| Mode SS | |||
|---|---|---|---|
| Quadrant | BADHDUFLAG | Total packets | Discarded packets |
| A | 0 | 124 | 0 |
| B | 0 | 124 | 0 |
| C | 0 | 124 | 0 |
| D | 0 | 124 | 0 |
| Mode M0 | |||
|---|---|---|---|
| Quadrant | BADHDUFLAG | Total packets | Discarded packets |
| A | 0 | 14431 | 2 |
| B | 0 | 14253 | 2 |
| C | 0 | 13165 | 2 |
| D | 0 | 14870 | 2 |
| Mode M9 | |||
|---|---|---|---|
| Quadrant | BADHDUFLAG | Total packets | Discarded packets |
| A | 0 | 21 | 0 |
| B | 0 | 22 | 0 |
| C | 0 | 22 | 0 |
| D | 0 | 22 | 0 |
| Quadrant | Total seconds | Saturated seconds | Saturation percentage |
|---|---|---|---|
| A | 6148 | 69 | 1.122316% |
| B | 6148 | 74 | 1.203643% |
| C | 6148 | 81 | 1.317502% |
| D | 6148 | 90 | 1.463891% |
Noise dominated data is calculated using 1-second bins in cleaned event files. If a bin has >2000 counts, and if more than 50% of those come from <1% of pixels, then it is considered to be noise-dominated and hence unusable.
| Quadrant | # 1 sec bins | Bins with >0 counts | Bins with >2000 counts | High rate bins dominated by noise | Noise dominated (total time) | Noise dominated (detector-on time) | Marked lightcurve |
|---|---|---|---|---|---|---|---|
| A | 7418 | 6149 | 25 | 25 | 0.34% | 0.41% | 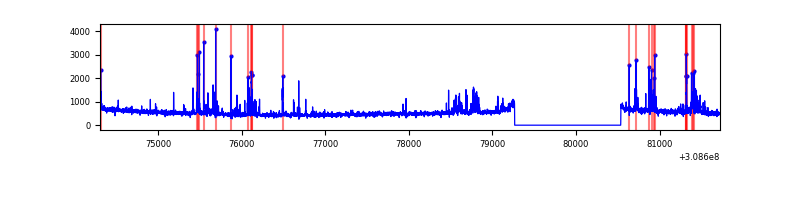 |
| B | 7418 | 6149 | 14 | 14 | 0.19% | 0.23% | 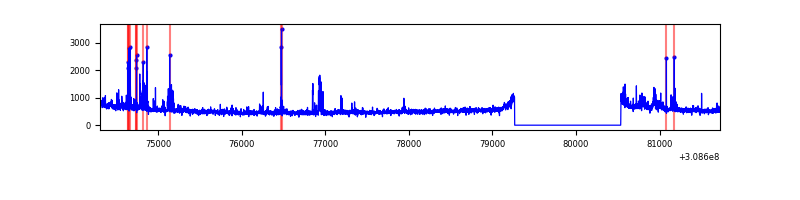 |
| C | 7418 | 6149 | 0 | 0 | 0.00% | 0.00% | 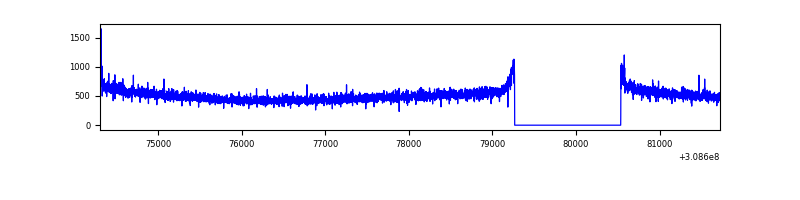 |
| D | 7418 | 6149 | 80 | 80 | 1.08% | 1.30% | 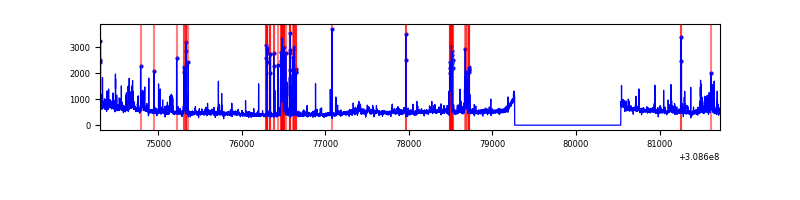 |
Top three noisy pixels from each quadrant. If the there are fewer than three noisy pixels in the level2.evt file, extra rows are filled as -1
| Pixel properties | Quadrant properties | ||||||
|---|---|---|---|---|---|---|---|
| Quadrant | DetID | PixID | Counts | Sigma | Mean | Median | Sigma |
| A | 4 | 2 | 201610 | 1234.09 | 810 | 797 | 162.7 |
| A | 2 | 79 | 128446 | 784.46 | 810 | 797 | 162.7 |
| A | 5 | 16 | 18866 | 111.04 | 810 | 797 | 162.7 |
| B | 15 | 33 | 88286 | 569.67 | 811 | 792 | 153.6 |
| B | 0 | 245 | 83492 | 538.46 | 811 | 792 | 153.6 |
| B | 3 | 64 | 39324 | 250.88 | 811 | 792 | 153.6 |
| C | 14 | 238 | 121326 | 672.72 | 764 | 769 | 179.2 |
| C | 5 | 112 | 6982 | 34.67 | 764 | 769 | 179.2 |
| C | 10 | 23 | 5945 | 28.88 | 764 | 769 | 179.2 |
| D | 7 | 238 | 281375 | 1525.16 | 767 | 748 | 184.0 |
| D | 14 | 35 | 166088 | 898.59 | 767 | 748 | 184.0 |
| D | 12 | 233 | 77804 | 418.78 | 767 | 748 | 184.0 |
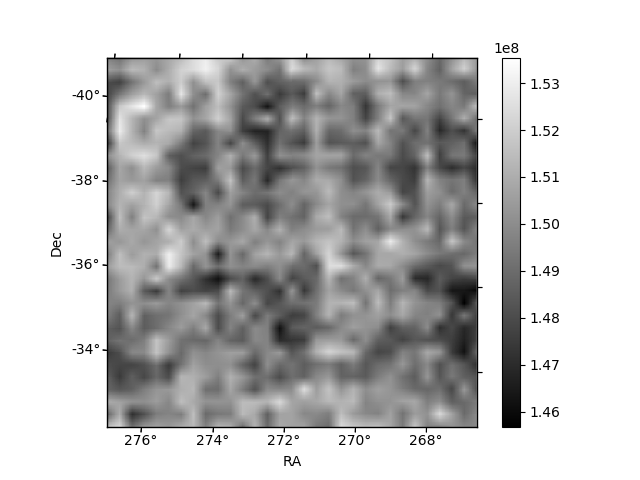
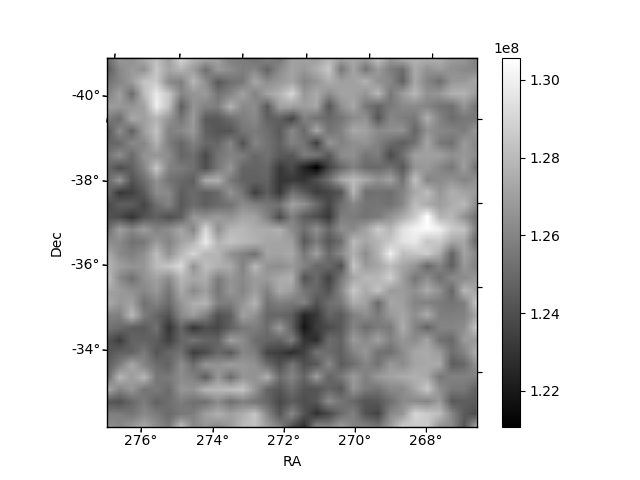
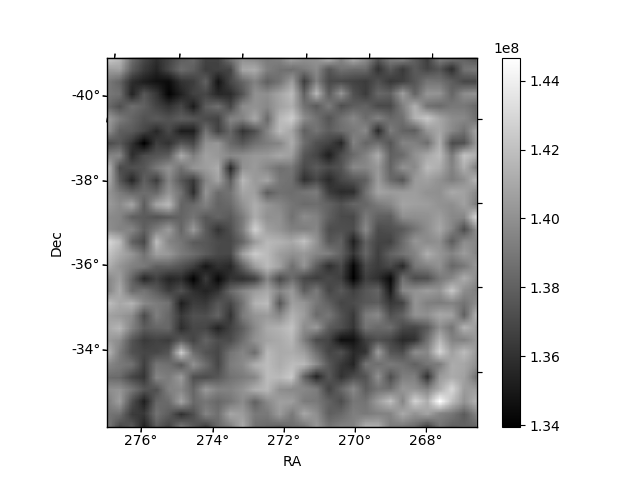
Histogram calculated using DETX and DETY for each event in the final _common_clean file
| Quadrant A | 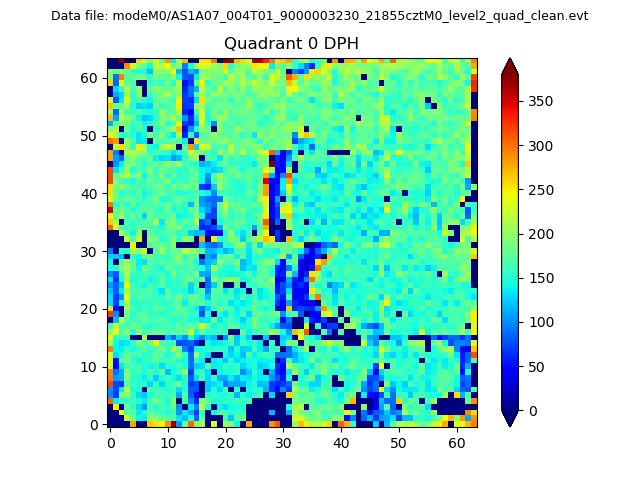 |
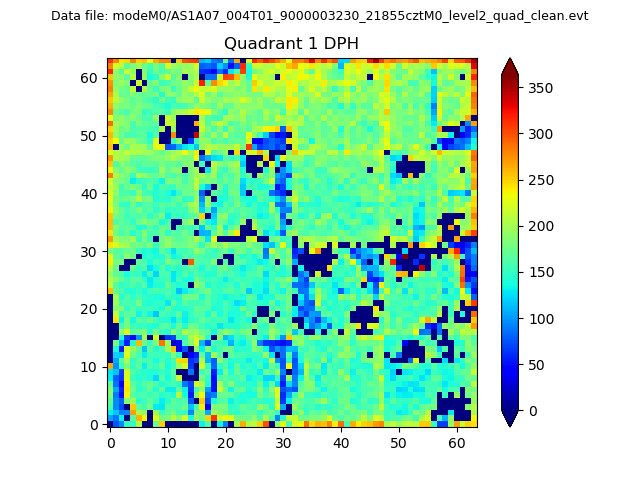 |
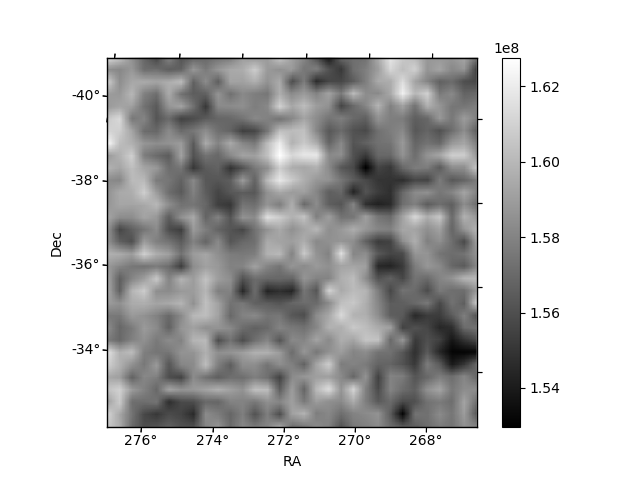
Quadrant B |
|---|---|---|---|
| Quadrant D |  |
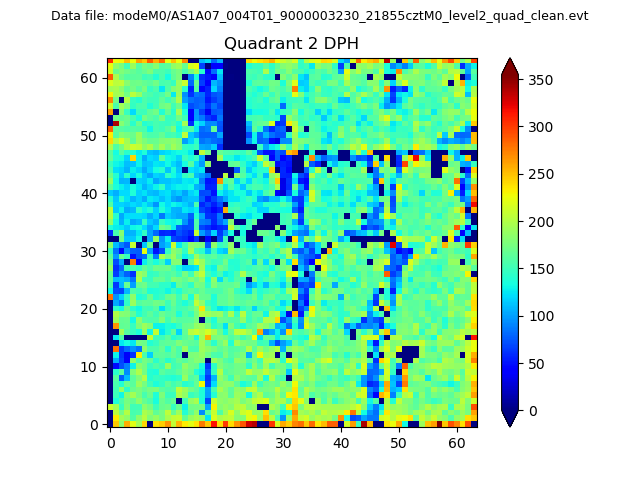 |
Quadrant C |
| Plot type | Count rate plots | Images |
|---|---|---|
| Comparison with Poisson distribution Blue bars denote a histogram of data divided into 1 sec bins. Red curve is a Poisson curve with rate = median count rate of data. |
 |
 |
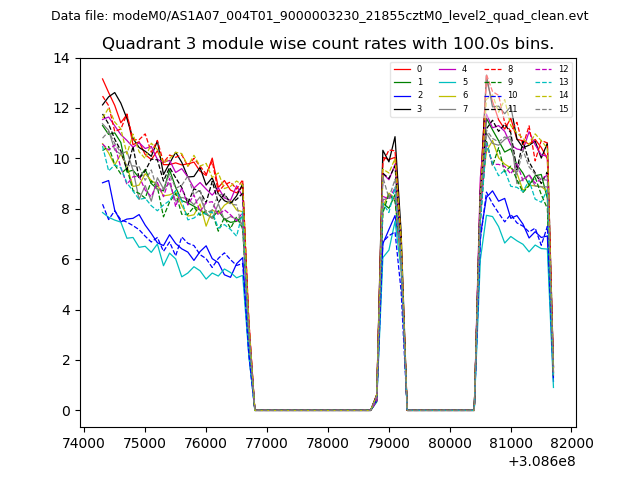
| Quadrant-wise count rates Data is divided into 100 sec bins |
 |
|
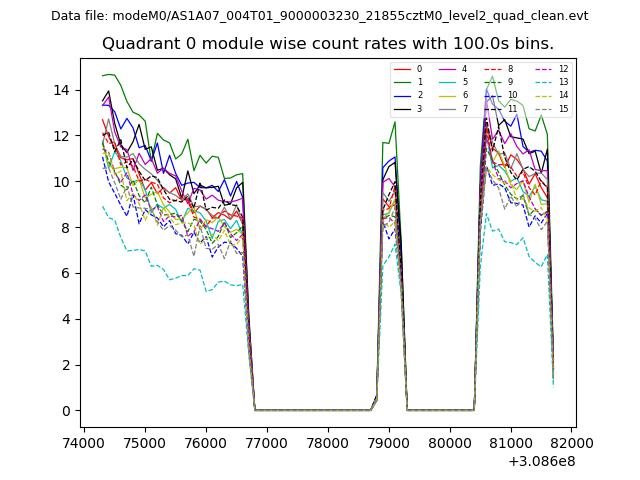
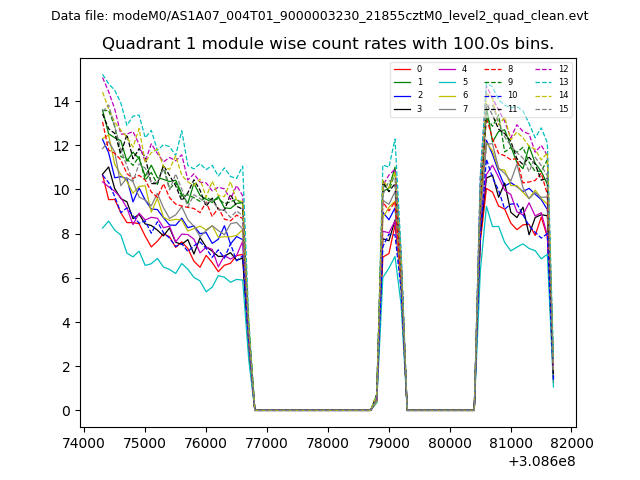
| Module-wise count rates for Quadrant A Data is divided into 100 sec bins |
 |
 |
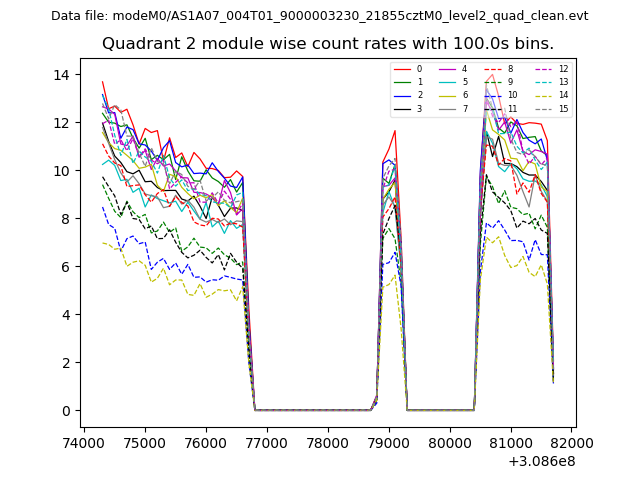
| Module-wise count rates for Quadrant B Data is divided into 100 sec bins |
 |
 |
| Module-wise count rates for Quadrant C Data is divided into 100 sec bins |
 |
 |
| Module-wise count rates for Quadrant D Data is divided into 100 sec bins |
 |
 |
| Parameter | Plot |
|---|---|
| CZT HV Monitor | 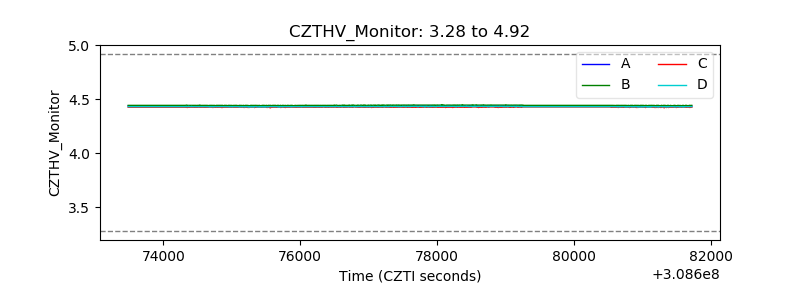 |
| D_VDD | 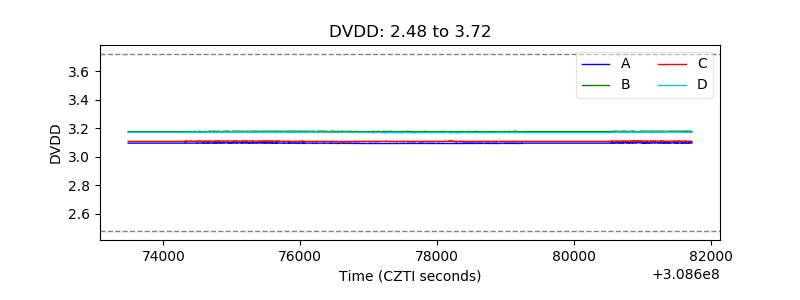 |
| Temperature 1 | 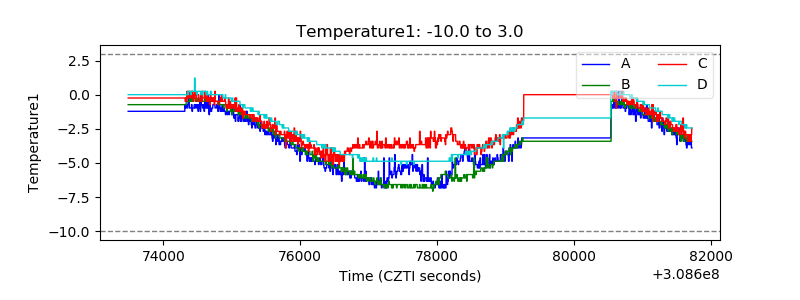 |
| Veto HV Monitor |  |
| Veto LLD | 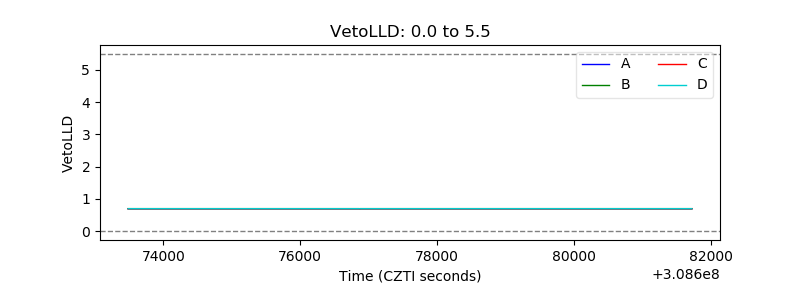 |
| Alpha Counter | 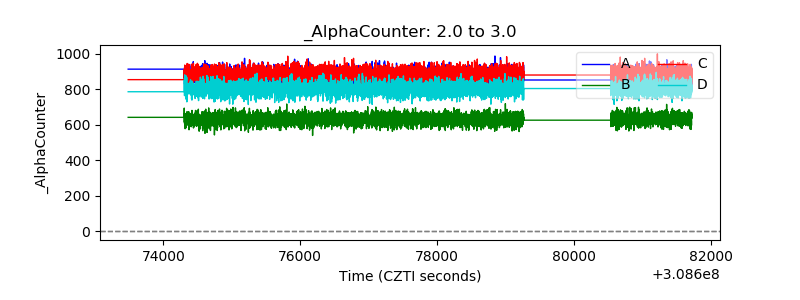 |
| _CPM_Rate |  |
| CZT Counter | 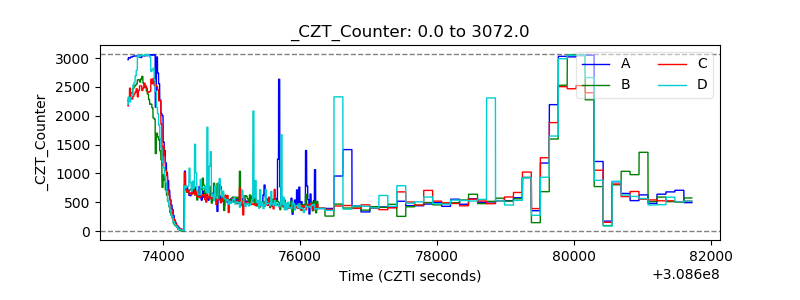 |
| +2.5 Volts monitor | 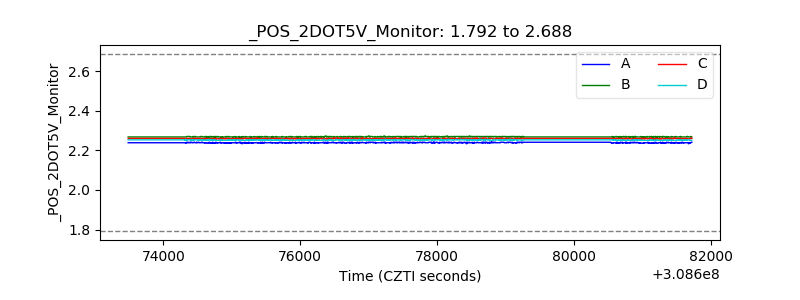 |
| +5 Volts monitor |  |
| _ROLL_ROT | 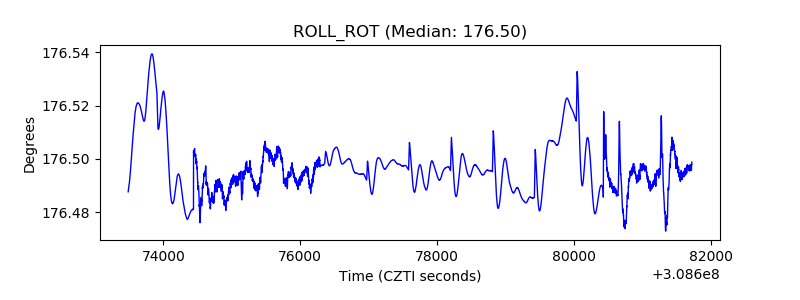 |
| _Roll_DEC | 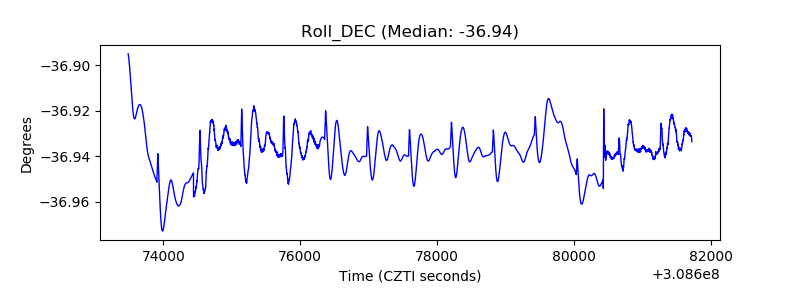 |
| _Roll_RA | 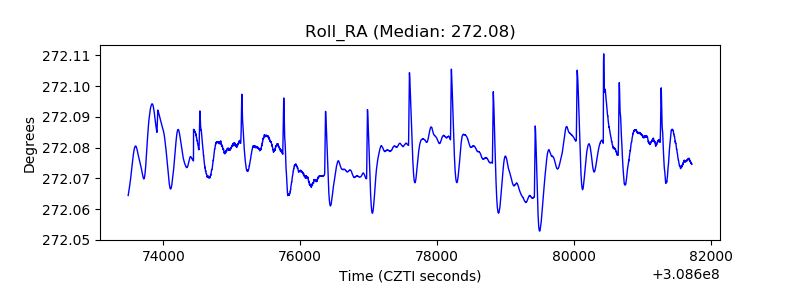 |
| Veto Counter | 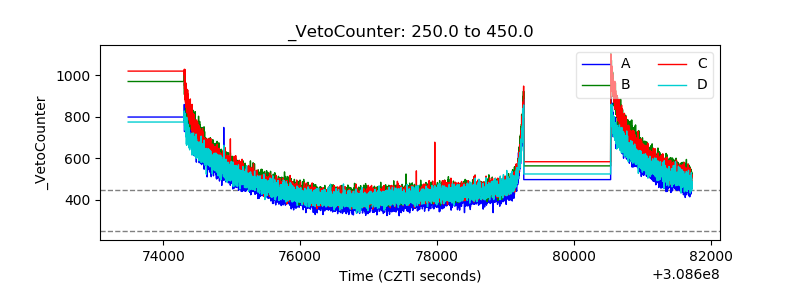 |