| Param | Original file | Final file |
|---|---|---|
| Filename | modeM0/AS1A07_004T01_9000003230_21857cztM0_level2.evt | modeM0/AS1A07_004T01_9000003230_21857cztM0_level2_quad_clean.evt |
| Size (bytes) | 101,926,080 | 29,934,720 |
| Size | 97.2 MB | 28.5 MB |
| Events in quadrant A | 686,525 | 206,804 |
| Events in quadrant B | 794,009 | 214,450 |
| Events in quadrant C | 677,838 | 201,545 |
| Events in quadrant D | 839,478 | 188,088 |
| Mode SS | |||
|---|---|---|---|
| Quadrant | BADHDUFLAG | Total packets | Discarded packets |
| A | 0 | 26 | 0 |
| B | 0 | 26 | 0 |
| C | 0 | 26 | 0 |
| D | 0 | 26 | 0 |
| Mode M0 | |||
|---|---|---|---|
| Quadrant | BADHDUFLAG | Total packets | Discarded packets |
| A | 0 | 2781 | 1 |
| B | 0 | 3131 | 1 |
| C | 0 | 2764 | 1 |
| D | 0 | 3302 | 1 |
| Mode M9 | |||
|---|---|---|---|
| Quadrant | BADHDUFLAG | Total packets | Discarded packets |
| A | 0 | 2 | 0 |
| B | 0 | 3 | 0 |
| C | 0 | 3 | 0 |
| D | 0 | 3 | 0 |
| Quadrant | Total seconds | Saturated seconds | Saturation percentage |
|---|---|---|---|
| A | 1264 | 9 | 0.712025% |
| B | 1264 | 28 | 2.215190% |
| C | 1264 | 9 | 0.712025% |
| D | 1264 | 51 | 4.034810% |
Noise dominated data is calculated using 1-second bins in cleaned event files. If a bin has >2000 counts, and if more than 50% of those come from <1% of pixels, then it is considered to be noise-dominated and hence unusable.
| Quadrant | # 1 sec bins | Bins with >0 counts | Bins with >2000 counts | High rate bins dominated by noise | Noise dominated (total time) | Noise dominated (detector-on time) | Marked lightcurve |
|---|---|---|---|---|---|---|---|
| A | 1264 | 1264 | 1 | 1 | 0.08% | 0.08% | 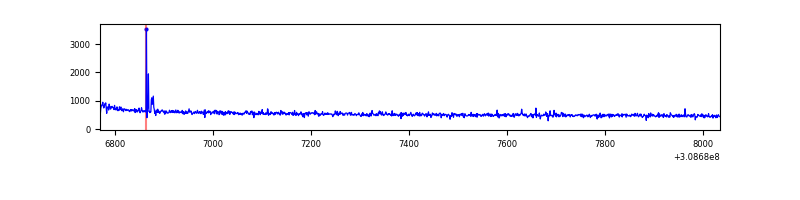 |
| B | 1264 | 1264 | 5 | 5 | 0.40% | 0.40% | 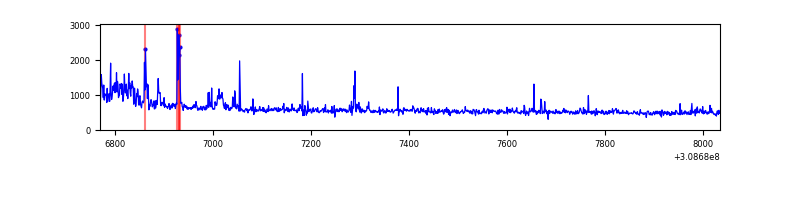 |
| C | 1264 | 1264 | 0 | 0 | 0.00% | 0.00% | 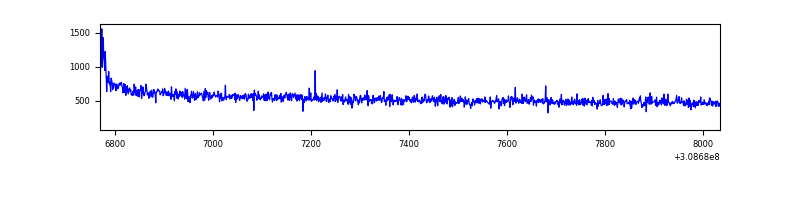 |
| D | 1264 | 1264 | 43 | 43 | 3.40% | 3.40% | 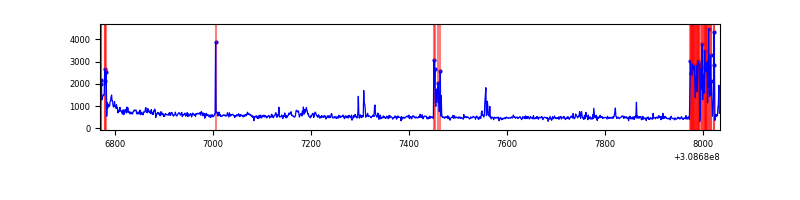 |
Top three noisy pixels from each quadrant. If the there are fewer than three noisy pixels in the level2.evt file, extra rows are filled as -1
| Pixel properties | Quadrant properties | ||||||
|---|---|---|---|---|---|---|---|
| Quadrant | DetID | PixID | Counts | Sigma | Mean | Median | Sigma |
| A | 4 | 2 | 8377 | 222.19 | 175 | 172 | 36.9 |
| A | 13 | 254 | 2741 | 69.57 | 175 | 172 | 36.9 |
| A | 0 | 226 | 1584 | 38.24 | 175 | 172 | 36.9 |
| B | 15 | 33 | 34418 | 983.78 | 177 | 173 | 34.8 |
| B | 5 | 172 | 17046 | 484.72 | 177 | 173 | 34.8 |
| B | 3 | 64 | 15475 | 439.59 | 177 | 173 | 34.8 |
| C | 14 | 238 | 26606 | 663.02 | 165 | 165 | 39.9 |
| C | 0 | 10 | 5670 | 138.04 | 165 | 165 | 39.9 |
| C | 13 | 61 | 1191 | 25.73 | 165 | 165 | 39.9 |
| D | 7 | 238 | 116268 | 2820.15 | 160 | 155 | 41.2 |
| D | 12 | 235 | 35915 | 868.54 | 160 | 155 | 41.2 |
| D | 13 | 249 | 19156 | 461.5 | 160 | 155 | 41.2 |
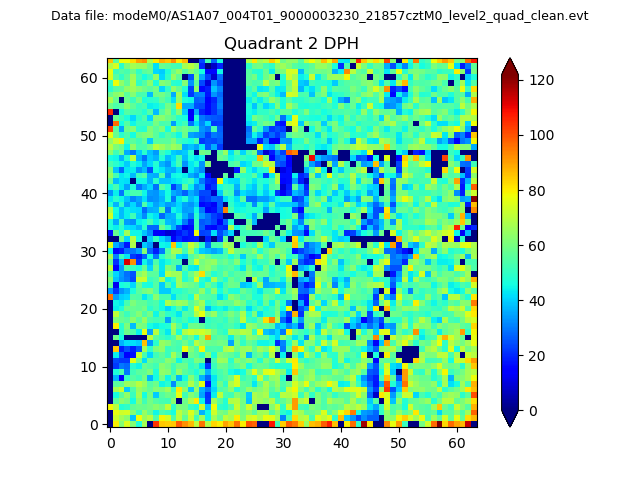
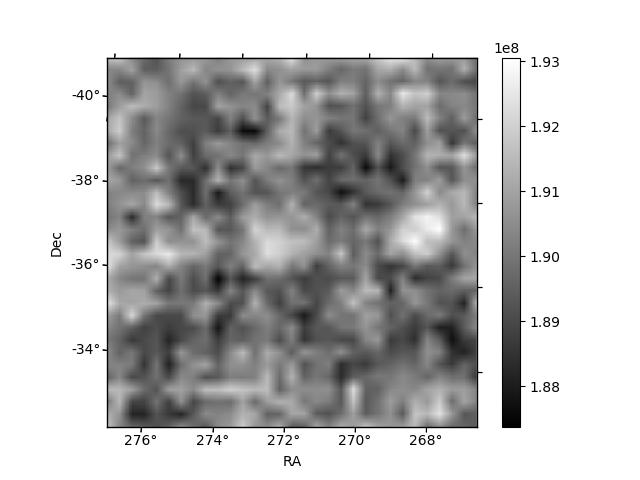
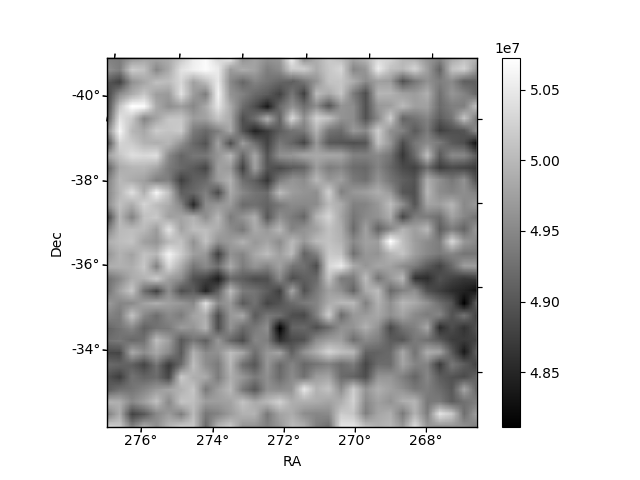
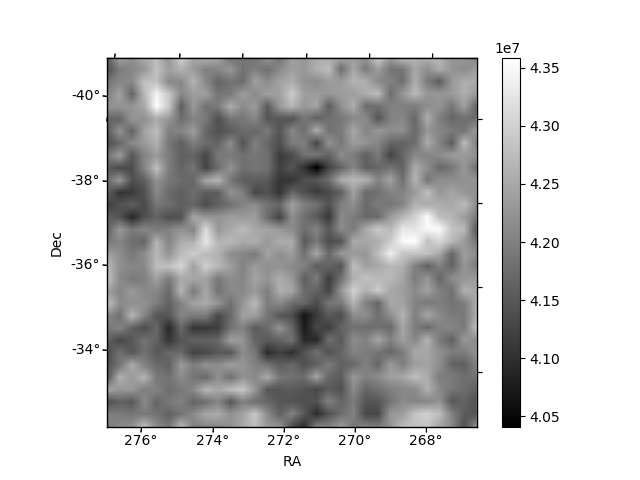
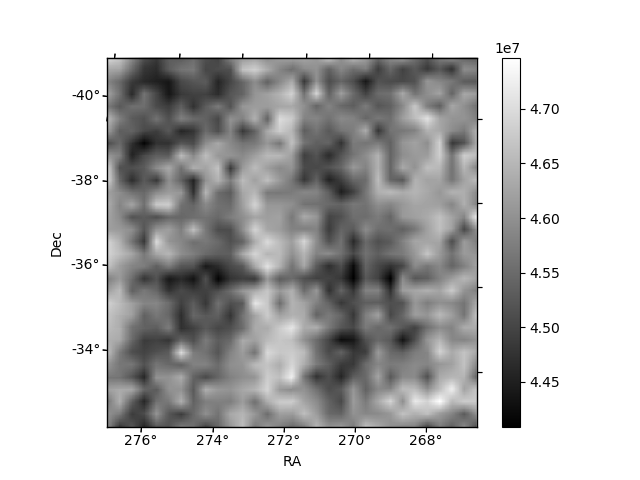
Histogram calculated using DETX and DETY for each event in the final _common_clean file
| Quadrant A | 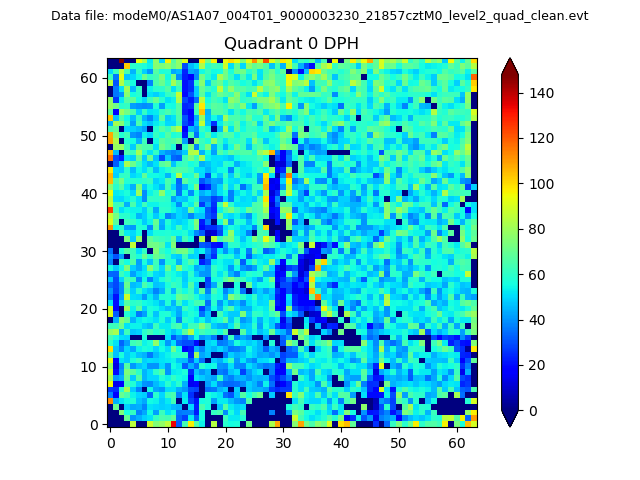 |
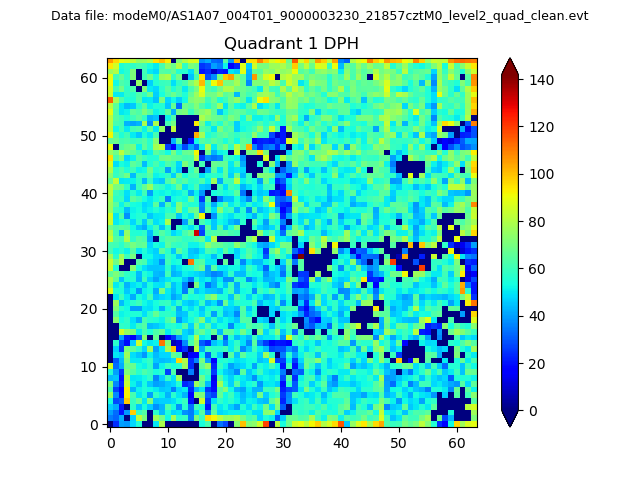 |
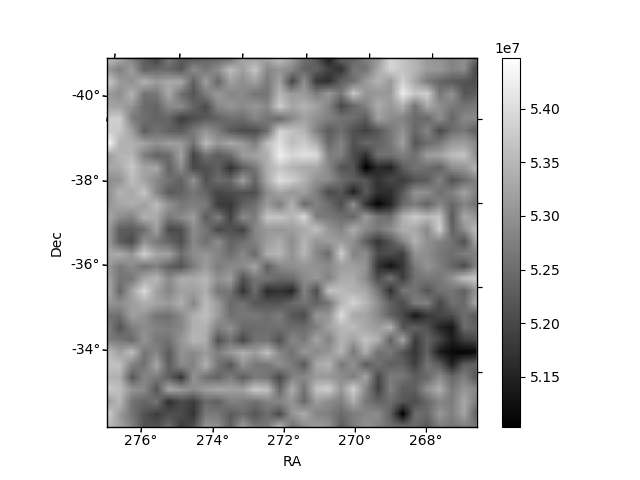
Quadrant B |
|---|---|---|---|
| Quadrant D | 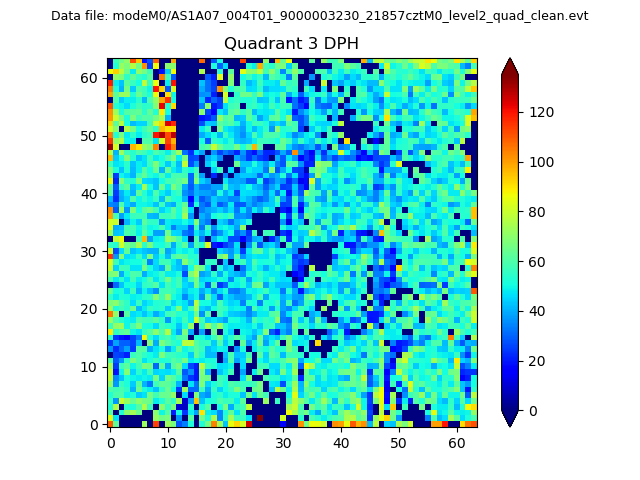 |
 |
Quadrant C |
| Plot type | Count rate plots | Images |
|---|---|---|
| Comparison with Poisson distribution Blue bars denote a histogram of data divided into 1 sec bins. Red curve is a Poisson curve with rate = median count rate of data. |
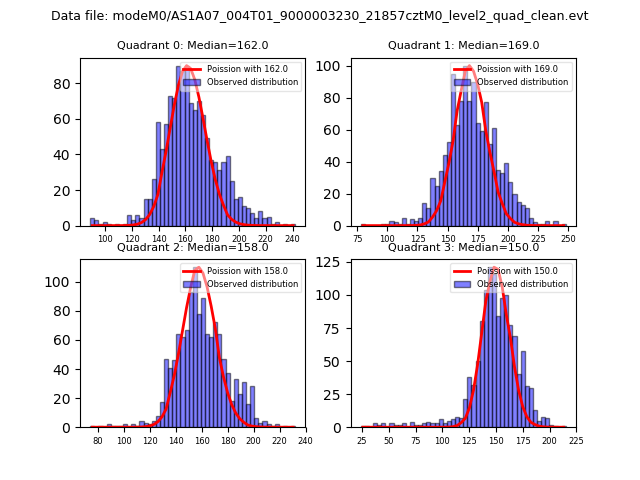 |
 |
| Quadrant-wise count rates Data is divided into 100 sec bins |
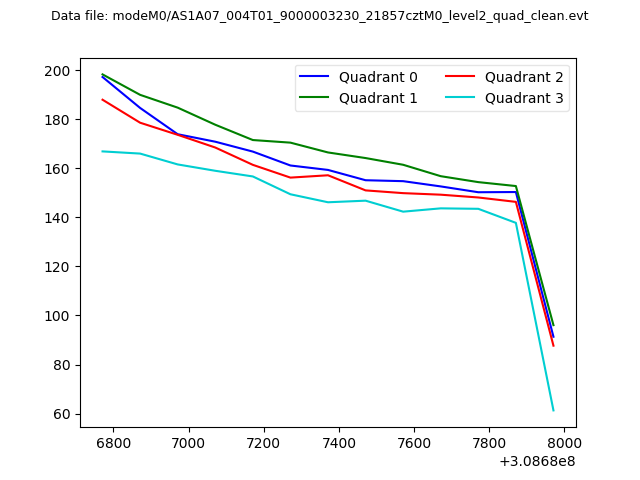 |
|
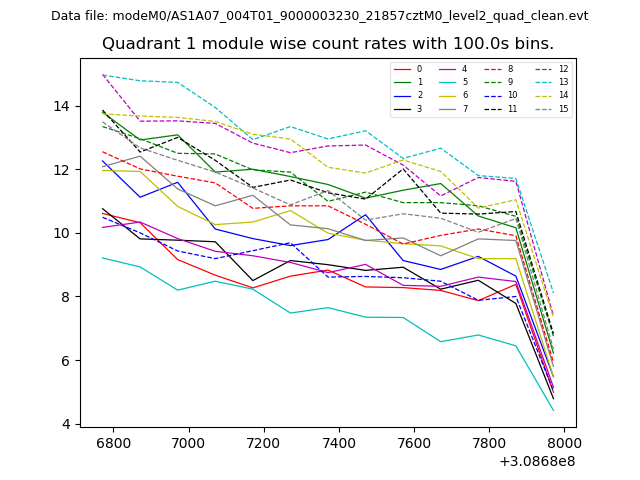
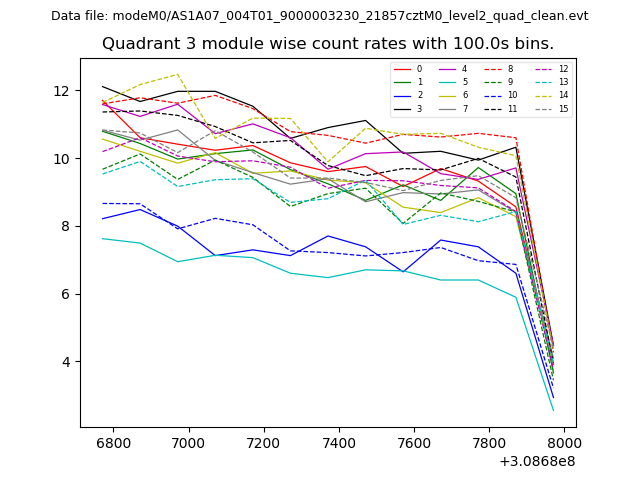
| Module-wise count rates for Quadrant A Data is divided into 100 sec bins |
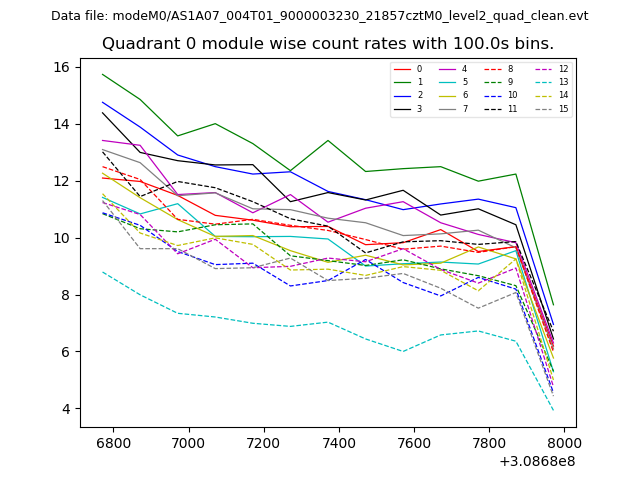 |
 |
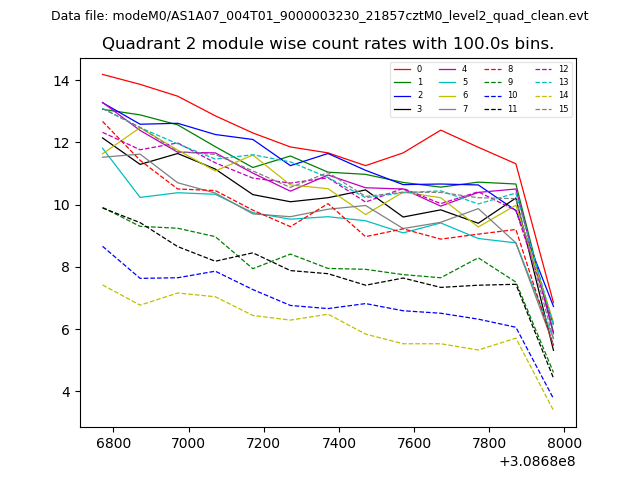
| Module-wise count rates for Quadrant B Data is divided into 100 sec bins |
 |
 |
| Module-wise count rates for Quadrant C Data is divided into 100 sec bins |
 |
 |
| Module-wise count rates for Quadrant D Data is divided into 100 sec bins |
 |
 |
| Parameter | Plot |
|---|---|
| CZT HV Monitor | 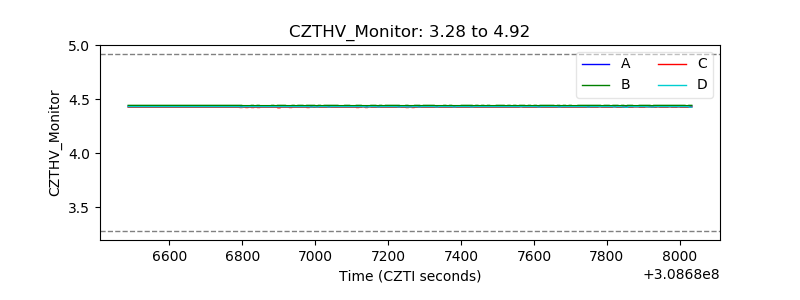 |
| D_VDD | 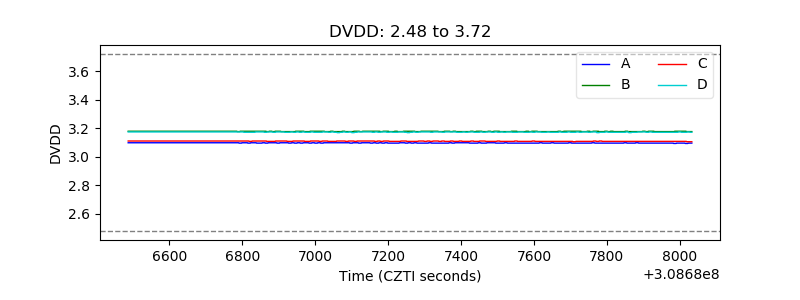 |
| Temperature 1 | 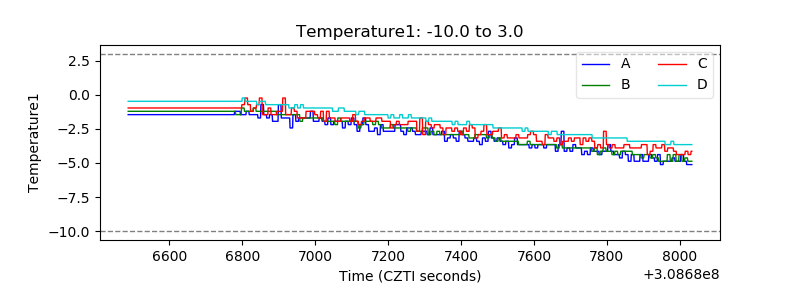 |
| Veto HV Monitor | 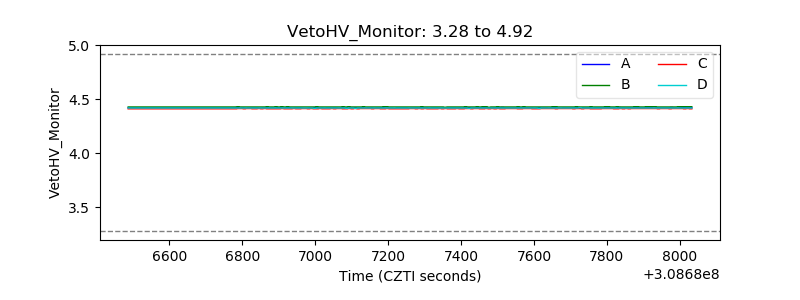 |
| Veto LLD | 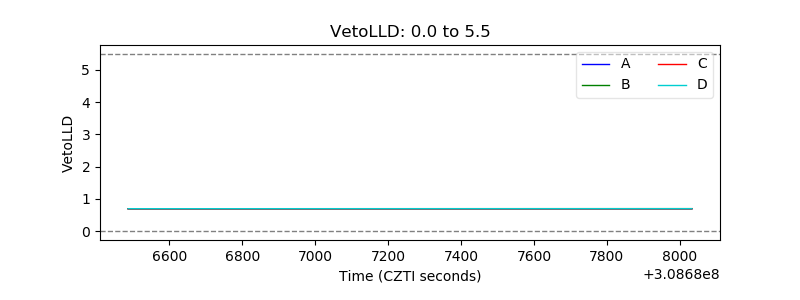 |
| Alpha Counter | 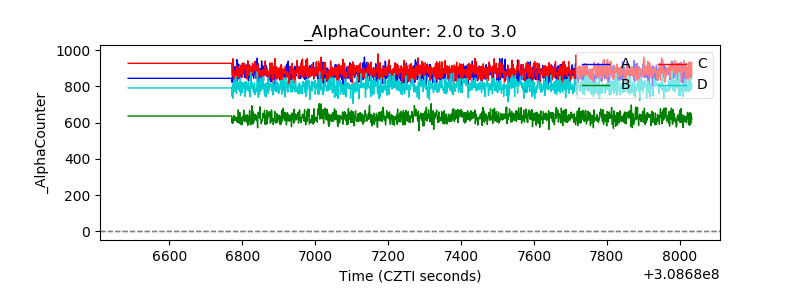 |
| _CPM_Rate |  |
| CZT Counter | 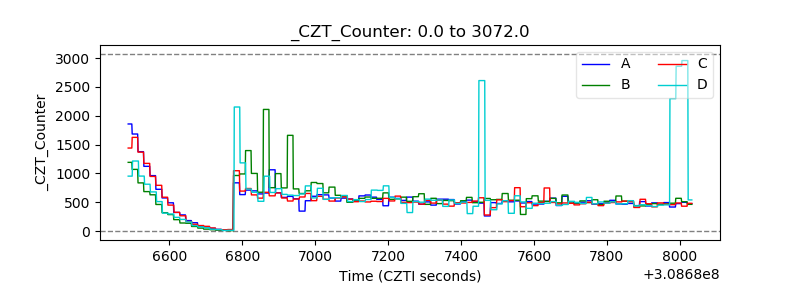 |
| +2.5 Volts monitor |  |
| +5 Volts monitor |  |
| _ROLL_ROT | 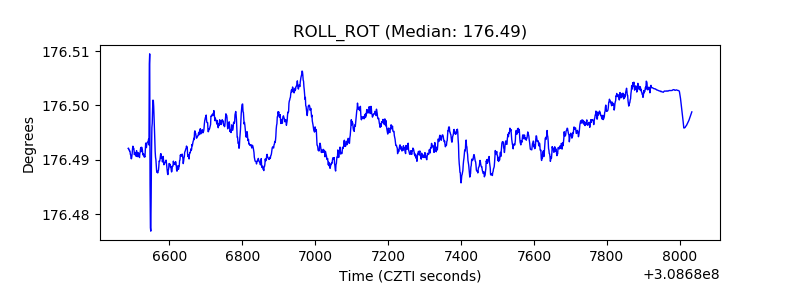 |
| _Roll_DEC | 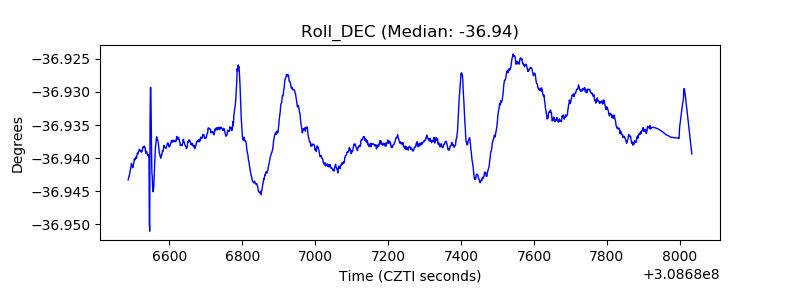 |
| _Roll_RA |  |
| Veto Counter | 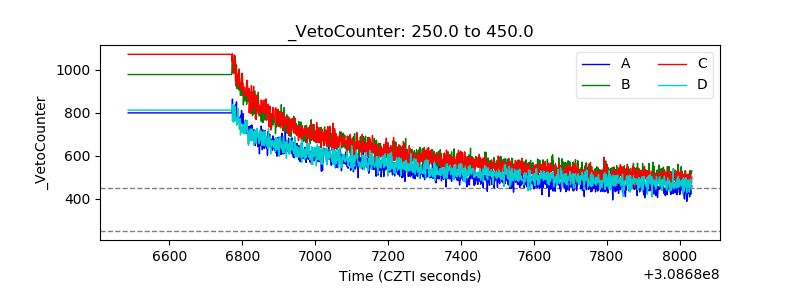 |