| Param | Original file | Final file |
|---|---|---|
| Filename | modeM0/AS1A07_118T01_9000003232_21857cztM0_level2.evt | modeM0/AS1A07_118T01_9000003232_21857cztM0_level2_quad_clean.evt |
| Size (bytes) | 336,700,800 | 51,353,280 |
| Size | 321.1 MB | 49.0 MB |
| Events in quadrant A | 2,256,665 | 317,020 |
| Events in quadrant B | 2,370,462 | 329,248 |
| Events in quadrant C | 2,263,720 | 313,252 |
| Events in quadrant D | 3,007,335 | 286,587 |
| Mode SS | |||
|---|---|---|---|
| Quadrant | BADHDUFLAG | Total packets | Discarded packets |
| A | 0 | 90 | 0 |
| B | 0 | 90 | 0 |
| C | 0 | 90 | 0 |
| D | 0 | 90 | 0 |
| Mode M9 | |||
|---|---|---|---|
| Quadrant | BADHDUFLAG | Total packets | Discarded packets |
| A | 0 | 13 | 0 |
| B | 0 | 13 | 0 |
| C | 0 | 13 | 0 |
| D | 0 | 13 | 0 |
| Mode M0 | |||
|---|---|---|---|
| Quadrant | BADHDUFLAG | Total packets | Discarded packets |
| A | 0 | 9400 | 1 |
| B | 0 | 9687 | 1 |
| C | 0 | 9382 | 1 |
| D | 0 | 11830 | 1 |
| Quadrant | Total seconds | Saturated seconds | Saturation percentage |
|---|---|---|---|
| A | 4383 | 77 | 1.756788% |
| B | 4383 | 95 | 2.167465% |
| C | 4383 | 96 | 2.190281% |
| D | 4383 | 223 | 5.087839% |
Noise dominated data is calculated using 1-second bins in cleaned event files. If a bin has >2000 counts, and if more than 50% of those come from <1% of pixels, then it is considered to be noise-dominated and hence unusable.
| Quadrant | # 1 sec bins | Bins with >0 counts | Bins with >2000 counts | High rate bins dominated by noise | Noise dominated (total time) | Noise dominated (detector-on time) | Marked lightcurve |
|---|---|---|---|---|---|---|---|
| A | 5693 | 4384 | 2 | 2 | 0.04% | 0.05% | 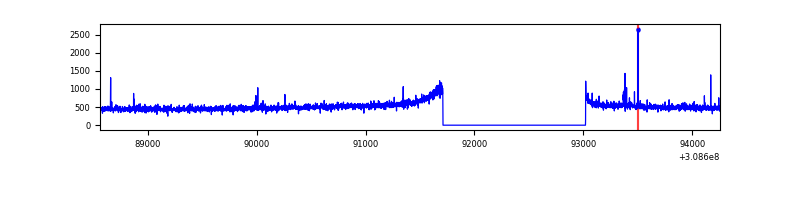 |
| B | 5693 | 4384 | 8 | 8 | 0.14% | 0.18% | 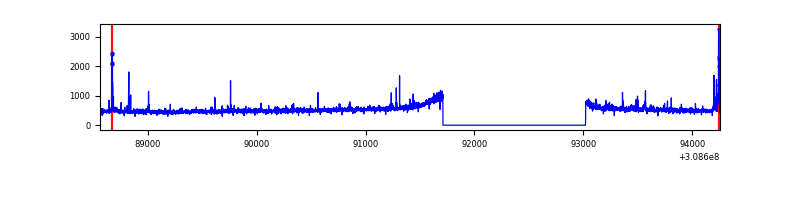 |
| C | 5693 | 4383 | 0 | 0 | 0.00% | 0.00% | 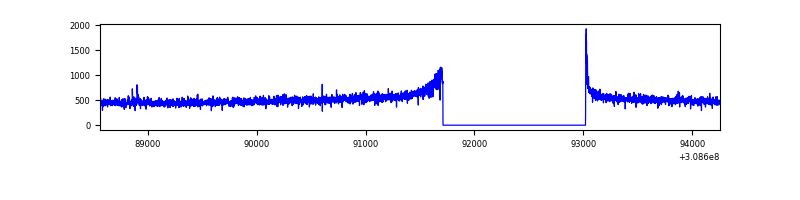 |
| D | 5693 | 4384 | 177 | 177 | 3.11% | 4.04% | 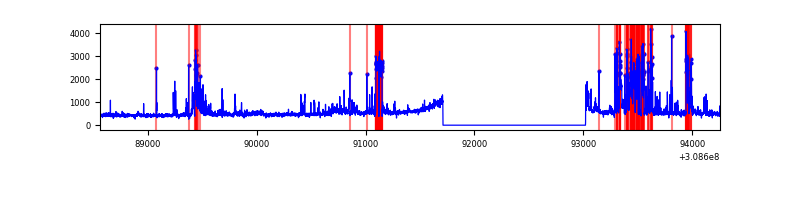 |
Top three noisy pixels from each quadrant. If the there are fewer than three noisy pixels in the level2.evt file, extra rows are filled as -1
| Pixel properties | Quadrant properties | ||||||
|---|---|---|---|---|---|---|---|
| Quadrant | DetID | PixID | Counts | Sigma | Mean | Median | Sigma |
| A | 4 | 2 | 27639 | 231.07 | 575 | 563 | 117.2 |
| A | 13 | 254 | 8379 | 66.7 | 575 | 563 | 117.2 |
| A | 14 | 235 | 6584 | 51.38 | 575 | 563 | 117.2 |
| B | 3 | 64 | 73494 | 650.66 | 580 | 567 | 112.1 |
| B | 12 | 111 | 12707 | 108.31 | 580 | 567 | 112.1 |
| B | 0 | 190 | 11144 | 94.37 | 580 | 567 | 112.1 |
| C | 14 | 238 | 88990 | 681.46 | 552 | 557 | 129.8 |
| C | 0 | 10 | 16434 | 122.35 | 552 | 557 | 129.8 |
| C | 10 | 23 | 4155 | 27.73 | 552 | 557 | 129.8 |
| D | 1 | 52 | 582210 | 4392.57 | 542 | 526 | 132.4 |
| D | 13 | 104 | 183922 | 1384.91 | 542 | 526 | 132.4 |
| D | 7 | 238 | 125421 | 943.14 | 542 | 526 | 132.4 |
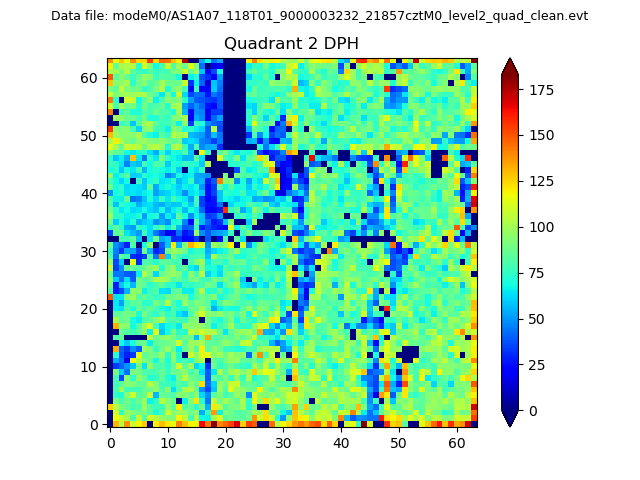
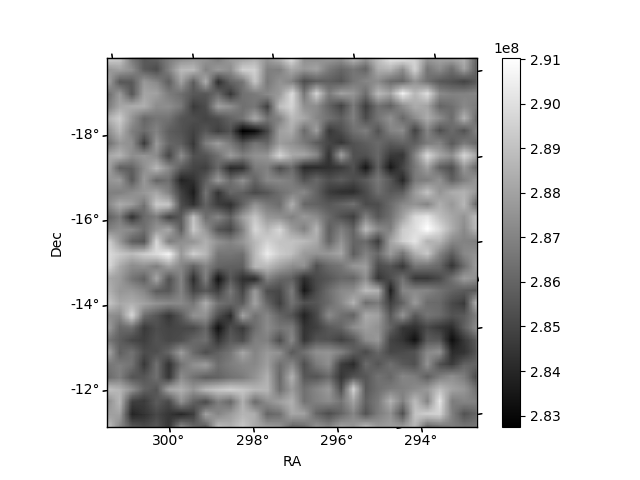
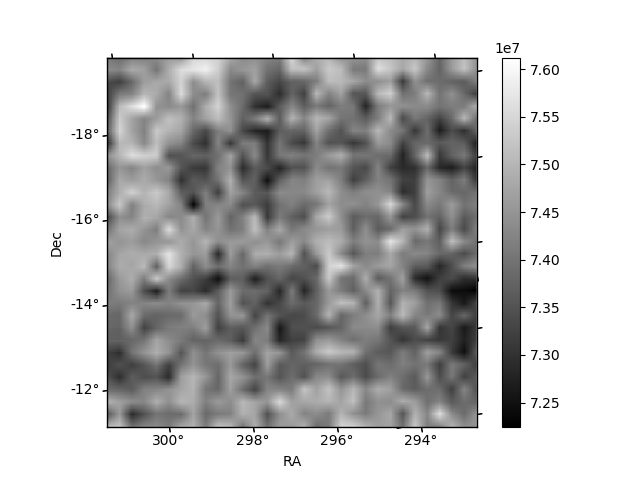
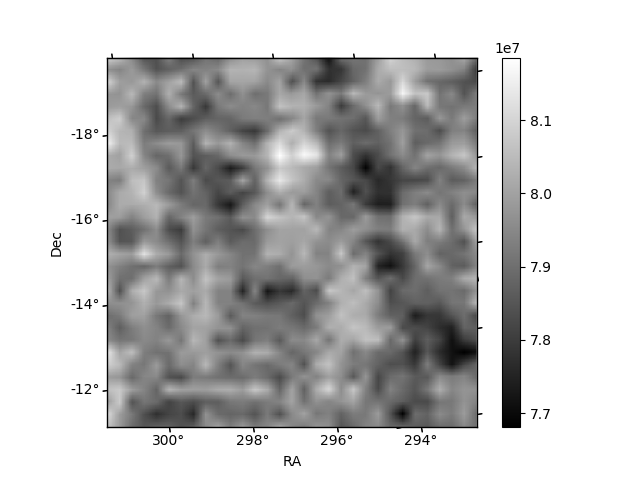
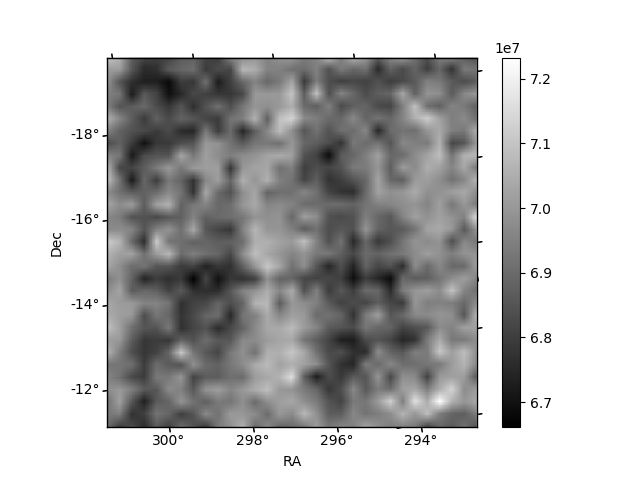
Histogram calculated using DETX and DETY for each event in the final _common_clean file
| Quadrant A | 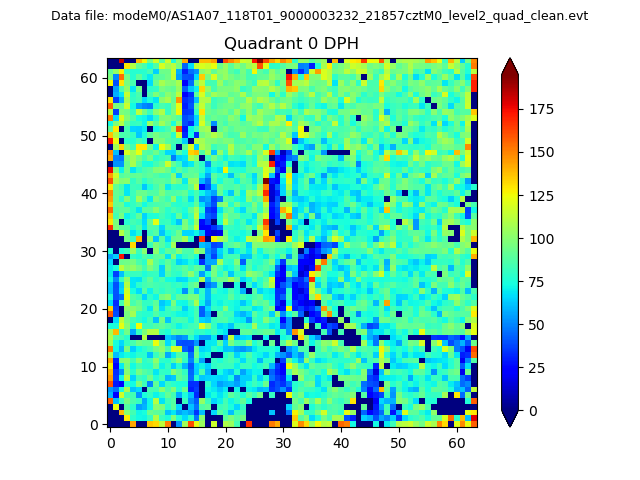 |
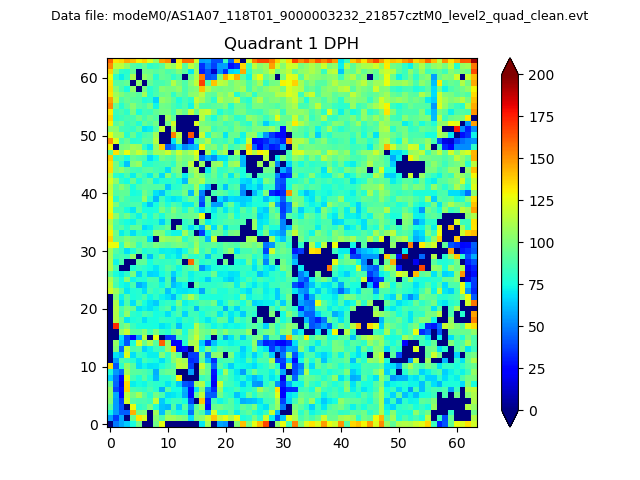 |
Quadrant B |
|---|---|---|---|
| Quadrant D | 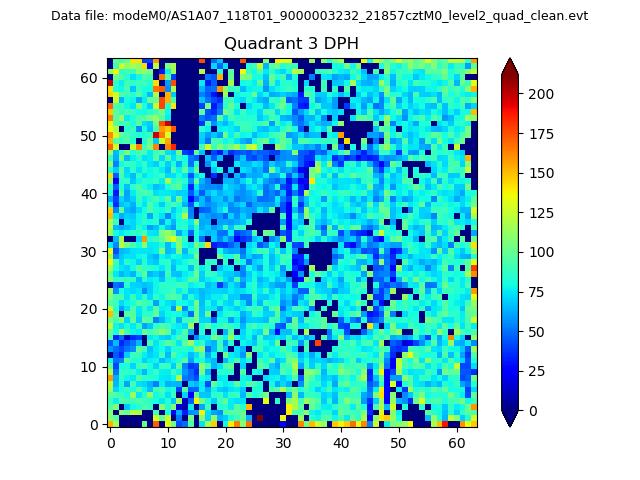 |
 |
Quadrant C |
| Plot type | Count rate plots | Images |
|---|---|---|
| Comparison with Poisson distribution Blue bars denote a histogram of data divided into 1 sec bins. Red curve is a Poisson curve with rate = median count rate of data. |
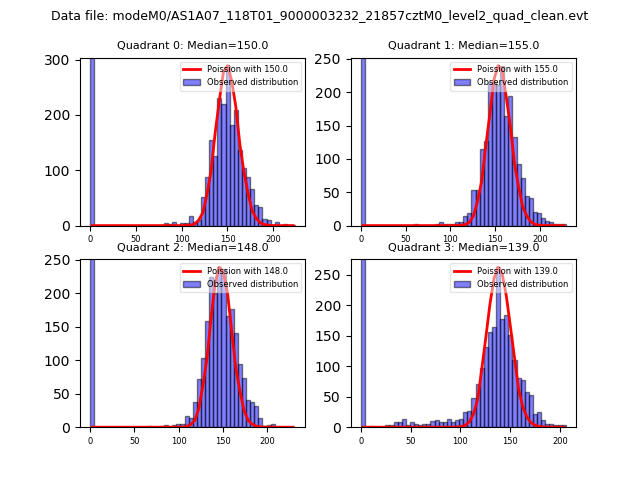 |
 |
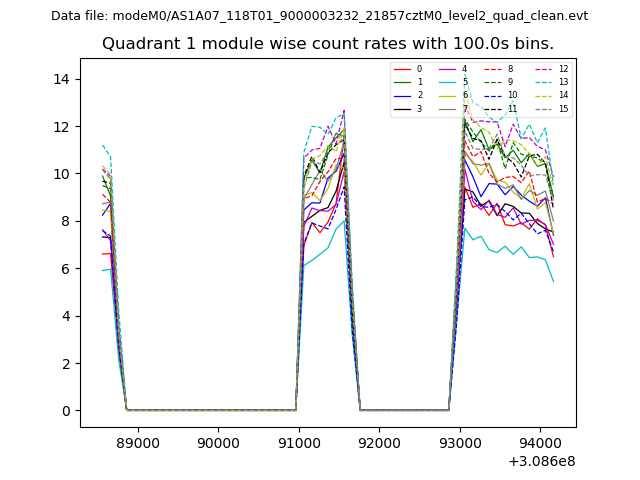
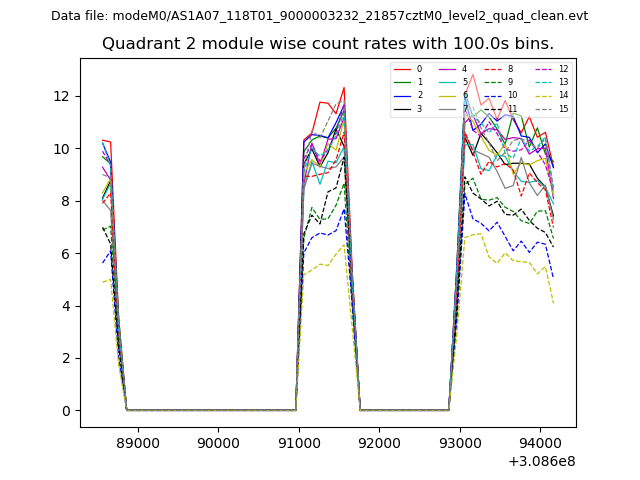
| Quadrant-wise count rates Data is divided into 100 sec bins |
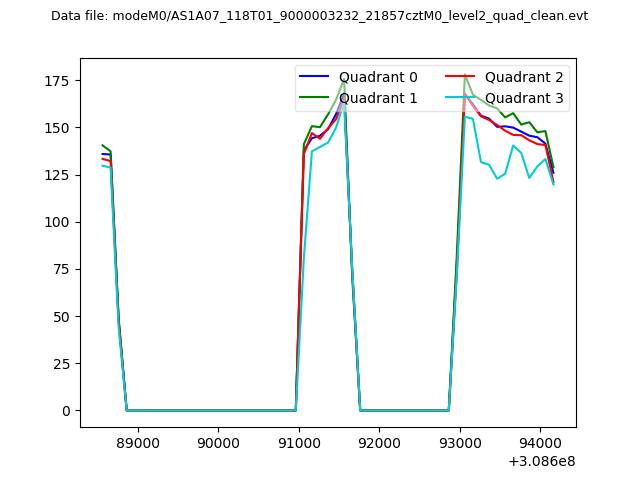 |
|
| Module-wise count rates for Quadrant A Data is divided into 100 sec bins |
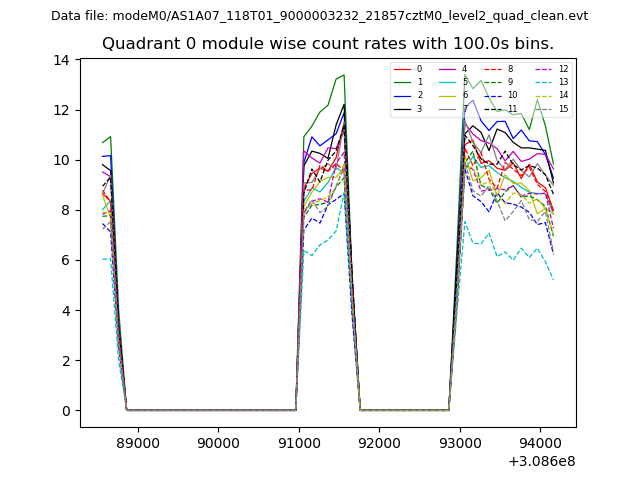 |
 |
| Module-wise count rates for Quadrant B Data is divided into 100 sec bins |
 |
 |
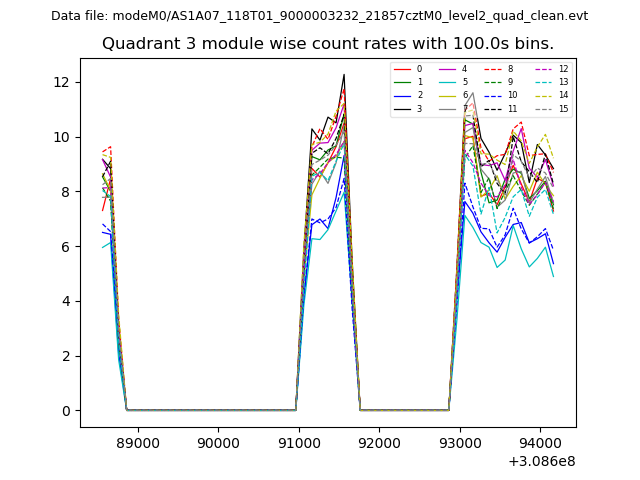
| Module-wise count rates for Quadrant C Data is divided into 100 sec bins |
 |
 |
| Module-wise count rates for Quadrant D Data is divided into 100 sec bins |
 |
 |
| Parameter | Plot |
|---|---|
| CZT HV Monitor | 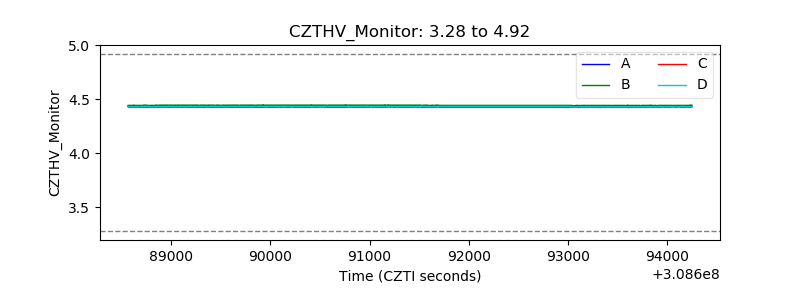 |
| D_VDD | 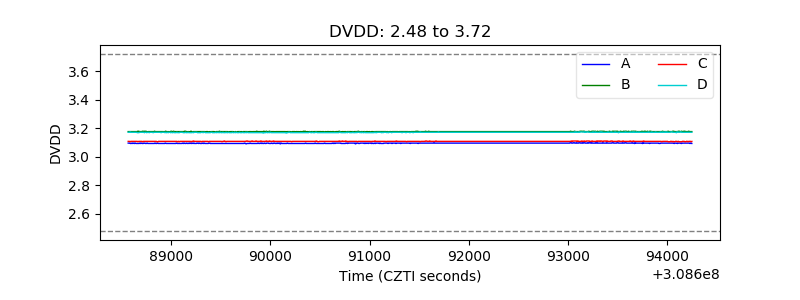 |
| Temperature 1 | 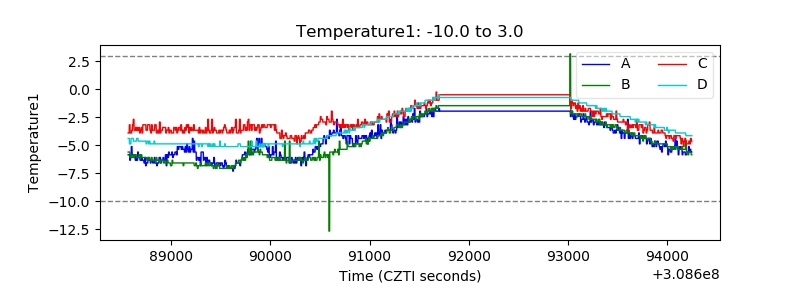 |
| Veto HV Monitor | 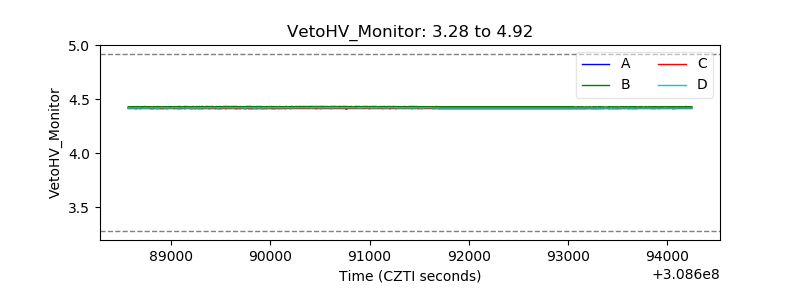 |
| Veto LLD | 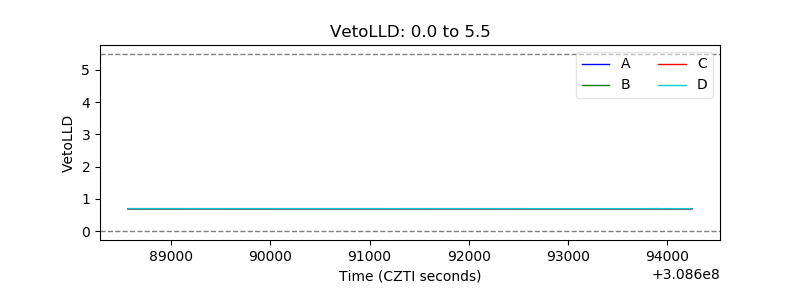 |
| Alpha Counter | 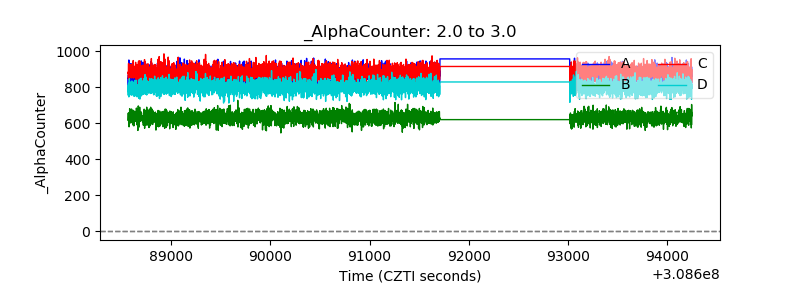 |
| _CPM_Rate | 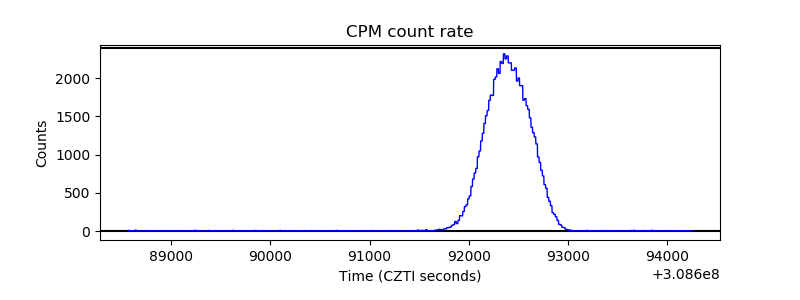 |
| CZT Counter | 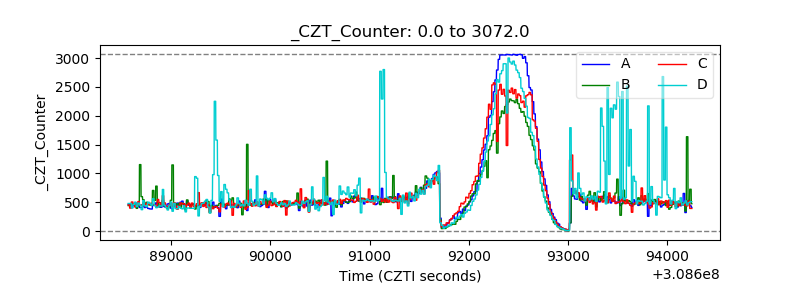 |
| +2.5 Volts monitor |  |
| +5 Volts monitor |  |
| _ROLL_ROT | 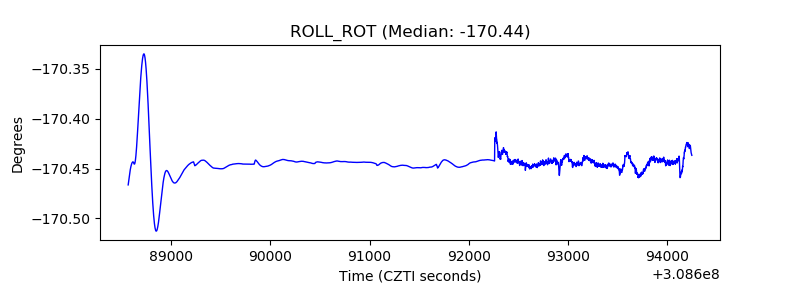 |
| _Roll_DEC | 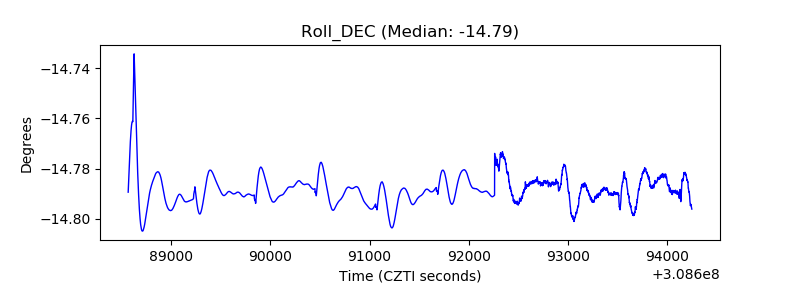 |
| _Roll_RA | 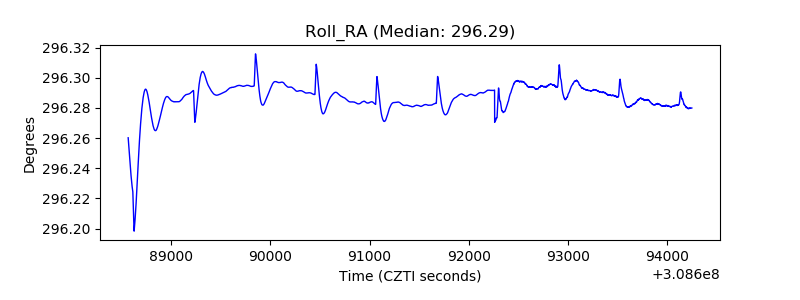 |
| Veto Counter | 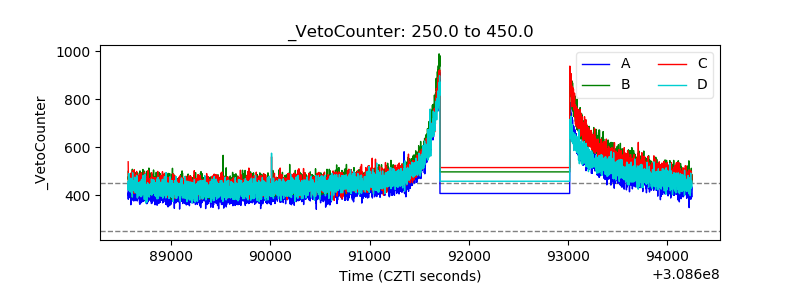 |