| Param | Original file | Final file |
|---|---|---|
| Filename | modeM0/AS1A07_118T01_9000003232_21858cztM0_level2.evt | modeM0/AS1A07_118T01_9000003232_21858cztM0_level2_quad_clean.evt |
| Size (bytes) | 493,704,000 | 91,065,600 |
| Size | 470.8 MB | 86.8 MB |
| Events in quadrant A | 3,241,500 | 586,120 |
| Events in quadrant B | 3,424,077 | 606,330 |
| Events in quadrant C | 3,280,819 | 578,346 |
| Events in quadrant D | 4,568,212 | 537,829 |
| Mode SS | |||
|---|---|---|---|
| Quadrant | BADHDUFLAG | Total packets | Discarded packets |
| A | 0 | 134 | 0 |
| B | 0 | 134 | 0 |
| C | 0 | 134 | 0 |
| D | 0 | 134 | 0 |
| Mode M9 | |||
|---|---|---|---|
| Quadrant | BADHDUFLAG | Total packets | Discarded packets |
| A | 0 | 25 | 0 |
| B | 0 | 25 | 0 |
| C | 0 | 25 | 0 |
| D | 0 | 25 | 0 |
| Mode M0 | |||
|---|---|---|---|
| Quadrant | BADHDUFLAG | Total packets | Discarded packets |
| A | 0 | 13686 | 2 |
| B | 0 | 14117 | 2 |
| C | 0 | 13695 | 2 |
| D | 0 | 17787 | 2 |
| Quadrant | Total seconds | Saturated seconds | Saturation percentage |
|---|---|---|---|
| A | 6434 | 81 | 1.258937% |
| B | 6434 | 125 | 1.942804% |
| C | 6433 | 124 | 1.927561% |
| D | 6434 | 307 | 4.771526% |
Noise dominated data is calculated using 1-second bins in cleaned event files. If a bin has >2000 counts, and if more than 50% of those come from <1% of pixels, then it is considered to be noise-dominated and hence unusable.
| Quadrant | # 1 sec bins | Bins with >0 counts | Bins with >2000 counts | High rate bins dominated by noise | Noise dominated (total time) | Noise dominated (detector-on time) | Marked lightcurve |
|---|---|---|---|---|---|---|---|
| A | 8934 | 6436 | 7 | 7 | 0.08% | 0.11% | 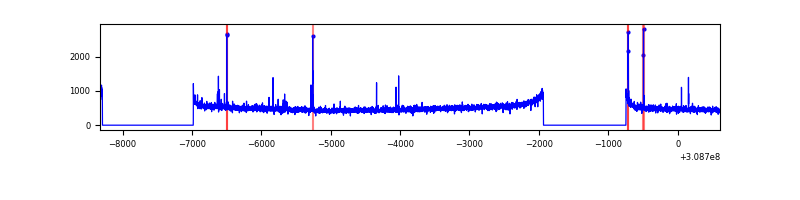 |
| B | 8934 | 6436 | 14 | 14 | 0.16% | 0.22% | 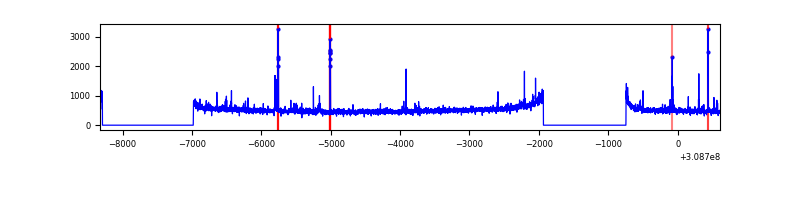 |
| C | 8933 | 6434 | 3 | 3 | 0.03% | 0.05% | 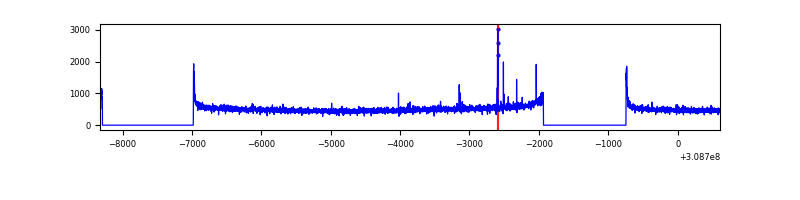 |
| D | 8934 | 6436 | 269 | 269 | 3.01% | 4.18% | 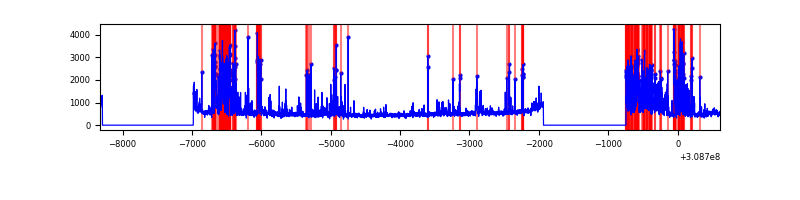 |
Top three noisy pixels from each quadrant. If the there are fewer than three noisy pixels in the level2.evt file, extra rows are filled as -1
| Pixel properties | Quadrant properties | ||||||
|---|---|---|---|---|---|---|---|
| Quadrant | DetID | PixID | Counts | Sigma | Mean | Median | Sigma |
| A | 4 | 2 | 58642 | 346.55 | 824 | 808 | 166.9 |
| A | 13 | 254 | 11954 | 66.79 | 824 | 808 | 166.9 |
| A | 0 | 226 | 7247 | 38.58 | 824 | 808 | 166.9 |
| B | 3 | 64 | 93876 | 585.73 | 832 | 811 | 158.9 |
| B | 0 | 230 | 28972 | 177.24 | 832 | 811 | 158.9 |
| B | 0 | 190 | 28797 | 176.14 | 832 | 811 | 158.9 |
| C | 14 | 238 | 126141 | 675.35 | 794 | 802 | 185.6 |
| C | 5 | 112 | 29645 | 155.41 | 794 | 802 | 185.6 |
| C | 0 | 10 | 29613 | 155.24 | 794 | 802 | 185.6 |
| D | 1 | 52 | 812299 | 4245.61 | 783 | 762 | 191.1 |
| D | 7 | 238 | 512334 | 2676.32 | 783 | 762 | 191.1 |
| D | 13 | 104 | 190820 | 994.3 | 783 | 762 | 191.1 |
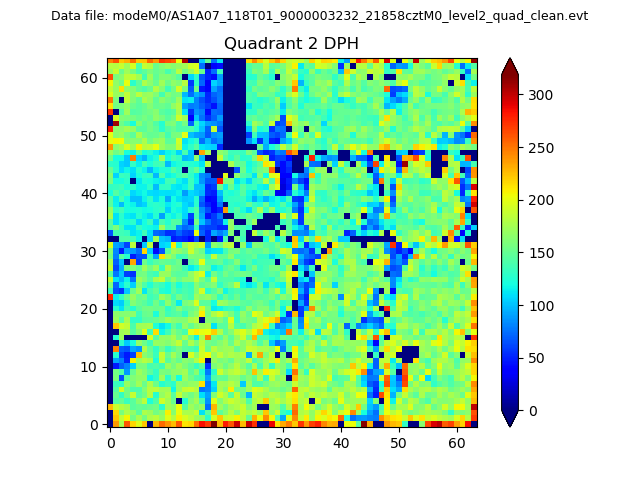
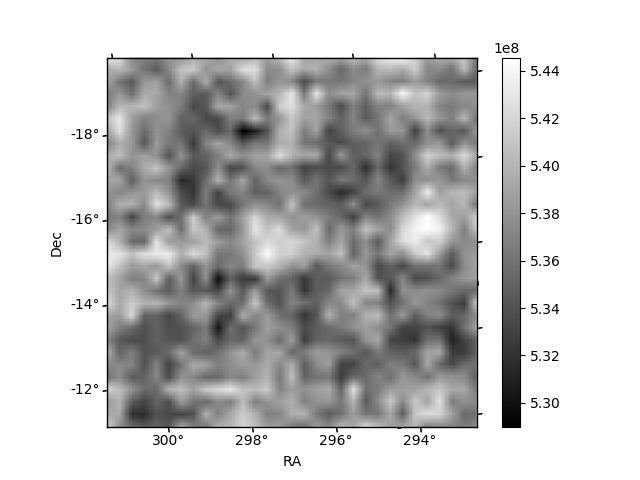
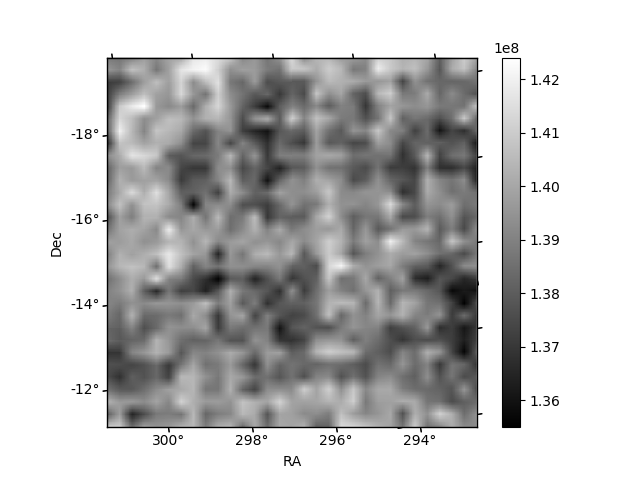
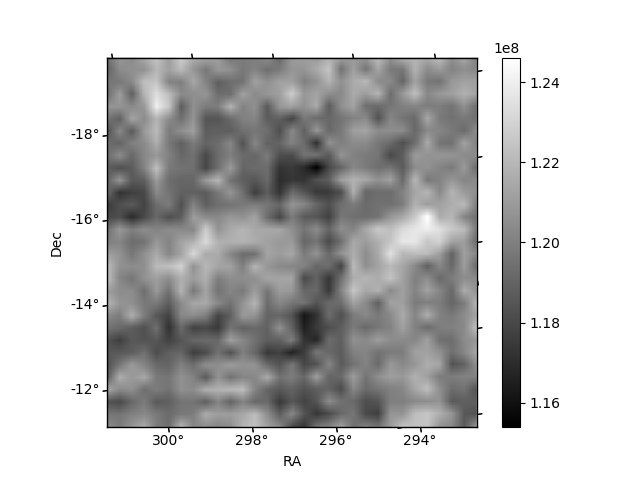
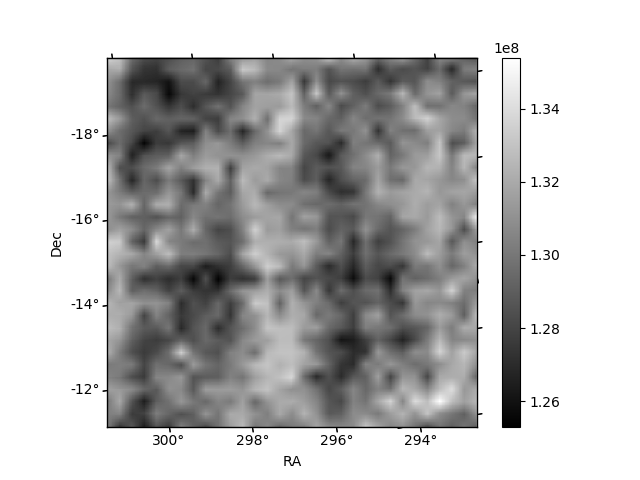
Histogram calculated using DETX and DETY for each event in the final _common_clean file
| Quadrant A | 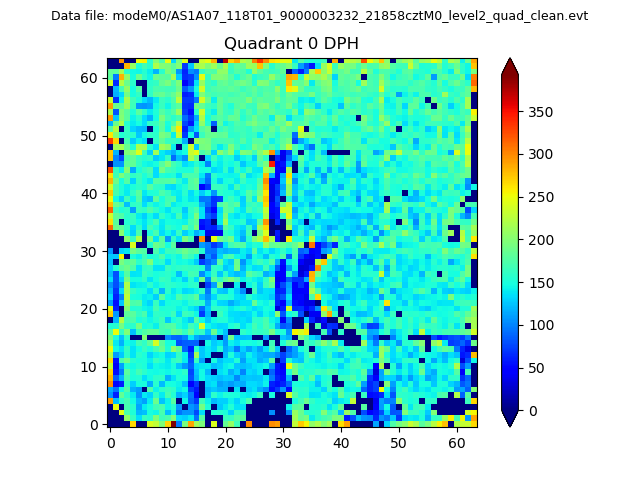 |
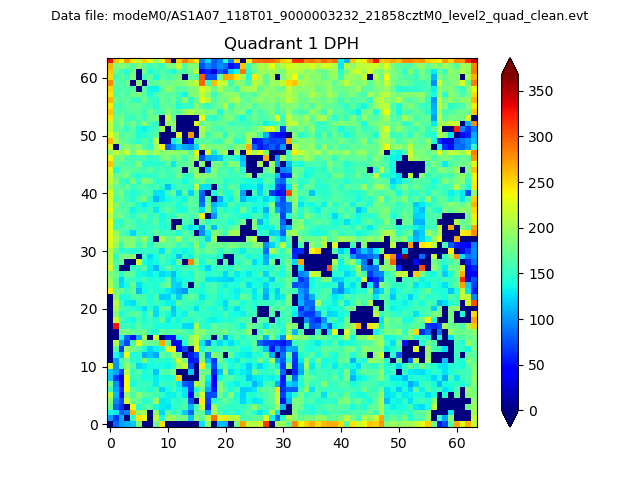 |
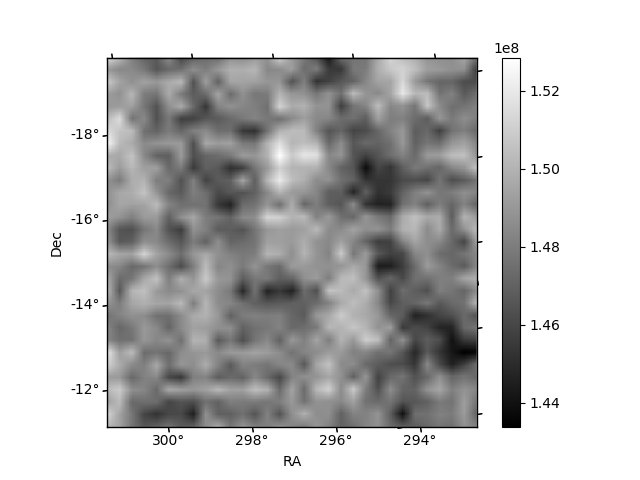
Quadrant B |
|---|---|---|---|
| Quadrant D | 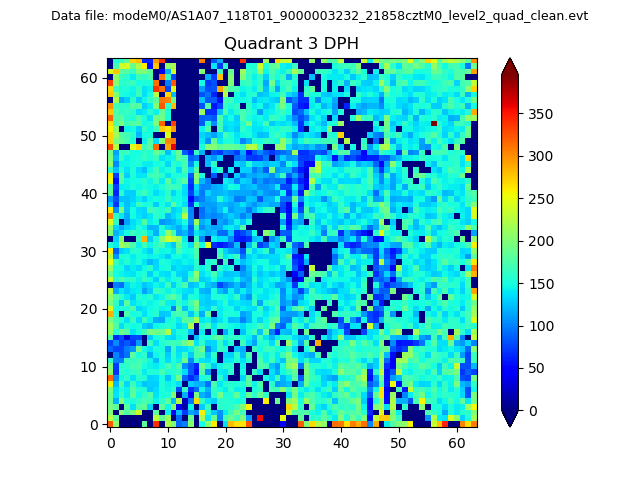 |
 |
Quadrant C |
| Plot type | Count rate plots | Images |
|---|---|---|
| Comparison with Poisson distribution Blue bars denote a histogram of data divided into 1 sec bins. Red curve is a Poisson curve with rate = median count rate of data. |
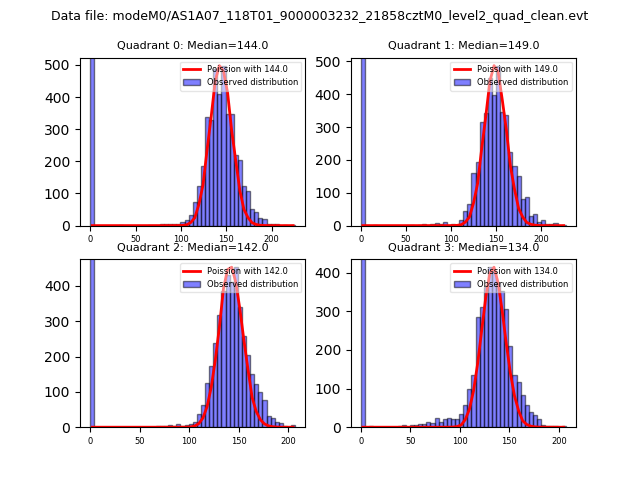 |
 |
| Quadrant-wise count rates Data is divided into 100 sec bins |
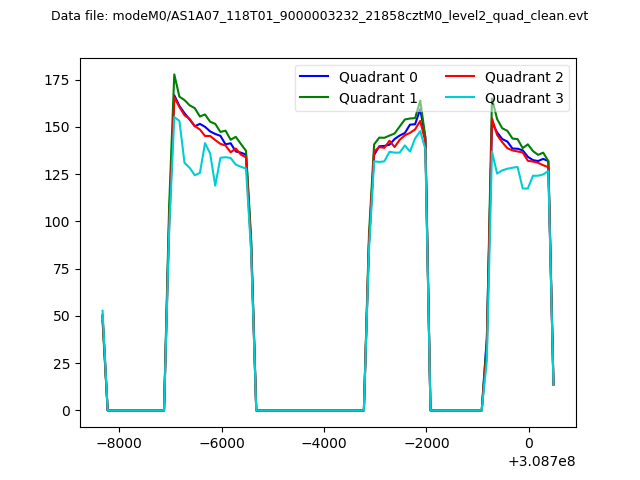 |
|
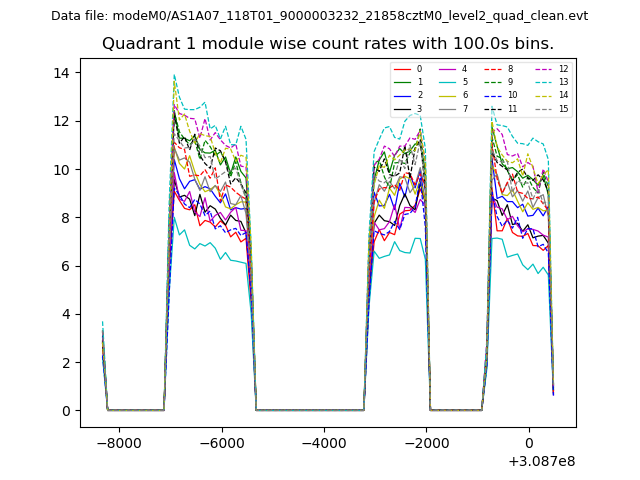
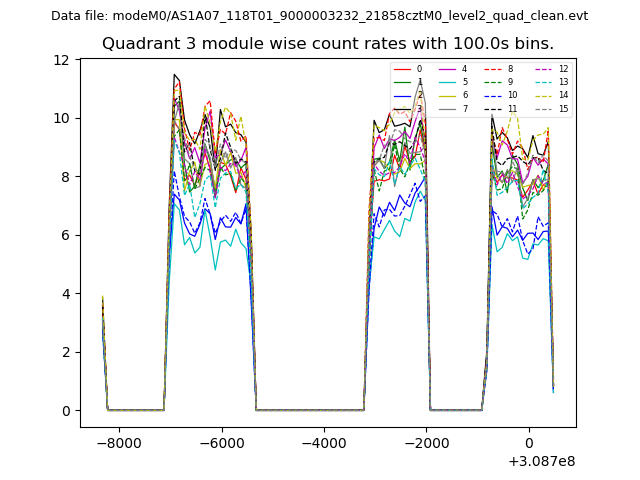
| Module-wise count rates for Quadrant A Data is divided into 100 sec bins |
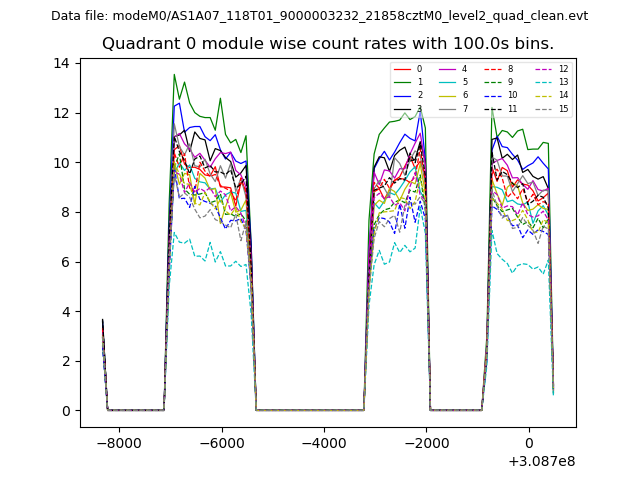 |
 |
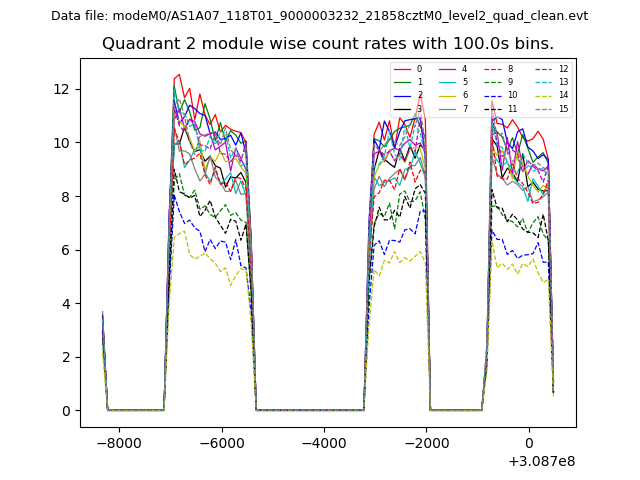
| Module-wise count rates for Quadrant B Data is divided into 100 sec bins |
 |
 |
| Module-wise count rates for Quadrant C Data is divided into 100 sec bins |
 |
 |
| Module-wise count rates for Quadrant D Data is divided into 100 sec bins |
 |
 |
| Parameter | Plot |
|---|---|
| CZT HV Monitor | 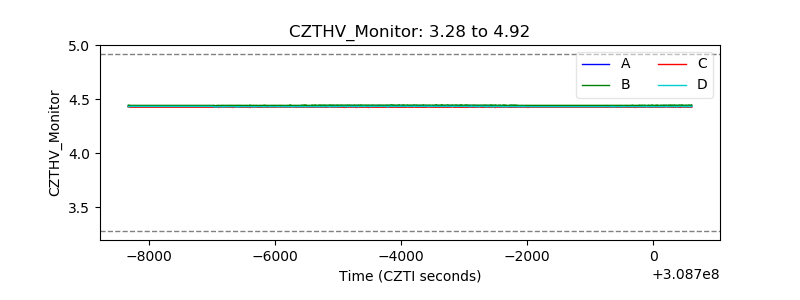 |
| D_VDD | 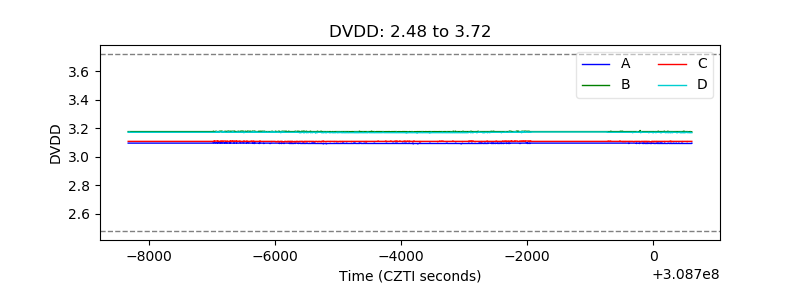 |
| Temperature 1 | 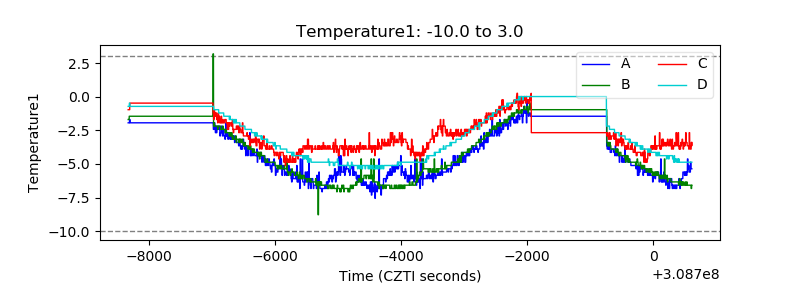 |
| Veto HV Monitor | 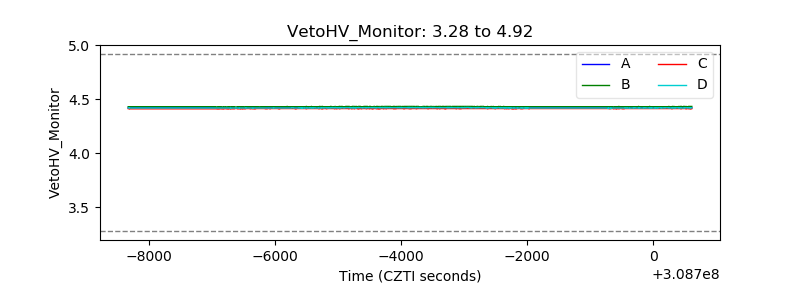 |
| Veto LLD | 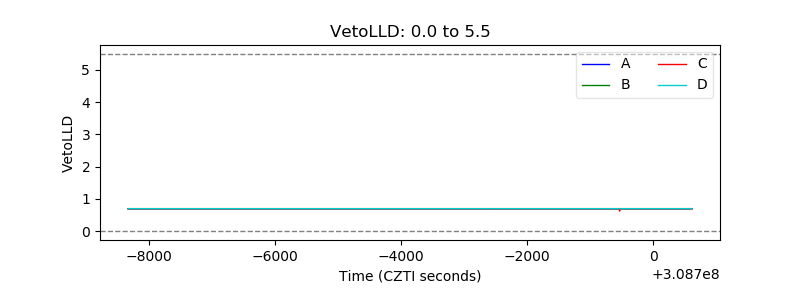 |
| Alpha Counter | 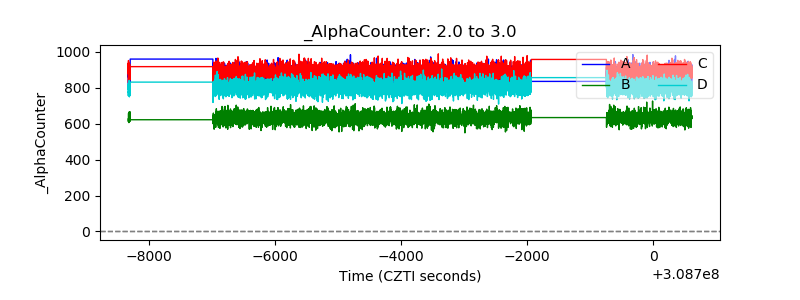 |
| _CPM_Rate | 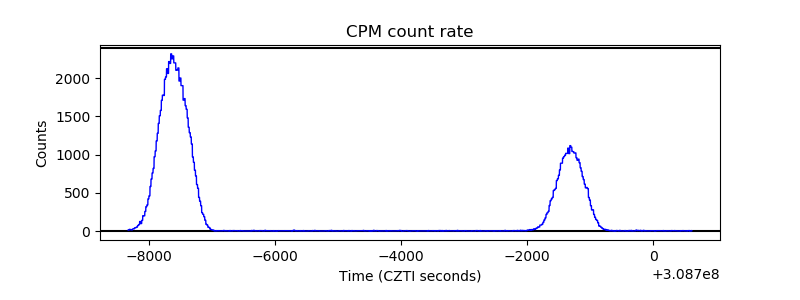 |
| CZT Counter | 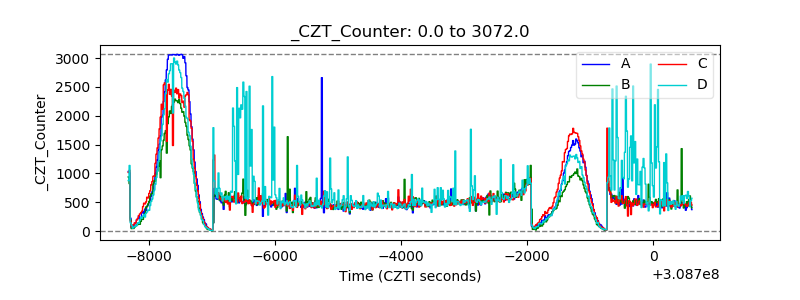 |
| +2.5 Volts monitor |  |
| +5 Volts monitor |  |
| _ROLL_ROT | 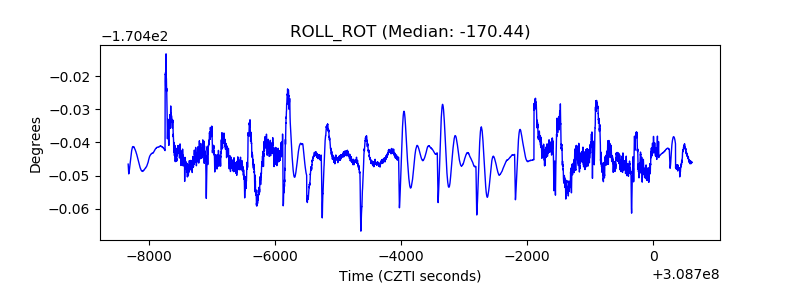 |
| _Roll_DEC | 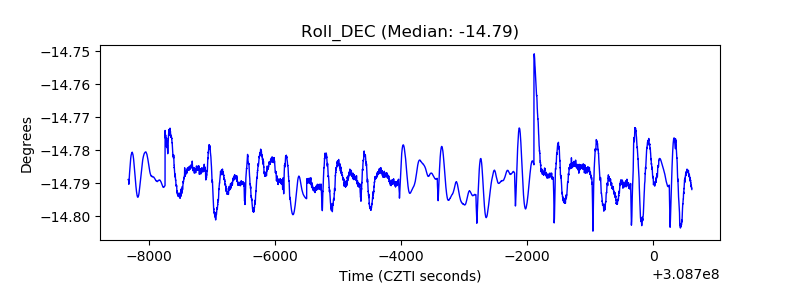 |
| _Roll_RA | 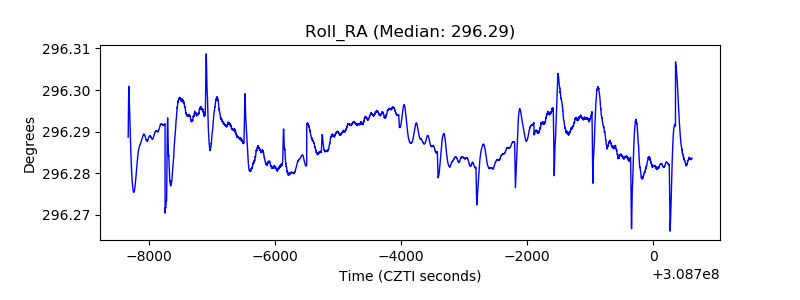 |
| Veto Counter | 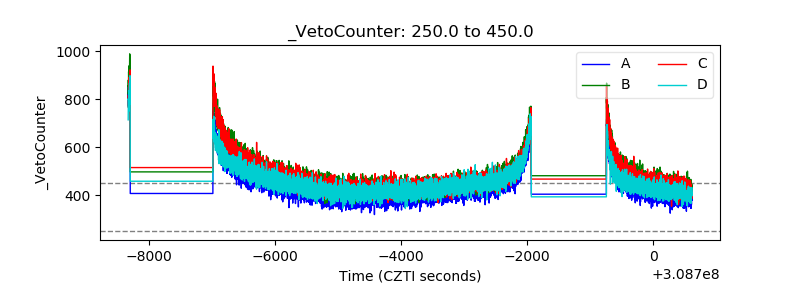 |