| Param | Original file | Final file |
|---|---|---|
| Filename | modeM0/AS1A07_118T01_9000003232_21859cztM0_level2.evt | modeM0/AS1A07_118T01_9000003232_21859cztM0_level2_quad_clean.evt |
| Size (bytes) | 527,117,760 | 95,037,120 |
| Size | 502.7 MB | 90.6 MB |
| Events in quadrant A | 3,524,036 | 600,078 |
| Events in quadrant B | 3,807,980 | 615,333 |
| Events in quadrant C | 3,557,537 | 595,704 |
| Events in quadrant D | 4,586,714 | 566,758 |
| Mode SS | |||
|---|---|---|---|
| Quadrant | BADHDUFLAG | Total packets | Discarded packets |
| A | 0 | 146 | 0 |
| B | 0 | 146 | 0 |
| C | 0 | 146 | 0 |
| D | 0 | 146 | 0 |
| Mode M9 | |||
|---|---|---|---|
| Quadrant | BADHDUFLAG | Total packets | Discarded packets |
| A | 0 | 21 | 0 |
| B | 0 | 21 | 0 |
| C | 0 | 21 | 0 |
| D | 0 | 21 | 0 |
| Mode M0 | |||
|---|---|---|---|
| Quadrant | BADHDUFLAG | Total packets | Discarded packets |
| A | 0 | 15061 | 2 |
| B | 0 | 15850 | 2 |
| C | 0 | 15073 | 2 |
| D | 0 | 18366 | 3 |
| Quadrant | Total seconds | Saturated seconds | Saturation percentage |
|---|---|---|---|
| A | 7181 | 50 | 0.696282% |
| B | 7182 | 120 | 1.670844% |
| C | 7182 | 97 | 1.350599% |
| D | 7181 | 173 | 2.409135% |
Noise dominated data is calculated using 1-second bins in cleaned event files. If a bin has >2000 counts, and if more than 50% of those come from <1% of pixels, then it is considered to be noise-dominated and hence unusable.
| Quadrant | # 1 sec bins | Bins with >0 counts | Bins with >2000 counts | High rate bins dominated by noise | Noise dominated (total time) | Noise dominated (detector-on time) | Marked lightcurve |
|---|---|---|---|---|---|---|---|
| A | 9286 | 7183 | 4 | 4 | 0.04% | 0.06% | 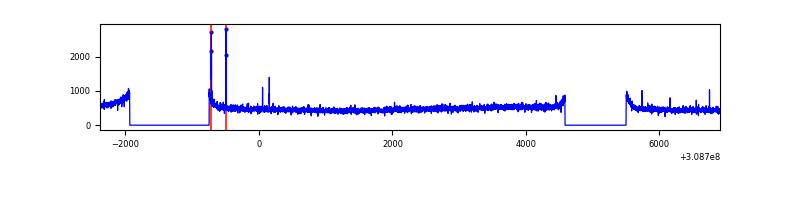 |
| B | 9287 | 7184 | 12 | 12 | 0.13% | 0.17% | 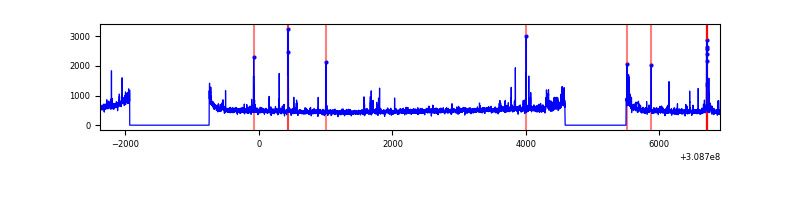 |
| C | 9287 | 7184 | 1 | 1 | 0.01% | 0.01% | 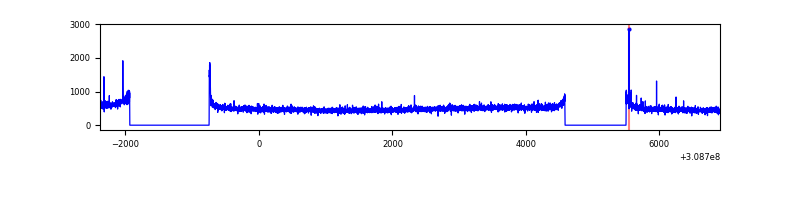 |
| D | 9286 | 7183 | 168 | 168 | 1.81% | 2.34% | 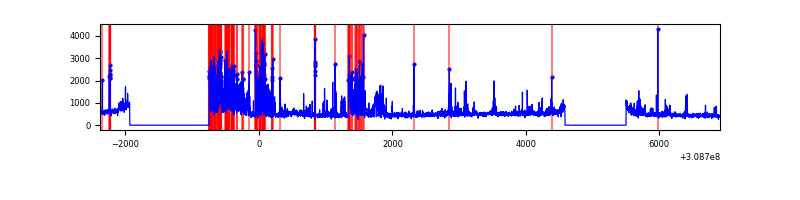 |
Top three noisy pixels from each quadrant. If the there are fewer than three noisy pixels in the level2.evt file, extra rows are filled as -1
| Pixel properties | Quadrant properties | ||||||
|---|---|---|---|---|---|---|---|
| Quadrant | DetID | PixID | Counts | Sigma | Mean | Median | Sigma |
| A | 4 | 2 | 27000 | 141.7 | 905 | 885 | 184.3 |
| A | 13 | 254 | 13344 | 67.6 | 905 | 885 | 184.3 |
| A | 0 | 226 | 7842 | 37.75 | 905 | 885 | 184.3 |
| B | 3 | 64 | 85931 | 489.65 | 909 | 888 | 173.7 |
| B | 0 | 230 | 81941 | 466.67 | 909 | 888 | 173.7 |
| B | 0 | 190 | 36714 | 206.27 | 909 | 888 | 173.7 |
| C | 14 | 238 | 136134 | 665.87 | 869 | 875 | 203.1 |
| C | 5 | 112 | 17458 | 81.64 | 869 | 875 | 203.1 |
| C | 0 | 10 | 14710 | 68.11 | 869 | 875 | 203.1 |
| D | 1 | 52 | 728297 | 3416.4 | 868 | 842 | 212.9 |
| D | 7 | 238 | 461059 | 2161.35 | 868 | 842 | 212.9 |
| D | 13 | 174 | 32862 | 150.38 | 868 | 842 | 212.9 |
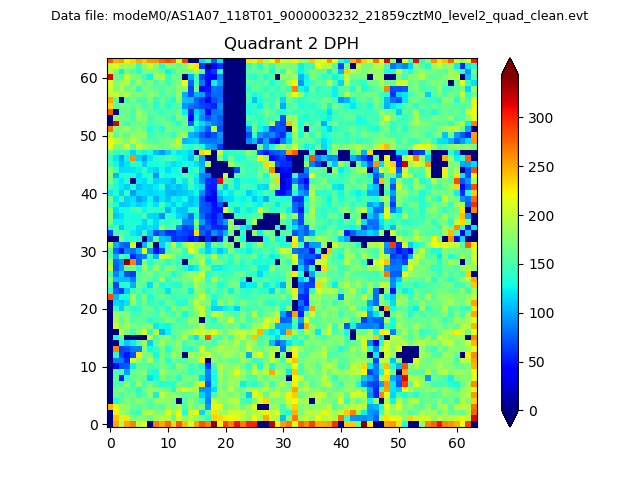
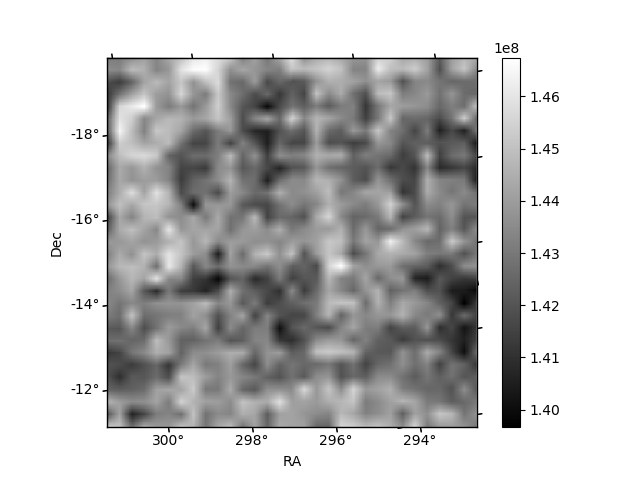
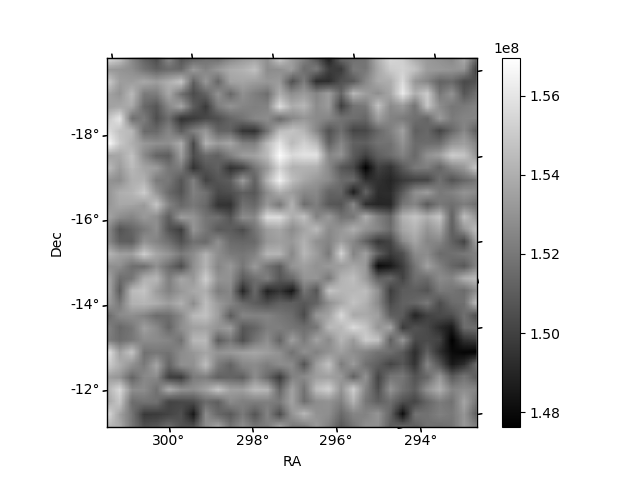
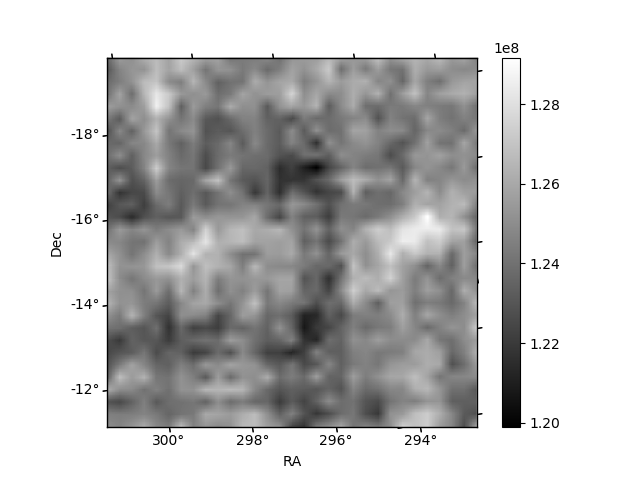
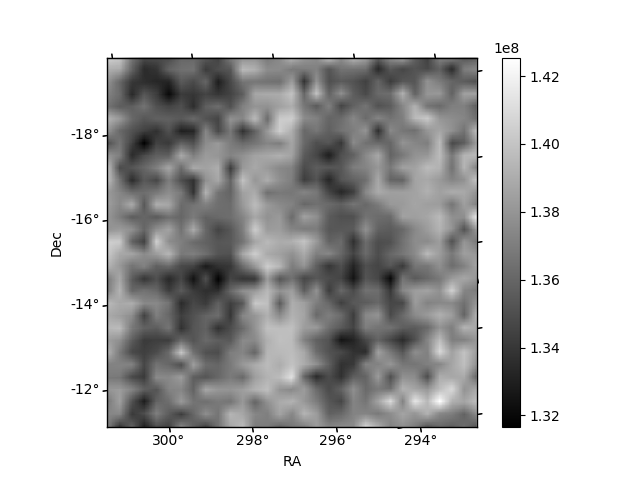
Histogram calculated using DETX and DETY for each event in the final _common_clean file
| Quadrant A | 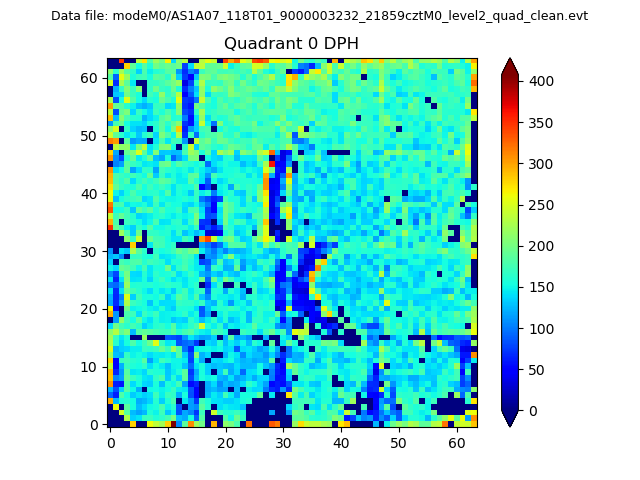 |
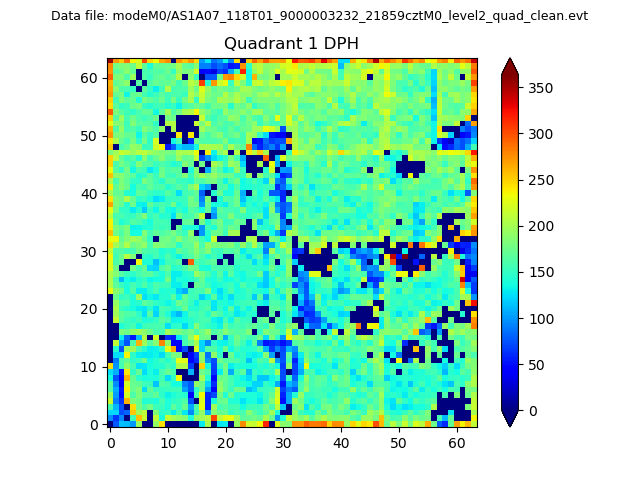 |
Quadrant B |
|---|---|---|---|
| Quadrant D | 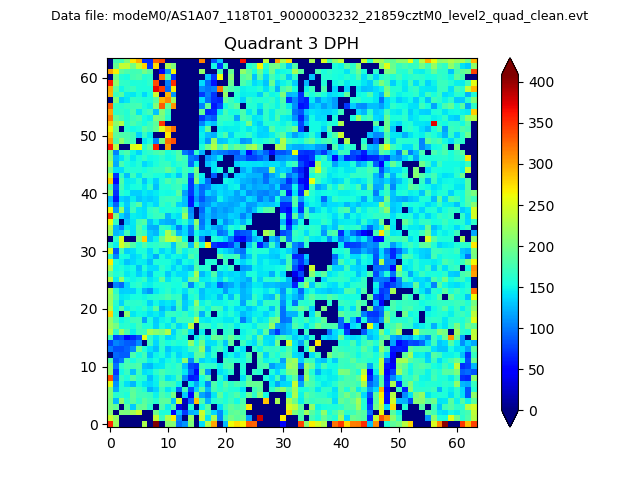 |
 |
Quadrant C |
| Plot type | Count rate plots | Images |
|---|---|---|
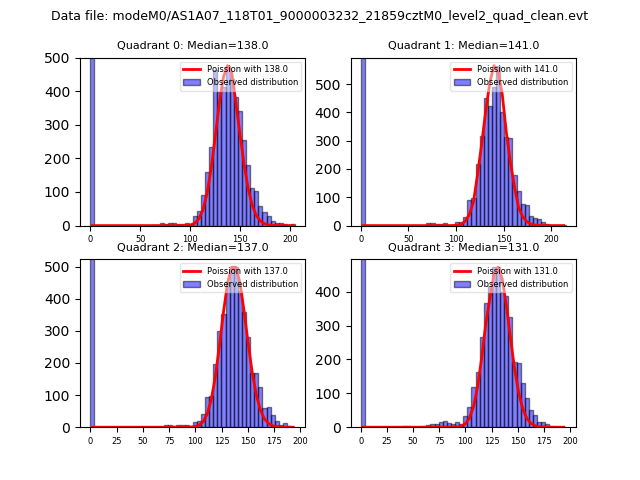
| Comparison with Poisson distribution Blue bars denote a histogram of data divided into 1 sec bins. Red curve is a Poisson curve with rate = median count rate of data. |
 |
 |
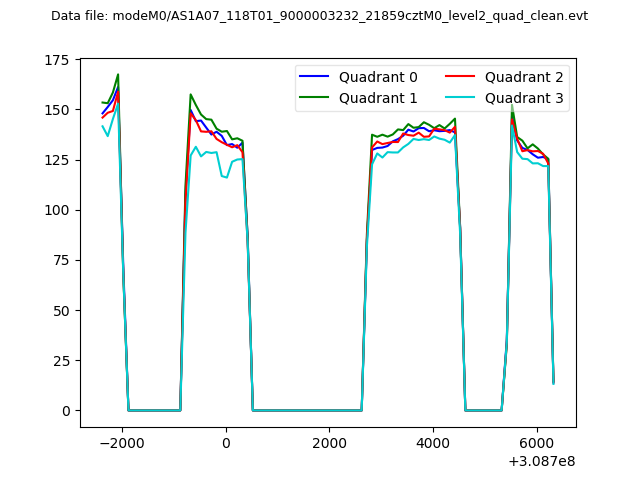
| Quadrant-wise count rates Data is divided into 100 sec bins |
 |
|
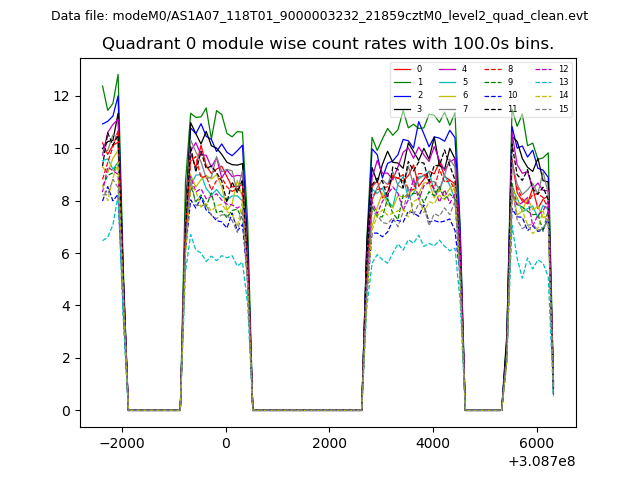
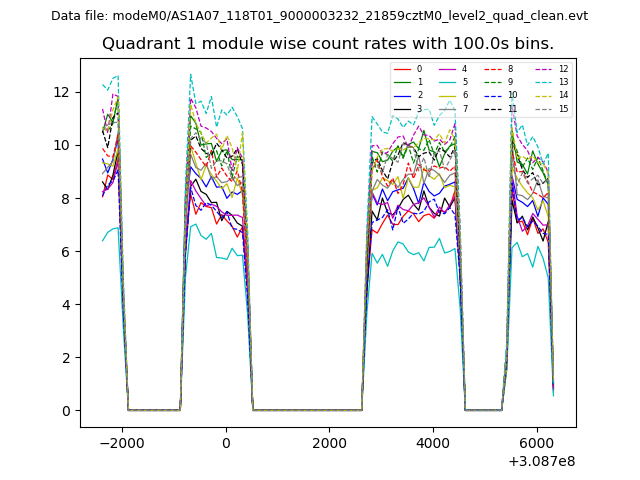
| Module-wise count rates for Quadrant A Data is divided into 100 sec bins |
 |
 |
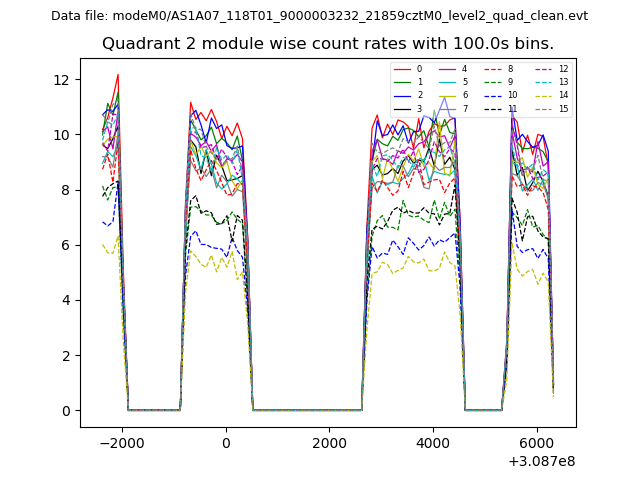
| Module-wise count rates for Quadrant B Data is divided into 100 sec bins |
 |
 |
| Module-wise count rates for Quadrant C Data is divided into 100 sec bins |
 |
 |
| Module-wise count rates for Quadrant D Data is divided into 100 sec bins |
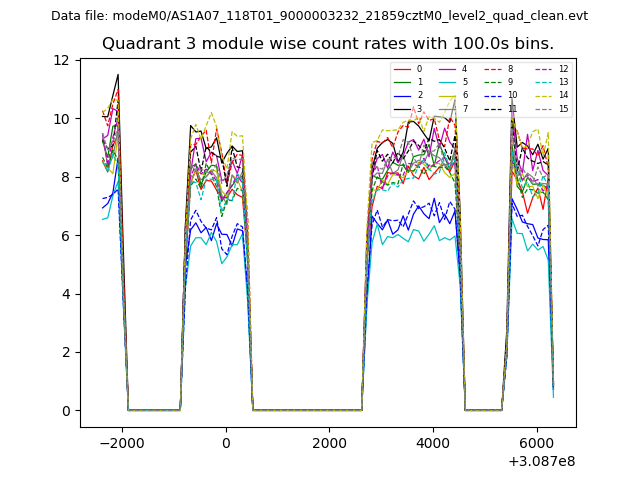 |
 |
| Parameter | Plot |
|---|---|
| CZT HV Monitor | 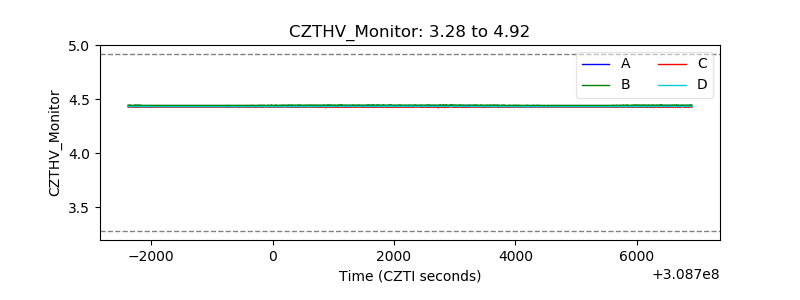 |
| D_VDD |  |
| Temperature 1 | 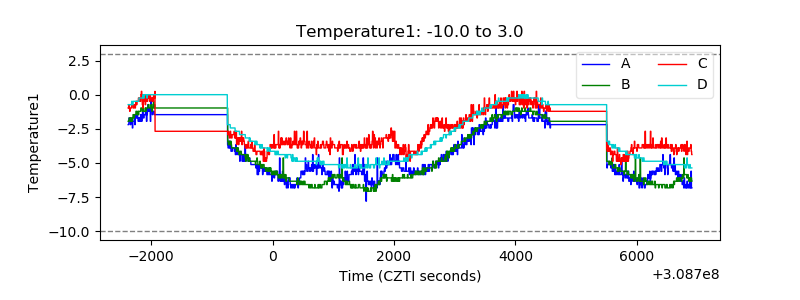 |
| Veto HV Monitor | 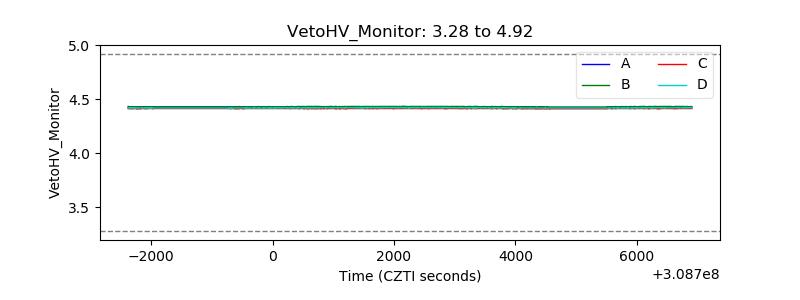 |
| Veto LLD | 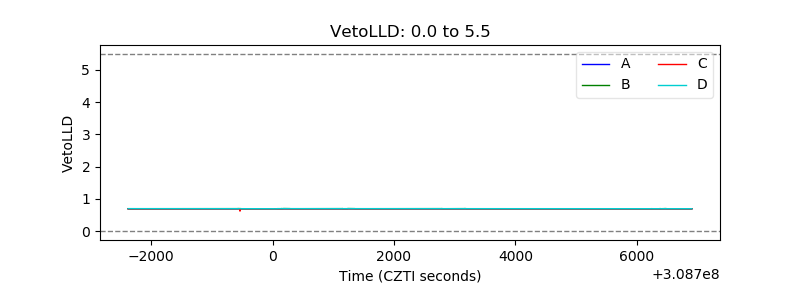 |
| Alpha Counter | 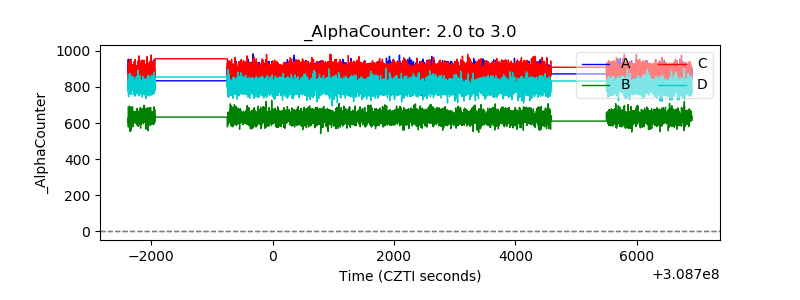 |
| _CPM_Rate | 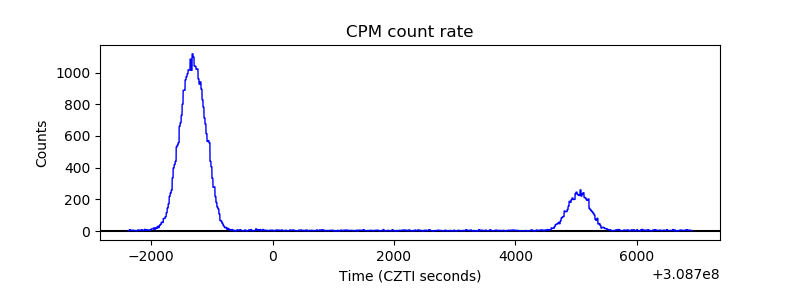 |
| CZT Counter | 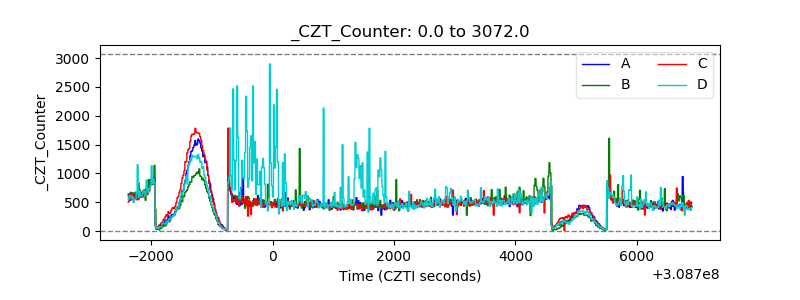 |
| +2.5 Volts monitor |  |
| +5 Volts monitor |  |
| _ROLL_ROT | 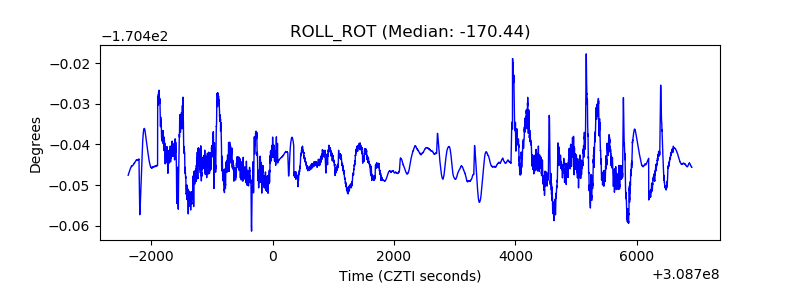 |
| _Roll_DEC | 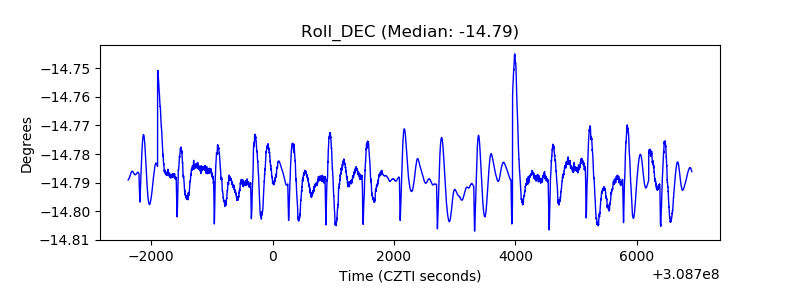 |
| _Roll_RA |  |
| Veto Counter | 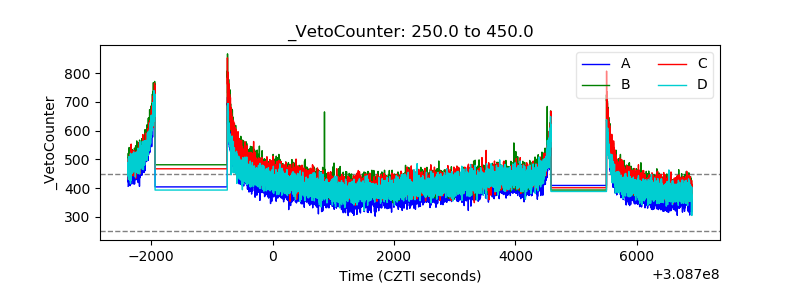 |