| Param | Original file | Final file |
|---|---|---|
| Filename | modeM0/AS1A07_118T01_9000003232_21861cztM0_level2.evt | modeM0/AS1A07_118T01_9000003232_21861cztM0_level2_quad_clean.evt |
| Size (bytes) | 577,411,200 | 75,519,360 |
| Size | 550.7 MB | 72.0 MB |
| Events in quadrant A | 3,680,099 | 460,468 |
| Events in quadrant B | 4,016,695 | 464,603 |
| Events in quadrant C | 3,604,245 | 459,074 |
| Events in quadrant D | 5,679,524 | 382,825 |
| Mode SS | |||
|---|---|---|---|
| Quadrant | BADHDUFLAG | Total packets | Discarded packets |
| A | 0 | 150 | 0 |
| B | 0 | 150 | 0 |
| C | 0 | 150 | 0 |
| D | 0 | 150 | 0 |
| Mode M9 | |||
|---|---|---|---|
| Quadrant | BADHDUFLAG | Total packets | Discarded packets |
| A | 0 | 2 | 0 |
| B | 0 | 2 | 0 |
| C | 0 | 2 | 0 |
| D | 0 | 2 | 0 |
| Mode M0 | |||
|---|---|---|---|
| Quadrant | BADHDUFLAG | Total packets | Discarded packets |
| A | 0 | 15869 | 0 |
| B | 0 | 16669 | 0 |
| C | 0 | 15500 | 0 |
| D | 0 | 21929 | 0 |
| Quadrant | Total seconds | Saturated seconds | Saturation percentage |
|---|---|---|---|
| A | 7462 | 164 | 2.197802% |
| B | 7462 | 285 | 3.819351% |
| C | 7463 | 192 | 2.572692% |
| D | 7463 | 1025 | 13.734423% |
Noise dominated data is calculated using 1-second bins in cleaned event files. If a bin has >2000 counts, and if more than 50% of those come from <1% of pixels, then it is considered to be noise-dominated and hence unusable.
| Quadrant | # 1 sec bins | Bins with >0 counts | Bins with >2000 counts | High rate bins dominated by noise | Noise dominated (total time) | Noise dominated (detector-on time) | Marked lightcurve |
|---|---|---|---|---|---|---|---|
| A | 7622 | 7462 | 4 | 4 | 0.05% | 0.05% | 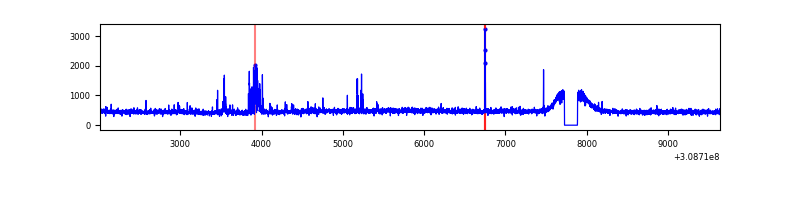 |
| B | 7622 | 7463 | 77 | 77 | 1.01% | 1.03% | 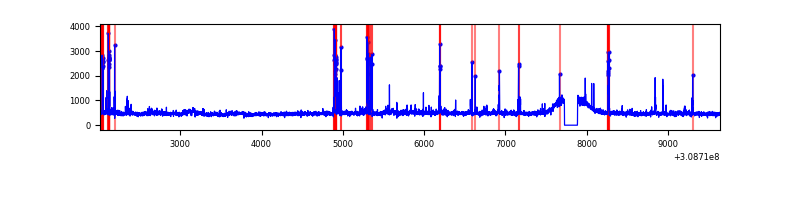 |
| C | 7623 | 7463 | 0 | 0 | 0.00% | 0.00% | 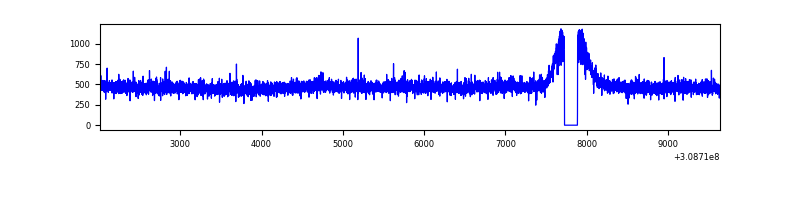 |
| D | 7623 | 7464 | 630 | 630 | 8.26% | 8.44% | 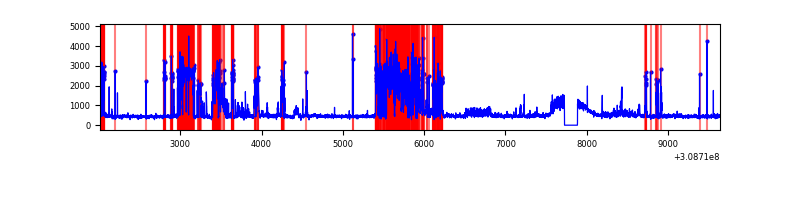 |
Top three noisy pixels from each quadrant. If the there are fewer than three noisy pixels in the level2.evt file, extra rows are filled as -1
| Pixel properties | Quadrant properties | ||||||
|---|---|---|---|---|---|---|---|
| Quadrant | DetID | PixID | Counts | Sigma | Mean | Median | Sigma |
| A | 5 | 16 | 92278 | 492.06 | 914 | 895 | 185.7 |
| A | 4 | 2 | 58312 | 309.17 | 914 | 895 | 185.7 |
| A | 13 | 254 | 13775 | 69.35 | 914 | 895 | 185.7 |
| B | 3 | 64 | 327875 | 1844.62 | 913 | 891 | 177.3 |
| B | 4 | 171 | 30790 | 168.67 | 913 | 891 | 177.3 |
| B | 12 | 111 | 21754 | 117.69 | 913 | 891 | 177.3 |
| C | 14 | 238 | 137613 | 651.82 | 883 | 891 | 209.8 |
| C | 8 | 128 | 11811 | 52.06 | 883 | 891 | 209.8 |
| C | 13 | 61 | 6190 | 25.26 | 883 | 891 | 209.8 |
| D | 1 | 52 | 2462810 | 12238.49 | 819 | 797 | 201.2 |
| D | 12 | 227 | 30612 | 148.21 | 819 | 797 | 201.2 |
| D | 2 | 234 | 29935 | 144.84 | 819 | 797 | 201.2 |
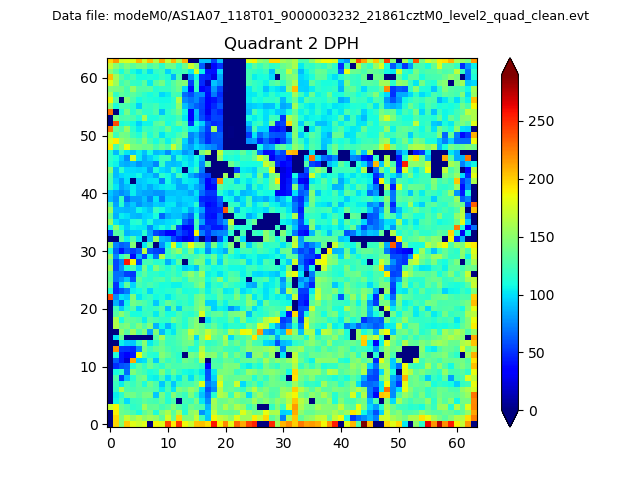
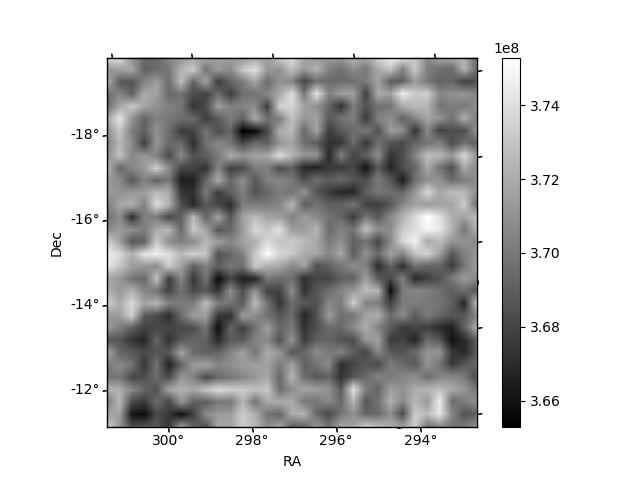
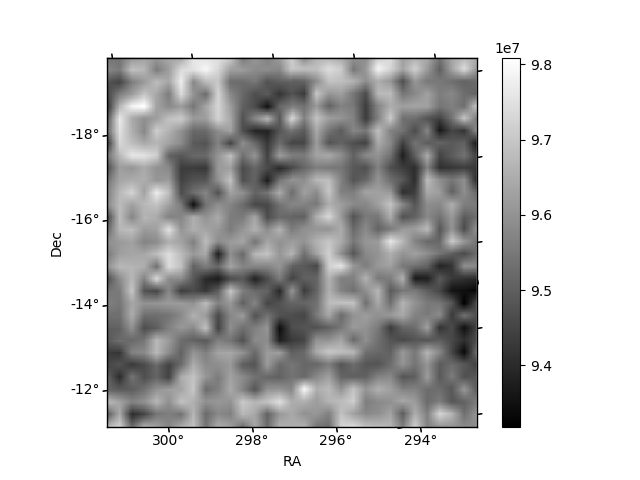
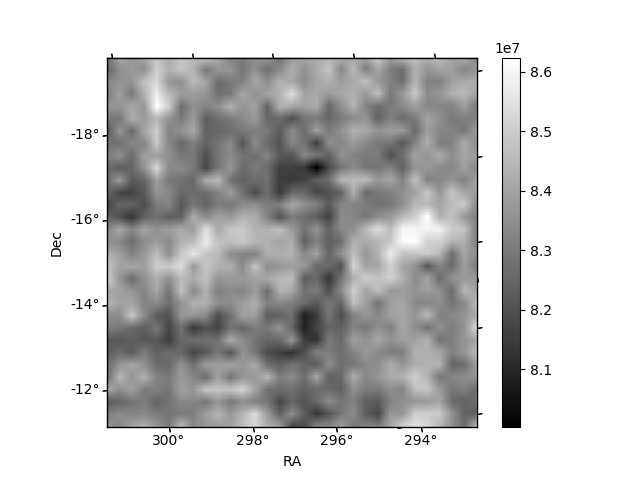
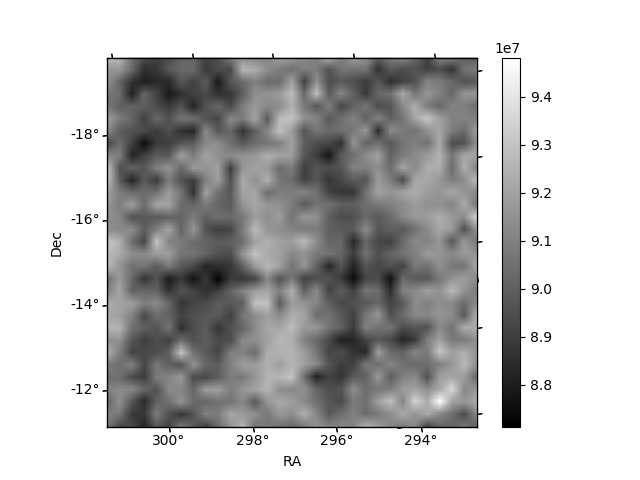
Histogram calculated using DETX and DETY for each event in the final _common_clean file
| Quadrant A | 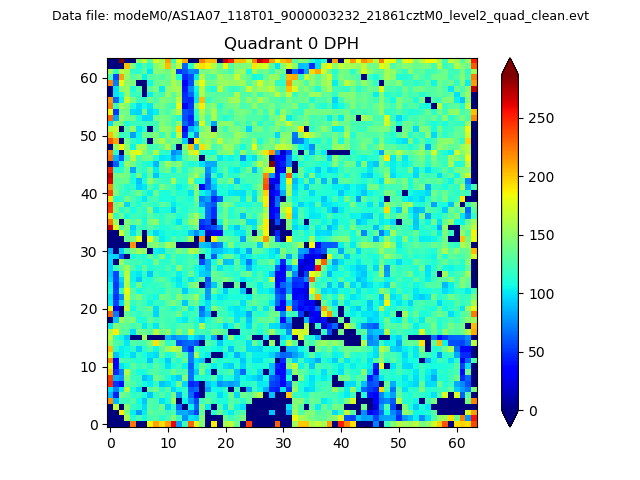 |
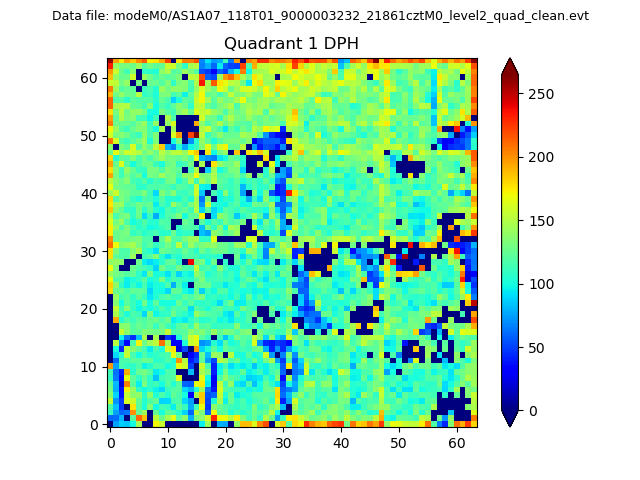 |
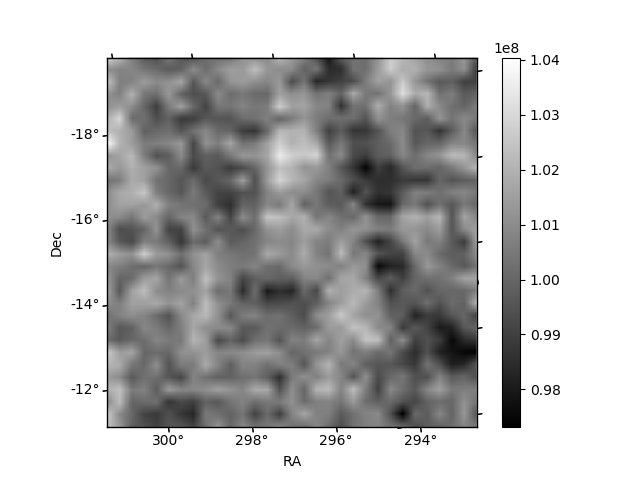
Quadrant B |
|---|---|---|---|
| Quadrant D | 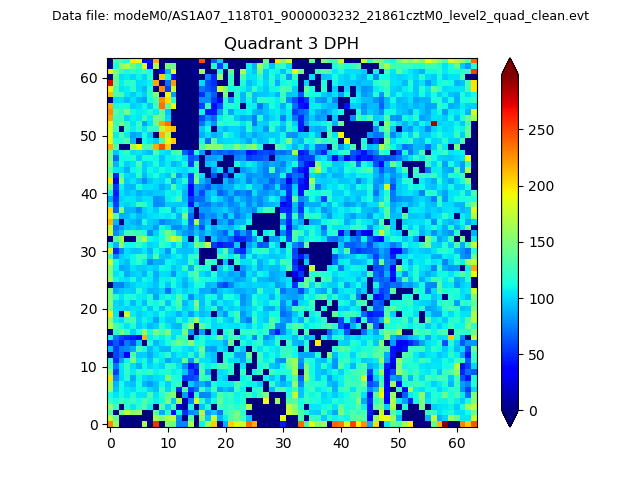 |
 |
Quadrant C |
| Plot type | Count rate plots | Images |
|---|---|---|
| Comparison with Poisson distribution Blue bars denote a histogram of data divided into 1 sec bins. Red curve is a Poisson curve with rate = median count rate of data. |
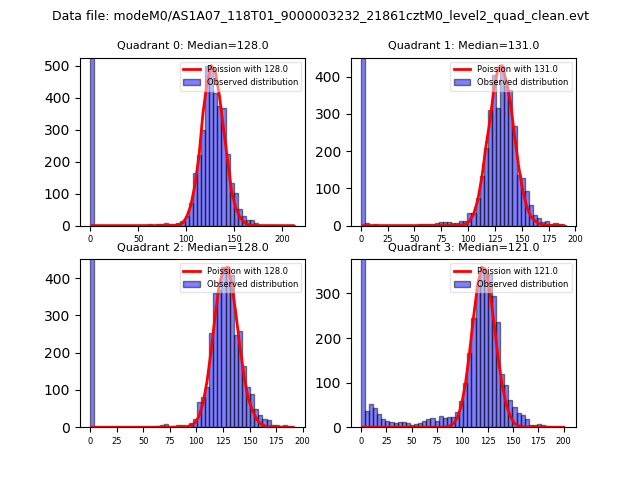 |
 |
| Quadrant-wise count rates Data is divided into 100 sec bins |
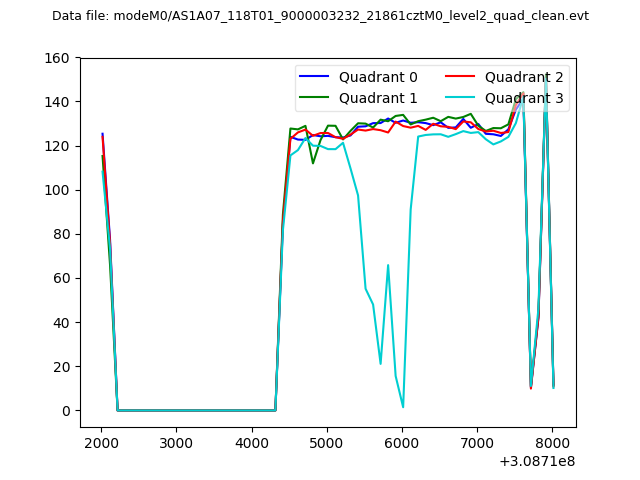 |
|
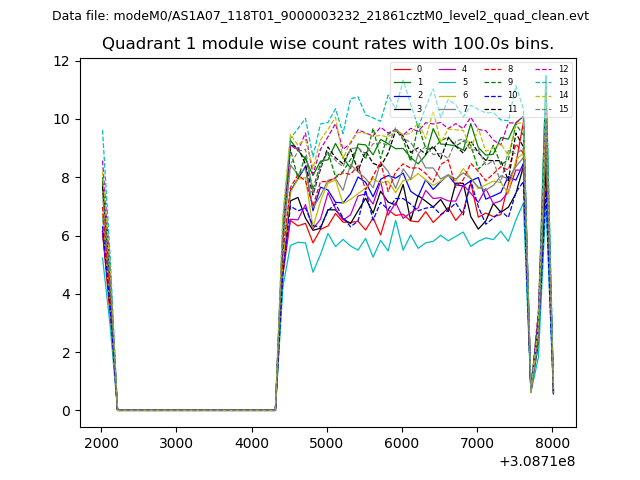
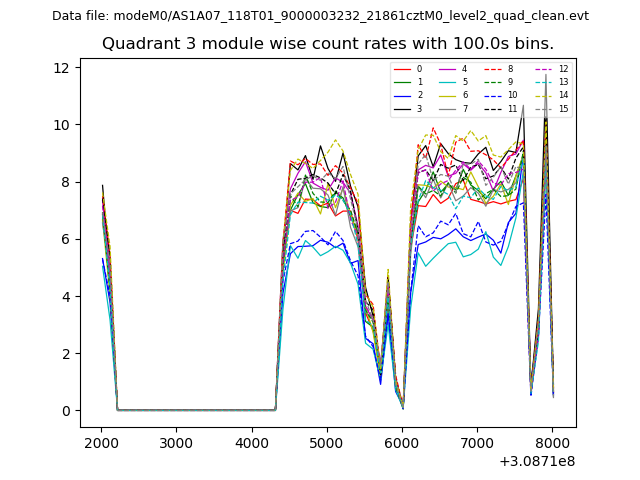
| Module-wise count rates for Quadrant A Data is divided into 100 sec bins |
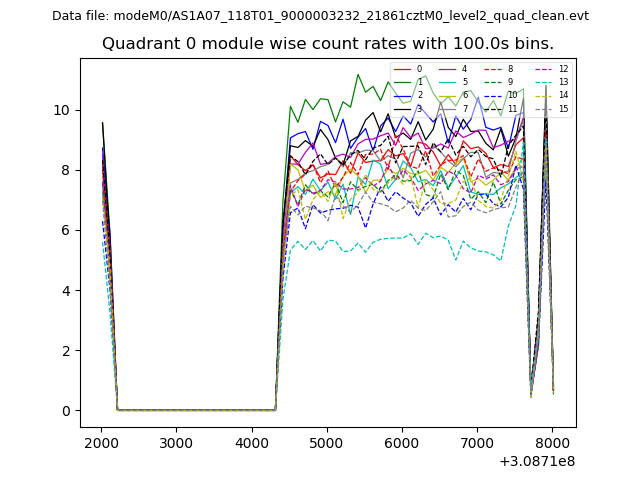 |
 |
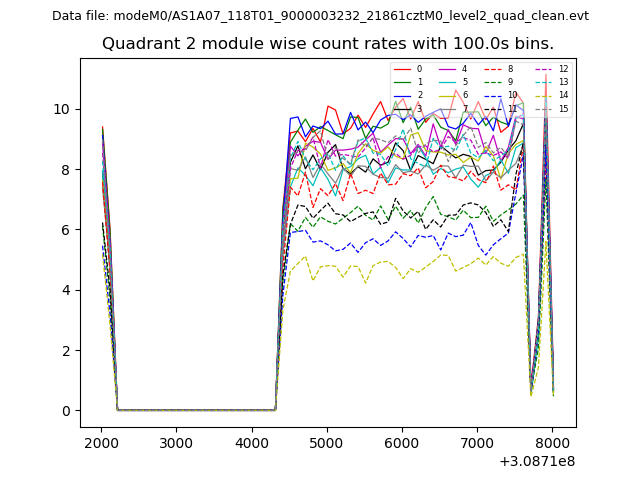
| Module-wise count rates for Quadrant B Data is divided into 100 sec bins |
 |
 |
| Module-wise count rates for Quadrant C Data is divided into 100 sec bins |
 |
 |
| Module-wise count rates for Quadrant D Data is divided into 100 sec bins |
 |
 |
| Parameter | Plot |
|---|---|
| CZT HV Monitor | 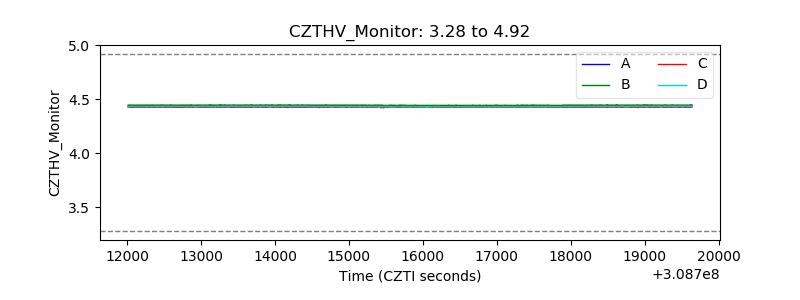 |
| D_VDD | 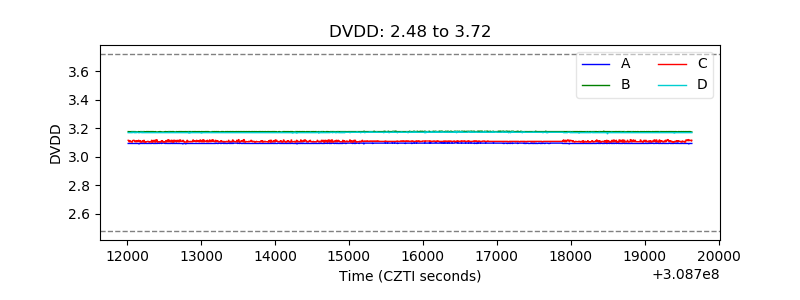 |
| Temperature 1 | 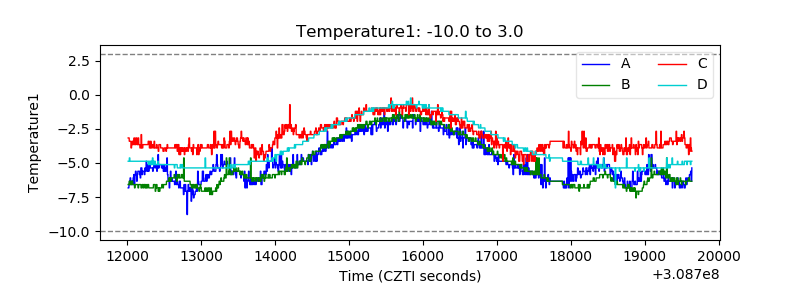 |
| Veto HV Monitor |  |
| Veto LLD | 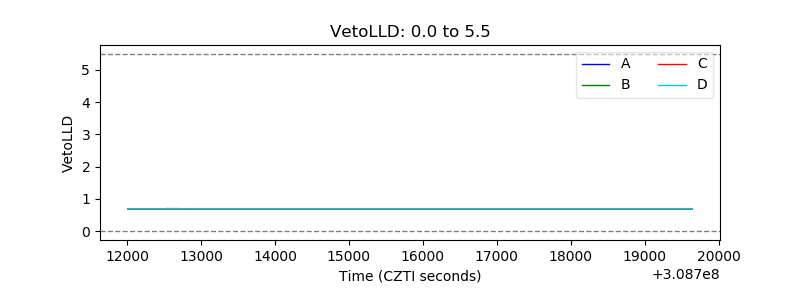 |
| Alpha Counter | 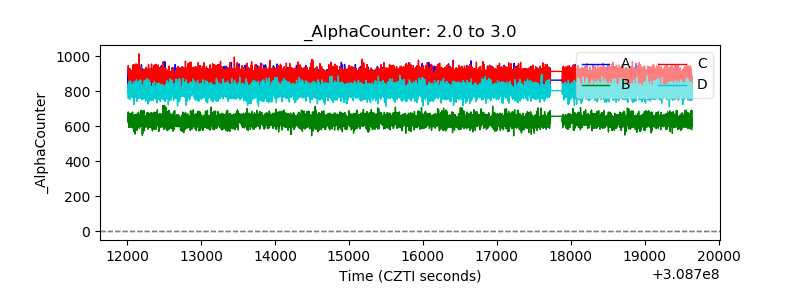 |
| _CPM_Rate | 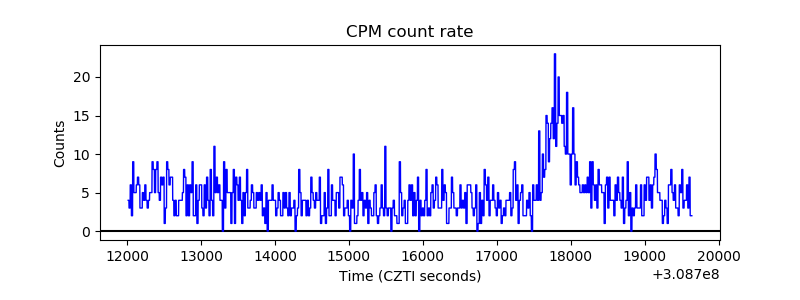 |
| CZT Counter | 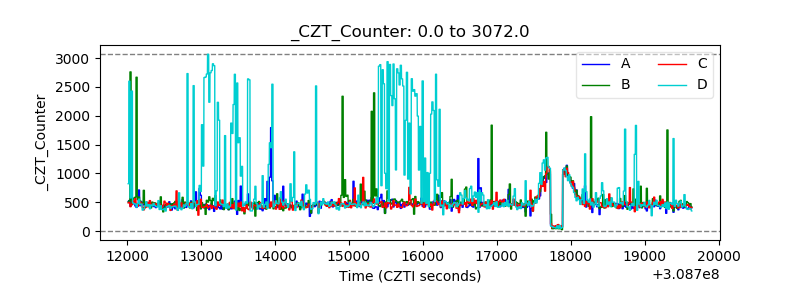 |
| +2.5 Volts monitor |  |
| +5 Volts monitor |  |
| _ROLL_ROT | 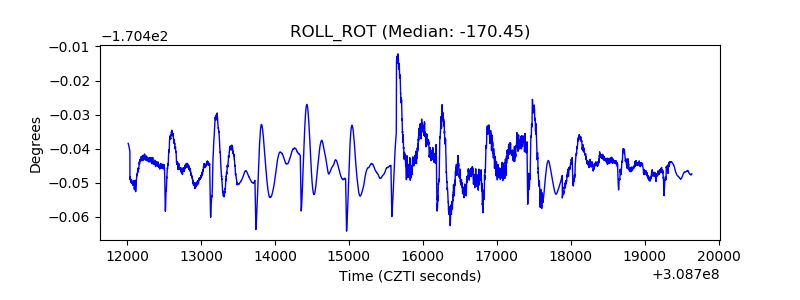 |
| _Roll_DEC | 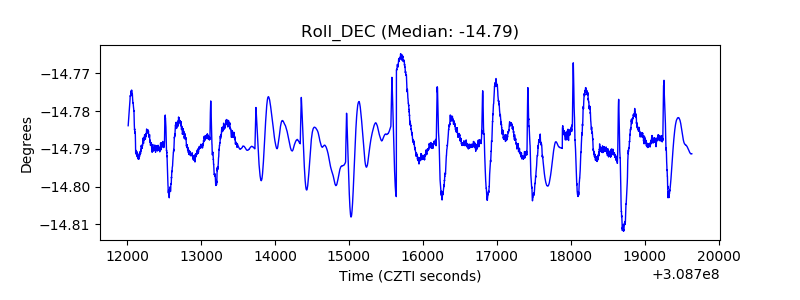 |
| _Roll_RA | 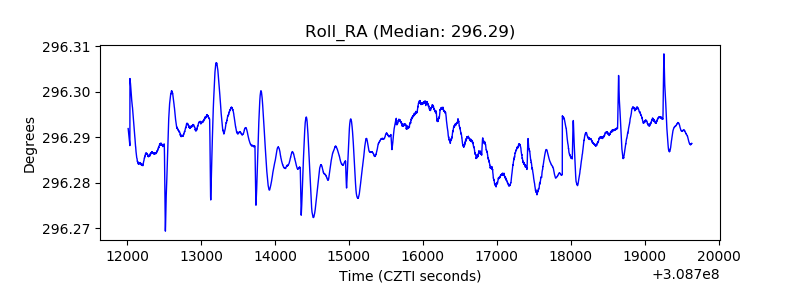 |
| Veto Counter | 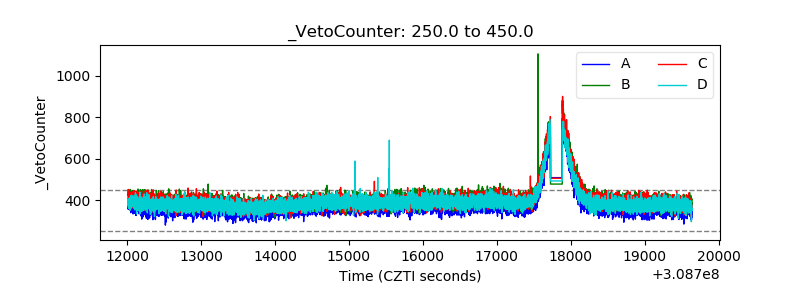 |